Fig. 7
Download original image
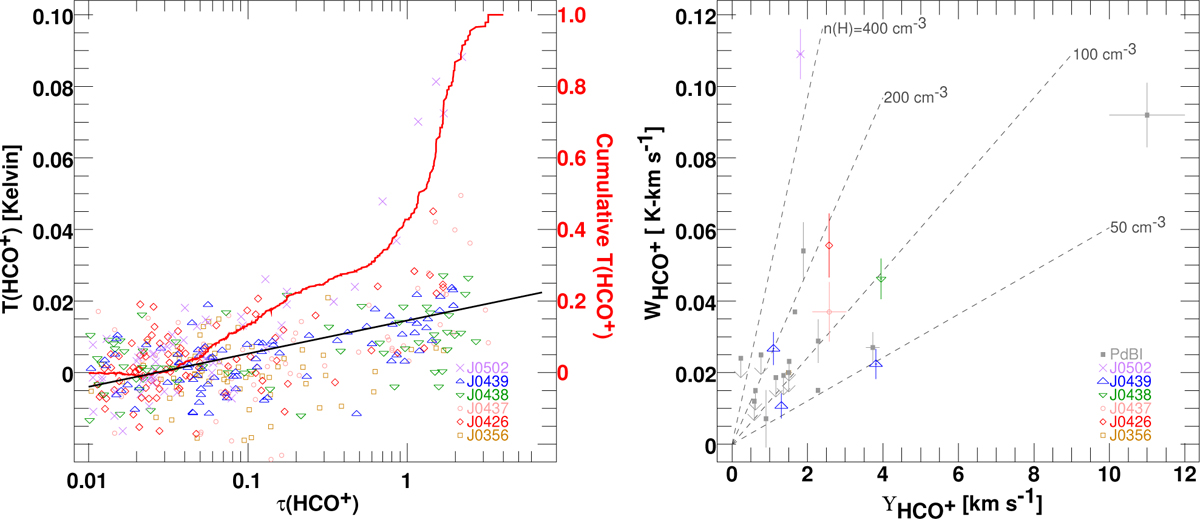
HCO+ emission plotted against absorption. Left: channel values of emission brightness and absorption for the new data shown in Figure 6. The excitation temperature corresponding to the regression line is 2.758 K. Right: integrated emission brightness against integrated absorption ϒHCO+ for the new and old data. Superposed at the right are the locii of constant number density n(H) for diffuse purely molecular gas using results for the weak excitation limit (including electrons) described by Liszt & Pety (2016) (see Section 5.1 for an explanation of the underlying physics).
Current usage metrics show cumulative count of Article Views (full-text article views including HTML views, PDF and ePub downloads, according to the available data) and Abstracts Views on Vision4Press platform.
Data correspond to usage on the plateform after 2015. The current usage metrics is available 48-96 hours after online publication and is updated daily on week days.
Initial download of the metrics may take a while.