Fig. 4
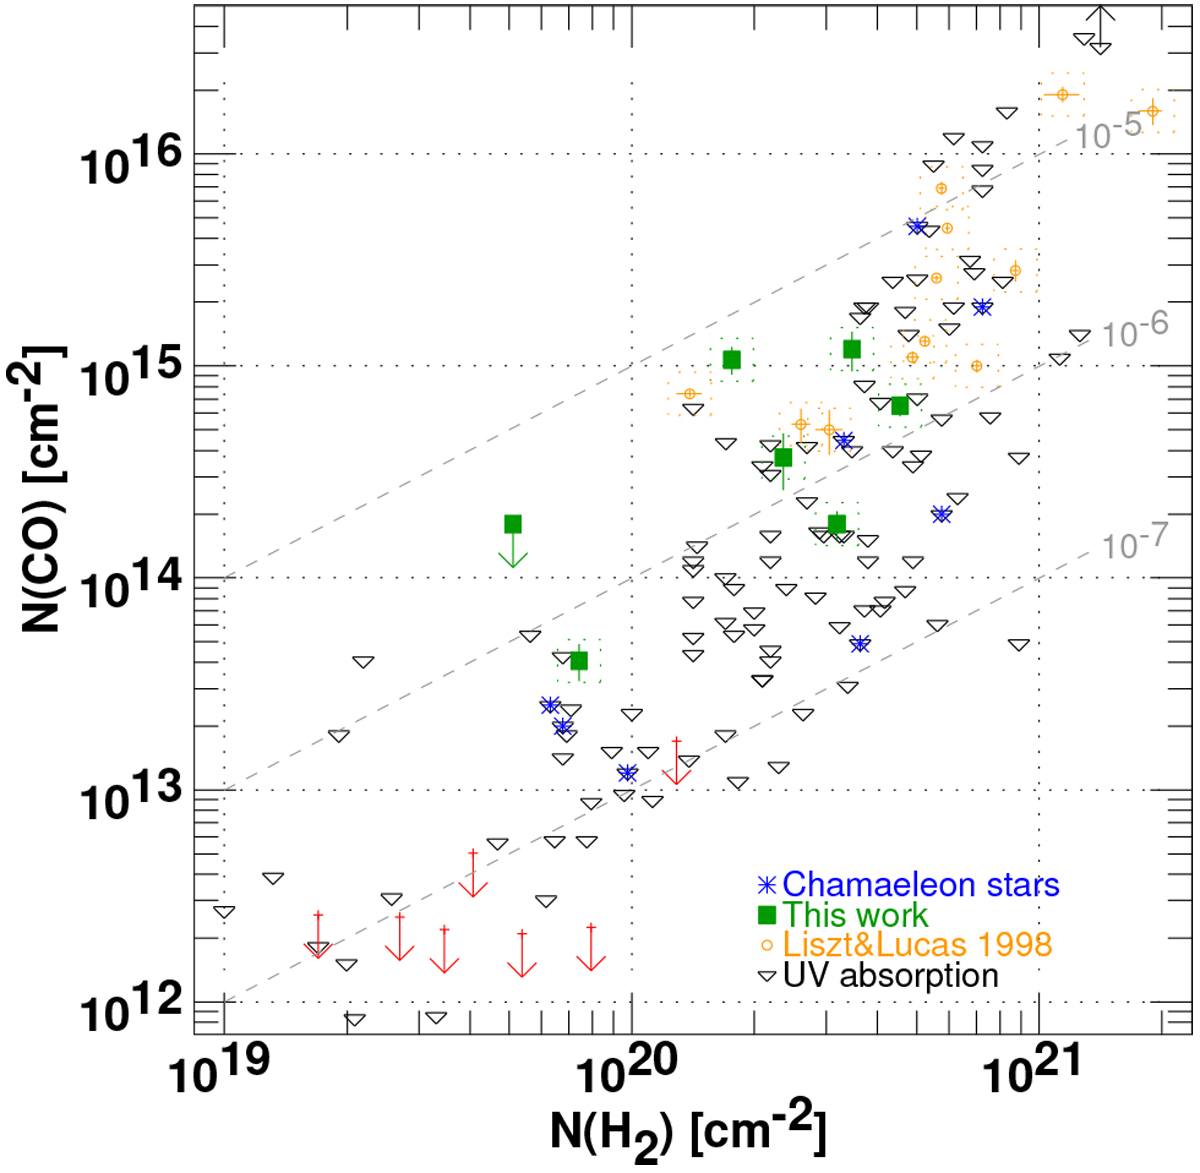
H2 and CO column densities from UV and radio absorption spectra. Shown are UV absorption line measurements from Sonnentrucker et al. (2007), Burgh et al. (2007) and Sheffer et al. (2008) (downward-pointing triangles), mm-wave results from Liszt & Lucas (1998) (small orange circles), and results from this work (green filled squares). Some informative upper limits to UV measurements are shown in red. The mm-wave results assume N(H2) = N(HCO+)/3 × 10−9 and the present results use Eq. (2) to derive N(CO). UV absorption sightlines in Chamaeleon are marked by blue asterisks, see Table 4. Grey dashed lines show the locii of relative abundances N(CO)/N(H2) as indicated. Only sighlines with N(CO) > 1015 cm−2 are observable in present wide-field CO emission surveys.
Current usage metrics show cumulative count of Article Views (full-text article views including HTML views, PDF and ePub downloads, according to the available data) and Abstracts Views on Vision4Press platform.
Data correspond to usage on the plateform after 2015. The current usage metrics is available 48-96 hours after online publication and is updated daily on week days.
Initial download of the metrics may take a while.