Fig. 5
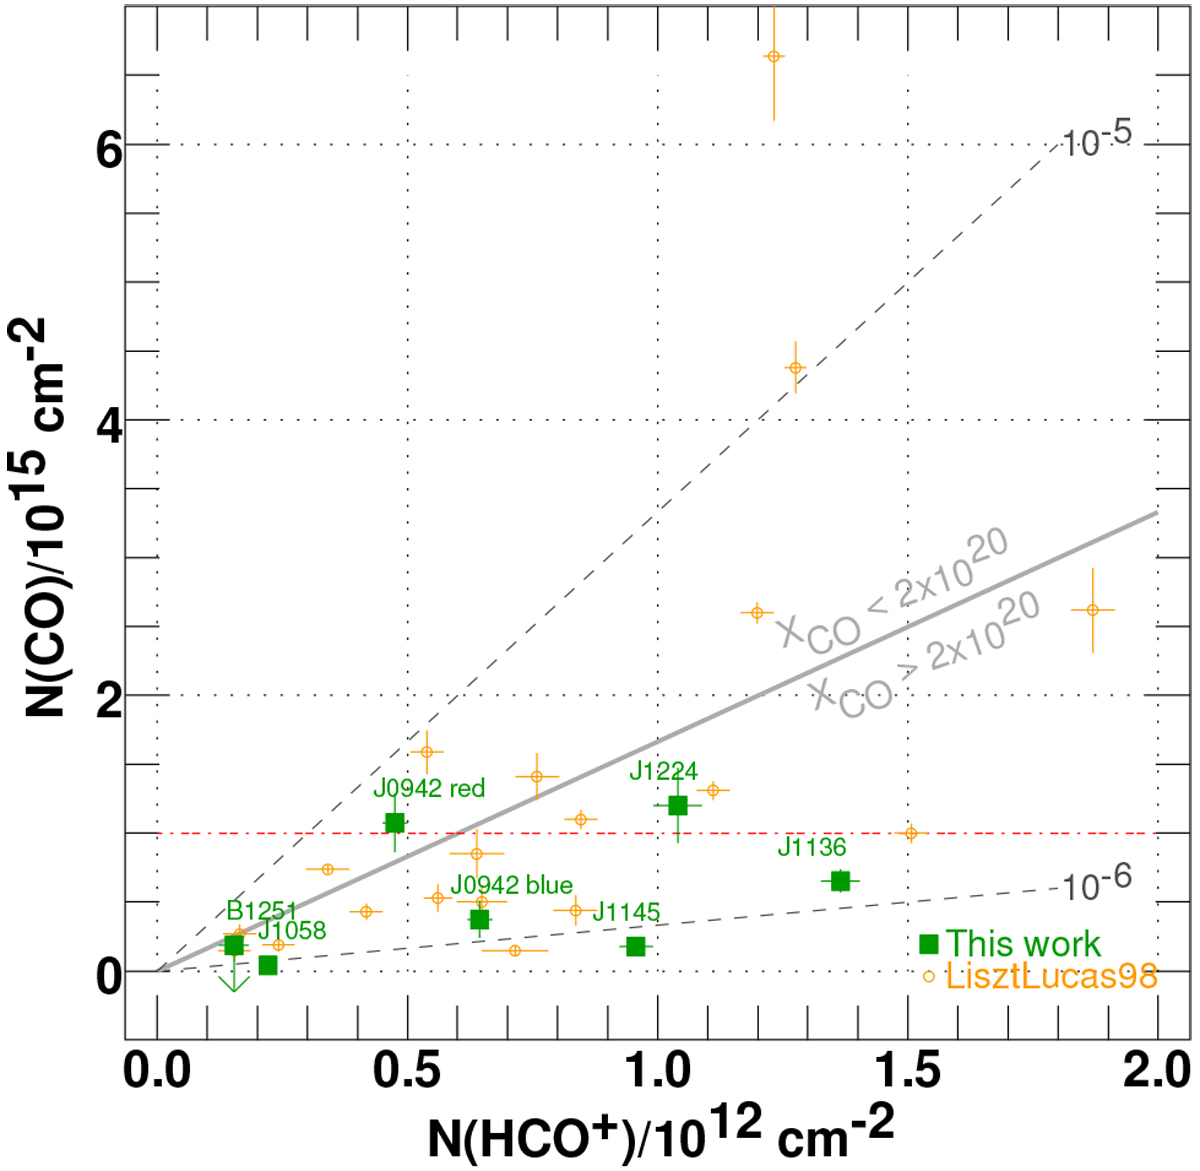
CO and HCO+ column densities. Shown are results from this work (larger green filled squares) and the earlier observations of Liszt & Lucas (1998) (small orange circles). Integrated CO J = 1− 0 optical depths ϒCO have been converted to CO column density using the relationship between ϒCO and N(CO) shown in Fig. 3, N(CO) = 1.861 × 1015 cm−2 ϒCO1.131. Grey dashed shaded lines show fiducial values N(CO)/N(H2) = 10−6 and 10−5 assuming N(HCO+)/N(H2) = 3 × 10⁻⁹. The broad grey line at N(CO)/N(H2) = 5 × 10⁻⁶ divides the plot area into regions where XCO is larger or smaller than 2 × 10²⁰H2 (K km s−1)−1. The red dash-dotted line at N(CO) = 1015cm−2 shows the CO column density at which the integrated J = 1−0 emission brightness WCO = 1 K km s−1.
Current usage metrics show cumulative count of Article Views (full-text article views including HTML views, PDF and ePub downloads, according to the available data) and Abstracts Views on Vision4Press platform.
Data correspond to usage on the plateform after 2015. The current usage metrics is available 48-96 hours after online publication and is updated daily on week days.
Initial download of the metrics may take a while.