Fig. 8
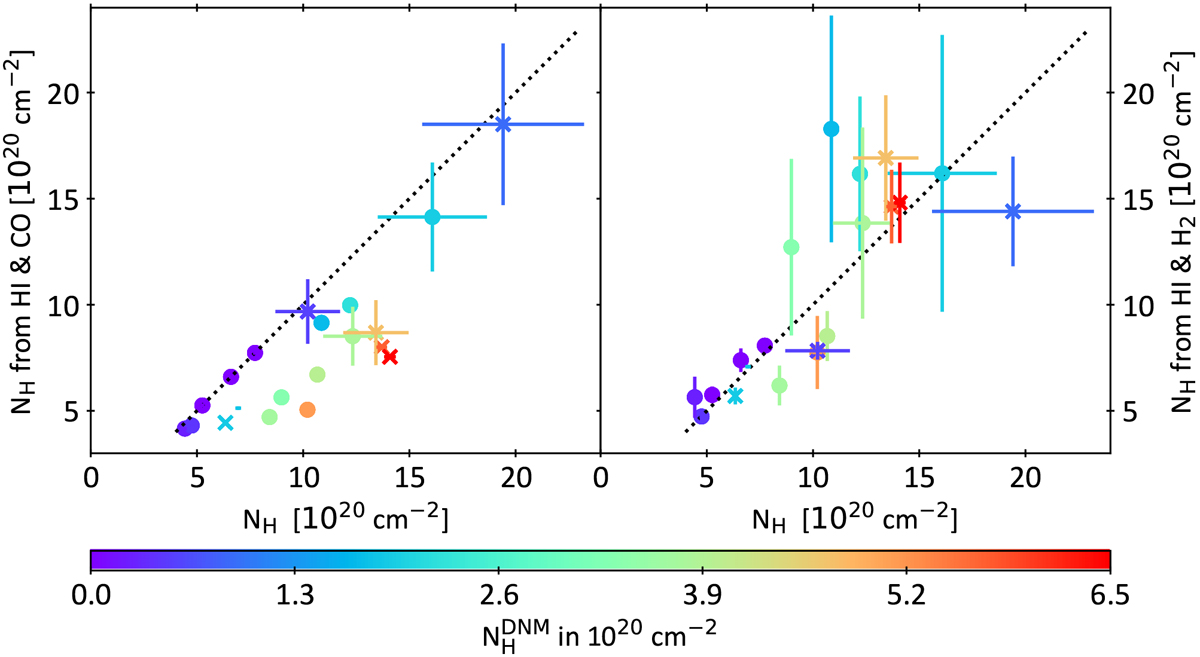
Comparison of total column density of H-nuclei N(H) derived from the DNM analysis and from observable column densities. The variable plotted along the horizontal axis, N(H) = N(HI)|cham+N(DNM)+2WCO![]() , is the quantity fitted in the global DNM analysis (Planck Collaboration Int. XXVIII 2015) and is the same in both panels. The vertical axis in each panel is the inferred total hydrogen column density N(H) = N(HI)|cham+2N(H2) but with N(H2) taken differently at left and right. At left, N(H) is calculated with N(H2) = WCO
, is the quantity fitted in the global DNM analysis (Planck Collaboration Int. XXVIII 2015) and is the same in both panels. The vertical axis in each panel is the inferred total hydrogen column density N(H) = N(HI)|cham+2N(H2) but with N(H2) taken differently at left and right. At left, N(H) is calculated with N(H2) = WCO![]() . At right, N(H) is calculated with N(H2) = N(HCO+)∕3 × 10⁻⁹ for the sightlines observed in HCO+ absorption, or using actual measured N(H2) for the stars with measured N(H2) and N(CO) (see Fig. 4 and Table 4). The error bars assume ± 25% errors in N(H2) from UV absorption and ± 58% errors in the N(HCO+)/N(H2) ratio. Stars are marked by crosses and mm-wave targets by filled circles, and all sightlines are color-coded according to N(DNM) as shown at bottom.
. At right, N(H) is calculated with N(H2) = N(HCO+)∕3 × 10⁻⁹ for the sightlines observed in HCO+ absorption, or using actual measured N(H2) for the stars with measured N(H2) and N(CO) (see Fig. 4 and Table 4). The error bars assume ± 25% errors in N(H2) from UV absorption and ± 58% errors in the N(HCO+)/N(H2) ratio. Stars are marked by crosses and mm-wave targets by filled circles, and all sightlines are color-coded according to N(DNM) as shown at bottom.
Current usage metrics show cumulative count of Article Views (full-text article views including HTML views, PDF and ePub downloads, according to the available data) and Abstracts Views on Vision4Press platform.
Data correspond to usage on the plateform after 2015. The current usage metrics is available 48-96 hours after online publication and is updated daily on week days.
Initial download of the metrics may take a while.