| Issue |
A&A
Volume 696, April 2025
|
|
|---|---|---|
| Article Number | A63 | |
| Number of page(s) | 6 | |
| Section | The Sun and the Heliosphere | |
| DOI | https://doi.org/10.1051/0004-6361/202452096 | |
| Published online | 04 April 2025 | |
Estimating solar-radiation environment extremes
1
Centre for Planetary Habitability (PHAB), Faculty of Mathematics and Natural Sciences, Department of Geosciences, University of Oslo, Sem Sælands vei 2A Blindern, Norway
2
Institut für Planetenforschung (PF), Deutsches Zentrum für Luft- und Raumfahrt (DLR), Rutherfordstr. 2, 12489 Berlin, Germany
3
Institute for Astronomy, Astrophysics, Space Applications and Remote Sensing (IAASARS), National Observatory of Athens. I, Metaxa & Vas. Pavlou St., 15236 Penteli, Greece
⋆ Corresponding authors; konstantin.herbst@geo.uio.no; atpapaio@astro.noa.gr
Received:
3
September
2024
Accepted:
8
February
2025
Context. Extreme solar particle events (ESPEs) were identified almost a decade ago, providing context for super events unleashed by our host star, the Sun. Their assumed solar origin drives the question of their “worst-case” impact, which could be profound, multifaceted, and devastating for our technological society.
Aims. Recently, we proposed a methodology that directly relates the soft X-ray flux (FSXR) of the driving solar flare of a solar energetic particle (SEP) event to its “worst-case” integral fluence spectrum. In this study, we aim to put the letter to the stress test.
Methods. In this study, we employed our previous method to the ESPEs that have been confirmed in cosmogenic radionuclide records to date, retrieved their “worst-case integral spectrum, and compared the latter to the actual – independently obtained – recent reconstructions based on the radionuclide records.
Results. It is shown that our previous method makes it possible to estimate the integral fluence spectra of one of the paleo events, that is, AD774/775, one of the strongest ESPEs found within the cosmogenic radionuclide records so far. We implemented a mean ESPE utilizing four confirmed paleo ESPEs (i.e., AD993/994, AD774/775, 660 BCE, and 7176 BCE) and tested the resulting spectrum against the estimated one. Finally, we tested the same methodology for a series of strong SEP events recorded on the Earth’s surface as ground level enhancement (GLE) events. In all investigated cases, a recent re-calibration of the GOES 1–8 FSXR values is considered.
Conclusions. It is shown that the proposed methodology can adequately estimate the “worst-case” integral fluence spectrum for both strong SEP events and ESPEs, quantifying their impact up to an integral energy of ∼E > 1 GeV.
Key words: Sun: coronal mass ejections (CMEs) / Sun: flares / Sun: particle emission / solar-terrestrial relations / Earth
© The Authors 2025
 Open Access article, published by EDP Sciences, under the terms of the Creative Commons Attribution License (https://creativecommons.org/licenses/by/4.0), which permits unrestricted use, distribution, and reproduction in any medium, provided the original work is properly cited.
This article is published in open access under the Subscribe to Open model. Subscribe to A&A to support open access publication.
1. Introduction
Solar energetic particle (SEP) events represent one of the most dynamic and impactful phenomena in space physics (Reames 2023). These events occur when particles – primarily protons, electrons, and heavier ions – are accelerated to near-relativistic speeds by solar processes (Reames 1999). As a result, the energies of SEP events span from a few kiloelectron volts to a few gigaelectron vols (see discussion in Papaioannou et al. 2023). The relativistic high-energy tail of SEPs is occupied by ground level enhancement (GLEs) events; in these events, particles are energetic enough (E ≥ 300 MeV; see details in Mishev & Poluianov 2021), allowing them to penetrate Earth’s magnetic field and reach the lower atmosphere, producing secondary particles detectable on the ground, usually by neutron monitors (see a recent review in Papaioannou 2023). Two primary mechanisms drive SEP events: solar flares and coronal mass ejections (CMEs; e.g., Klein & Dalla 2017). On the one hand, solar flares, which are intense bursts of radiation emanating from the release of magnetic energy in the Sun’s atmosphere, can accelerate particles through magnetic-reconnection processes (Aschwanden 2002). On the other hand, CMEs involve large expulsions of plasma and magnetic field from the Sun’s corona into interplanetary space (Howard et al. 2023). The interaction of these masses expelled from the Sun with the underlying ever-present solar wind creates shockwaves that can also accelerate particles to high energies as they propagate through the heliosphere via, for example, diffusive shock acceleration (DSA; Desai & Giacalone 2016). However, solar flares and CMEs do not evolve in isolation but rather in concert. In particular, solar flares as sudden, intense bursts of electromagnetic energy have a prominent soft-X-ray (SXR) emission. The intensity of the SXR emission often correlates with the flare’s strength. CMEs, which involve the ejection of massive amounts of solar plasma and magnetic fields into space, frequently accompany solar flares. While not all flares lead to CMEs, the most powerful flares are typically followed by significant CMEs (Yashiro et al. 2006). Both flares and CMEs are governed by the same magnetic processes in the solar atmosphere (Zhang et al. 2001; Temmer 2021). SXR emission is often an early indicator of the flare’s intensity and the likelihood of a CME (see Takahashi et al. 2016; Papaioannou et al. 2024, and references therein). Details of the SXR-CME relation can be found in Appendix A. As a result, most SEP events are associated with both of these drivers (see, e.g., Cane et al. 2010; Papaioannou et al. 2016).
Although modern GLE events (Nitta et al. 2012; Waterfall et al. 2023) are often referred to as extreme solar events, a handful of sudden, much more extreme increases have been identified in the cosmogenic radionuclide records of 14C, 10Be, and 36Cl (e.g., Miyake et al. 2012; Mekhaldi et al. 2015). Because of the intensity of these increases, several possible explanations, including gamma-ray bursts (Hambaryan & Neuhäuser 2013) and cometary impact (Liu et al. 2014), have been discussed in the literature. Nowadays, however, we know that these spike-like increases were caused by impacting solar energetic particles (Usoskin et al. 2013; Thomas et al. 2013; Cliver et al. 2014) that form the actual extreme solar particle events (ESPEs; see the detailed review by Usoskin et al. 2023). By nature, these extreme events have not been directly observed and measured. Consequently, their energy spectrum is at times represented by a scaled spectrum of the strongest ever observed hard-spectrum SEP event, GLE05, which occurred on 23 February, 1956 (see details in Papaioannou et al. 2023).
One of the first and – so far – strongest events discovered in the cosmogenic radionuclide records, the AD774/775 event, was identified in 2012 (Miyake et al. 2012) and immediately garnered a lot of attention, leading to new possibilities to investigate physical processes on the Sun (Usoskin & Kovaltsov 2021). Since then, four more ESPEs have been confirmed in all three cosmogenic radionuclide records (see details in Paleari et al. 2022; Koldobskiy et al. 2023): the 993/994 CE (Miyake et al. 2013), the 660 BCE (O’Hare et al. 2019), the 5259 BCE (O’Hare et al. 2019), and the 7176 BCE (Brehm et al. 2022)1 event. At present, these events constitute the high-energy and low-probability tail of the SEP distribution (see, e.g., Fig. 1). With a fluence of protons at E > 30 MeV (F30) estimated to be 1.5–2 orders of magnitude larger than the largest GLE on record (GLE05), the AD774/775 event is the largest SEP event described in detail so far. ESPEs are significantly larger than any SEP and/or GLE events detected since the 1950s (Koldobskiy et al. 2023), implying that such events pose an underestimated threat to our society. F30 can be determined from spacecraft data obtained between 1955 and 2023. In particular, a total of 392 SEP events reaching such an integral energy level have been listed to date (see details of this catalog in Papaioannou 2025). The histogram in Fig. 1 displays the distribution of the logarithm of the F30 values for all of these events. As can be seen, no event in the instrumental era (magenta bars) shows an F30 value that exceeds the estimated Carrington event value (1010 cm−2)2 (yellow star). The radionuclide-based F30 estimates are shown by the last bar (light blue), which represents the confirmed events discussed in Koldobskiy et al. (2023). The red horizontal line indicates the 5% chance of exceeding the value imprinted in red, indicating the tail of the distribution. It shows that only five times out of 100 may a log-fluence F30 larger than 8.85 (cm−2) occur at our Sun. On the other hand, this means that 95 times out of 100 the log fluence will be below this value. This is further corroborated by the dotted black line, providing the CDF of the log-fluence. It indicates that the probability (P(> F30)) of the log fluence being F30 ≤ 8.85 (cm−2) is 0.95 (right hand ordinate; see also the discussion in Papaioannou et al. 2022). The observational gap between instrumental and paleo SEPs (orange rectangle in Fig. 1) means we cannot conclude whether these two sets of observations result from the same underlying distribution and are therefore formed by the same physical processes.
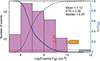 |
Fig. 1. Statistical distribution of F30 proton fluence obtained using a total of 392 SEP events recorded from 1955 to 2023 aboard spacecraft (magenta bars) and the ESPEs of the past (light blue bar). The dashed black line corresponds to the cumulative distribution function (CDF). The blue trace (right ordinate axis) corresponds to the empirical complementary CDF (CCDF) and gives the probability P(> F30) of having an SEP event with a log fluence above a certain value F (see, e.g., Ross 2014). The horizontal red line indicates the 5% chance of exceeding the value indicated in red. The plot imprints the mean, median, and standard deviation of the entire sample for the log-fluence values. The y-axis is displayed as a log scale so that the whole range of log-fluence values can be displayed without the small ESPE values being compressed. The star corresponds to the Carrington log-fluence value of 1010 cm−2 (Cliver & Dietrich 2013). The orange rectangle depicts the lack of log-fluence values from 1010 − 11 cm−2. |
Based on the existing 14C, 10Be, and 36Cl data, it can be hypothesized that no events larger than AD774/775 will be found in the radionuclide records from the last ten millennia (e.g., Miyake et al. 2019). However, most observed GLEs show “soft” spectra, with higher fluences of lower energy particles. Thus, previously unidentified extreme soft-spectrum events might hide in the cosmogenic radionuclide records (i.e., 36Cl).
2. From soft X-rays to worst-case-scenario particle fluences
Recently, Koldobskiy et al. (2023) presented new, calibrated, multiproxy reconstructions of the integral fluence spectrum of all known ESPEs. This work provided precise, numerically derived, ready-to-use values of the reconstructed ESPE fluences F(> E) (see their Table 3). At the same time, the tight connection between solar eruptive events and SEPs has been explored and discussed in numerous works (e.g,. Cane et al. 2010; Papaioannou et al. 2016; Desai & Giacalone 2016).
Most recently, a method that allows the inference of the “worst-case” fluence spectrum of an SEP event solely utilizing the magnitude of the associated solar flare in terms of soft X-rays (SXRs) has been proposed by Papaioannou et al. (2023). The worst-case fluence is derived from the upper limit estimation of each fluence value at each integral energy of interest, following the methodology detailed in Papaioannou et al. (2023). The latter is based on upper-limit scaling relations that convert the SXR flux to peak proton flux (IP(> E)) and fluence (FP(> E)) for a set of integral energies from E > 10 MeV to E > 100 MeV. In particular, these authors utilized a carefully selected sample of 65 SEP events that extended from > 10 to > 100 MeV and identified scaling laws of SEPs to SXRs for each integral energy (i.e., > 10, > 30, > 60, and > 100 MeV). In addition, they converted the peak proton fluxes to fluences for each of the integral energies. An inverse power-law fit is assumed to fit the resulting SEP fluences from > 10 to > 100 MeV. Once established, this is extended to higher integral energies (i.e., E > 200 MeV and E > 430 MeV). Papaioannou et al. (2023) found that FP(> E) scales with the SXR flux as  . Thus, the integral fluence spectrum can be estimated directly when the FSXR is known.
Table 3 of Koldobskiy et al. (2023) provides the integral fluences FP(> 30), FP(> 60), FP(> 100), FP(> 200), FP(> 300), FP(> 600), and FP(> 1000) for the ESPEs recorded around AD993/994, AD774/775, 660 BCE, and 7176 BCE. Thus, the combination of these integral fluences for each integral energy leads to a well-specified range of values per energy bin. In turn, these estimates can be used to construct the upper and lower limits of the integral fluence as a function of integral energy as deduced by measurements (proxies) alone.
In the case of the AD774/775 event, Cliver et al. (2022) identified the associated SXR flux as X400±200 (see also Papaioannou et al. 2023; Hudson et al. 2024). This SXR flux was identified as follows: Cliver et al. (2020, i.e., their Fig. 7) began with a reduced-major-axis (RMA) fit to a scatter plot of modeled > 200 MeV fluences taken from Raukunen et al. (2018) for hard-spectrum GLEs versus the peak intensities of their associated SXR flares. They then added two points for the 1956 GLE based on the estimated range of the peak SXR intensity (X10-X30) of its associated flare (as inferred from white-light and radio observations) and its > 200 MeV fluence (Usoskin et al. 2020). Through these points, they extrapolated lines parallel to the RMA fit to the modeled > 200 MeV fluence for the AD774 SEP event to obtain an estimate of X285±140 for the AD774 flare. Re-scaling the SXRs according to Hudson et al. (2024) shifts the SXR of AD774 from X285±140 to X400±200. It follows that the worst-case upper-limit SXR flux is X600. With the help of the method described in Papaioannou et al. (2023), therefore, we obtained the worst-case integral fluence spectra utilizing the X600 FSXR (solid orange line embedded in an envelope depicting the 1-σ error; parameters of the fit are available in Table 3 of Papaioannou et al. 2023). As shown in Fig. 2, the so-derived spectrum and the independently obtained range of integral fluence values from Koldobskiy et al. (2023) and Usoskin et al. (2021) can be directly compared. As can be seen, our AD 774/775 estimate aligns well with the fluence values derived by Usoskin et al. (2021) (blue symbols) and Koldobskiy et al. (2023) (black symbols). The underlying assumption of the aforementioned studies is that flares (denoted by their SXR measurements) drive SEPs. However, the lack of a universal correlation between spectral hardness and SXRs under a flare-only acceleration model (see, e.g., Trottet et al. 2015) suggests the need for an additional mechanism such as CME-driven shocks, thus supporting a dual-mechanism model (Papaioannou et al. 2016; Desai & Giacalone 2016). Considering the differences, the obtained alignment is promising. The spectral shape derived by Koldobskiy et al. (2023) is highlighted in purple. Given the fact that the AD774/775 event is the strongest ESPE event identified to date, it represents an upper-limit worst-case event, demonstrating what our host star, the Sun, is capable of producing (Papaioannou et al. 2023). The study of Koldobskiy et al. (2023) provides the scaled spectrum of the AD774/775 event with a 1-σ spread. This is incorporated in the direct comparison of Fig. 2. Although there is an apparent roll-over energy for ESPEs (here at E > 300 MeV), our simple inverse power-law representation (within the errors) gives a quite practical representation between E > 60 MeV and E > 1 GeV. Nonetheless, the spectral shape employed (i.e., inverse power-law) is restrictive for both the softening of the higher energies and the underestimation of the lower energies. As a result, while a realistic spectrum for SEPs is expected to be a double power or have an exponential rollover (see details in Appendix B), here we consider a single power-law approximation in the energy range of E > 10 MeV to E > 100 MeV, extrapolated to E > 1 GeV (see also the relevant discussion in Papaioannou et al. 2023). Nonetheless, in this work, it was made evident that the simple PL can provide a reasonable estimation of the fluence spectra from E > 60 MeV to E > 1 GeV, which in turn provides a quick and practical representation of the worst-case conditions. Figure 3 shows the range of the reconstructed ESPE integral fluence values per integral energy of AD993/994, AD774/775, 660 BCE, and 7176 BCE (gray shaded area, based on Koldobskiy et al. 2023). This was constructed using the four values (of the four events) for each integral energy and identifying the range of fluence values per integral energy (represented by the gray area in Fig. 3). Each vertical column led to a mean value per integral energy. The black dots represent these values. We note that the upper limit is formed by the 660 BCE event (E < 15 MeV) and the 7176 BCE event (E > 15 MeV), while the AD993/994 event forms the lower limit at all energy values. To derive an estimation of the mean of the range of integral fluences per integral energy, we utilized the band-fit function, which is a double power-law with an energy-dependent rollover (e.g., Band et al. 1993). Here, the omnidirectional event-integrated integral fluences J(> R) [cm−2] are given by
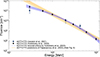 |
Fig. 2. Integral fluence spectra of AD774/775 event. Blue and black filled squares display the estimations based on the cosmogenic radionuclide data (Usoskin et al. 2021; Koldobskiy et al. 2023, respectively). While the magenta ribbon reflects the spectrum derived by Koldobskiy et al. (2023), the orange ribbon is obtained as a worst-case upper-limit integral-fluence spectrum based on an X600 solar flare by employing the method outlined in Papaioannou et al. (2023). |
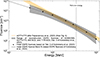 |
Fig. 3. Integral fluence spectra of AD774/775 event taking into account the reconstructed ESPE events around AD993/994, AD774/775, 660 BCE, and 1776 BCE. Here, the gray shade represents the spread of integral fluence values presented in Koldobskiy et al. (2023), while the filled circles show the integral energy-dependent mean of each fluence bin and the solid black line represents the corresponding band fit. The solid orange line and envelope are similar to those of Fig. 2. |
where J0 represents the fluence normalization coefficient and γ1 and γ2 represent the low and high-rigidity power-law indices (e.g., Raukunen et al. 2018), respectively. Accordingly, the event-integrated differential spectrum (in units of [1/(cm2 sr GeV)]) can be derived by
Here, A = [(γ2−γ1)R0]γ2 − γ1exp(γ1 − γ2) and E0 is the rest mass energy of a proton (0.938 GeV). The following parameters have been found to fit the values best (i.e., the black dots in Fig. 3): J0 = 8.5⋅1013 ± 1 ⋅ 1011 cm−2, γ1 = 0.65±0.02, γ2 = 7.0±0.05, and R0 = 0.35 ± 0.01 GV. The corresponding rollover energy is displayed as the black dashed line.
To test whether the worst-case integral fluence spectra inferred from FSXR can further be applied to modern events, we turn to the strongest SEP events that have been recorded on Earth as GLEs above the ever-present background of Galactic cosmic rays (see a recent review on the subject in Papaioannou 2023, and references therein). Therefore, the published integral fluence spectra of the GLEs between 1956 and 2017 (i.e., covering GLE55 – GLE713) by Koldobskiy et al. (2021) were used (see Table 1 for more details).
Further, we utilized the newly re-calibrated FSXR values for the saturated GOES events (Hudson et al. 2024) and scaled the rest by utilizing a multiplicative factor of 1/0.7 (see also Papaioannou et al. 2023). Table 1 provides all information on the GLEs employed and gives their initial FSXR and the newly re-calibrated values (FSXRrec). Thereby, the lowest FSXRrec value used in our estimations is 7.2 ⋅ 10−5 W/m2 (M7.2), which is associated with GLE71 on 17 May, 2012 (Richardson et al. 2014), while the highest FSXRrec used is 2.57 ⋅ 10−3 W/m2 (X25.7) and is associated with GLE65. Based on these FSXRrec values, a band of the worst-case integral fluence spectra is reconstructed.
The results are shown in Fig. 4 presenting the integral fluence spectra obtained for each GLE (Koldobskiy et al. 2021) combined with the range of the worst-case integral fluence spectra obtained from the method outlined in Papaioannou et al. (2023, orange band). Again, our worst-case integral fluence spectrum agrees well with the those of the GLEs between 1956 and 2017. This suggests that the method outlined in Papaioannou et al. (2023) can reliably estimate the worst-case integral fluence spectra up to ∼E > 1 GeV – taking into account the limitations of the spectral form discussed here and in Appendix B.
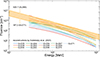 |
Fig. 4. Integral fluence spectrum for GLEs from 1956-2017. Each line is a band fit (see Eq. (2)) to the values presented in Table 1. The orange range depicts the worst-case estimated integral fluence spectrum for the lower and highest re-calibrated FSXR values of the associated solar flares for GLE71 (lower) and GLE65 (higher). We note that the results are represented by their obtained PL fit, per case, excluding the according error estimates. |
3. Conclusions
The extremes of solar energetic particles were revealed only a decade ago (Miyake et al. 2012) and brought a rapid change in the field since they brought many more questions than answers (see the detailed discussion in Usoskin et al. 2023). Assuming that our host star, the Sun, drives such events and that those represent a high-energy and low-probability tail of the regular SEP distribution (Usoskin & Kovaltsov 2021), it is desirable to be able to estimate their resulting worst-case integral fluence spectra to more reliably estimate the direct technological and societal consequences of such events.
We employed the methodology detailed in Papaioannou et al. (2023) and showed that it is possible to accurately estimate the integral fluence spectra of one of the strongest extreme SEP events ever observed (i.e., AD774/775, Fig. 2). The concept was further tested against a mean ESPE obtained based on four extreme SEP events found in cosmogenic radionuclide records (i.e., AD993/994, AD774/775, 660 BCE, and 7176BCE; Koldobskiy et al. 2023, see Fig. 3). It was additionally tested on a series of strong measured SEP events recorded at the surface of the Earth, i.e., GLEs (Fig. 4). Our derived worst-case integral influences seem to hold true for all cases, providing a robust upper-limit estimation for all (extreme) solar events.
AD774/775 is the only ESPE event for which a solar association, in terms of SXRs, has been possible (Cliver et al. 2022). In addition, the comparison in Fig. 4 between the mean ESPE spectrum (black line) and the derived spectrum from AD774/775 (orange line) is suggestive of the magnitude of flares that lead to ESPEs, which should be in the range of a few X100, and that the concept presented here could provide an estimate of the spectrum for ESPEs if the triggering SXR flux is known.
Our method assumes a direct scaling relation between SXR flux FSXR and the obtained integral fluence F(> E) (see details in Papaioannou et al. 2023). In this work, we utilized the scaled FSXR flux for the first time (see details in Hudson et al. 2024). Our method does not underpin the physical processes involved in the acceleration and propagation of such extreme SEP events. Instead, it directly estimates and quantifies the effects of these changes. The verification of the concept provides valuable insight: even if we do not yet know how these extreme events are unleashed by the Sun and if these are “black swans” (produced by already known physical processes) or “red dragons” (produced by completely unknown processes; see, e.g., Cliver et al. 2022; Usoskin et al. 2023), we do know that such events will strike again, rendering our interconnected and technologically dependent society completely vulnerable.
With upcoming missions such as PLATO (Rauer et al. 2014, 2024), searching for terrestrial planets around, for example, G-type and Sun-like stars, it is essential to constrain the stellar particle- and radiation environments to be expected within the habitable zone of such systems (e.g., Engelbrecht et al. 2024; Herbst et al. 2024). Caution is needed when a scaling relation is established for a particular system and used for another. Uncertainty arises from differences in the stellar conditions compared to our Sun (e.g., temperature, density, magnetic field) and the stellar/solar wind properties that affect particle acceleration and propagation dynamics. Furthermore, the level of activity of a star versus our Sun, in terms of flare and CME occurrence, directly affects the SXR-SEP relations (see also the discussion in Papaioannou et al. 2023). Assuming the Sun to be an ordinary G-type star, our method also provides a first-order approximation of the worst-case integral stellar energetic particle fluence of an active solar twin at the exoplanetary locations, in turn paving the way for sophisticated studies of the impact cosmic rays have on exoplanetary atmospheres (i.e., climate and chemistry), transmission spectra, and biosignatures such as methane and ozone (e.g. Herbst et al. 2019; Chen et al. 2021; Herbst et al. 2024).
We note that the atmospheric 14C increases of the 7176 BCE event are comparable to the ones of the AD774/775 event (see Tab.1 in Brehm et al. 2022).
For example, https://gle.oulu.fi/
Acknowledgments
KH and AP acknowledge the International Space Science Institute and the supported International Team 441: High EneRgy sOlar partICle Events Analysis (HEROIC) and Team 464: The Role Of Solar And Stellar Energetic Particles On (Exo)Planetary Habitability (ETERNAL). KH further acknowledges the support of the DFG priority program SPP 1992 “Exploring the Diversity of Extrasolar Planets (HE 8392/1-1)”. AP acknowledges NASA/LWS project NNH19ZDA001N-LWS. This project has received funding from the Research Council of Norway through the Centres of Excellence funding scheme, project number 332523 (PHAB). Part of this work has received funding from the European Union’s Horizon Europe programme under grant agreement No 101135044 (SPEARHEAD). The research was partly funded by the European Union (ERC, PastSolarStorms, grant agreement n° 101142677). Views and opinions expressed are however those of the author(s) only and do not necessarily reflect those of the European Union or the European Research Council. Neither the European Union nor the granting authority can be held responsible for them.
References
- Aschwanden, M. J. 2002, Space Sci. Rev., 101, 1 [Google Scholar]
- Band, D., Matteson, J., Ford, L., et al. 1993, ApJ, 413, 281 [Google Scholar]
- Brehm, N., Christl, M., Knowles, T. D. J., et al. 2022, Nat. Commun., 13, 1196 [NASA ADS] [CrossRef] [Google Scholar]
- Cane, H. V., Richardson, I. G., & von Rosenvinge, T. T. 2010, J. Geophys. Res. (Space Phys.), 115, A08101 [Google Scholar]
- Chen, H., Zhan, Z., Youngblood, A., et al. 2021, Nat. Astron., 5, 298 [Google Scholar]
- Cliver, E. W., & Dietrich, W. F. 2013, J. Space Weather Space Clim., 3, A31 [NASA ADS] [CrossRef] [EDP Sciences] [Google Scholar]
- Cliver, E. W., Tylka, A. J., Dietrich, W. F., & Ling, A. G. 2014, ApJ, 781, 32 [Google Scholar]
- Cliver, E. W., Hayakawa, H., Love, J. J., & Neidig, D. F. 2020, ApJ, 903, 41 [Google Scholar]
- Cliver, E. W., Schrijver, C. J., Shibata, K., & Usoskin, I. G. 2022, Liv. Rev. Sol. Phys., 19, 2 [NASA ADS] [CrossRef] [Google Scholar]
- Desai, M., & Giacalone, J. 2016, Liv. Rev. Sol. Phys., 13, 1 [CrossRef] [Google Scholar]
- Dröge, W. 2000, ApJ, 537, 1073 [CrossRef] [Google Scholar]
- Ellison, D. C., & Ramaty, R. 1985, ApJ, 298, 400 [Google Scholar]
- Engelbrecht, N. E., Herbst, K., Strauss, R. D. T., et al. 2024, ApJ, 964, 89 [NASA ADS] [CrossRef] [Google Scholar]
- Gopalswamy, N. 2018, in Extreme Events in Geospace. Origins, Predictability, and Consequences, ed. N. Buzulukova, 37 [Google Scholar]
- Hambaryan, V. V., & Neuhäuser, R. 2013, MNRAS, 430, 32 [Google Scholar]
- Herbst, K., Grenfell, J. L., Sinnhuber, M., et al. 2019, A&A, 631, A101 [NASA ADS] [CrossRef] [EDP Sciences] [Google Scholar]
- Herbst, K., Bartenschlager, A., Grenfell, J. L., et al. 2024, ApJ, 961, 164 [NASA ADS] [CrossRef] [Google Scholar]
- Howard, R. A., Vourlidas, A., & Stenborg, G. 2023, Front. Astron. Space Sci., 10, 1264226 [NASA ADS] [CrossRef] [Google Scholar]
- Hudson, H., Cliver, E., White, S., et al. 2024, Sol. Phys., 299, 39 [NASA ADS] [CrossRef] [Google Scholar]
- Kiselev, V. I., Meshalkina, N. S., & Grechnev, V. V. 2022, Sol. Phys., 297, 53 [NASA ADS] [CrossRef] [Google Scholar]
- Klein, K.-L., & Dalla, S. 2017, Space Sci. Rev., 212, 1107 [Google Scholar]
- Klein, K.-L., & Trottet, G. 2001, Space Sci. Rev., 95, 215 [NASA ADS] [CrossRef] [Google Scholar]
- Koldobskiy, S., Raukunen, O., Vainio, R., Kovaltsov, G. A., & Usoskin, I. 2021, A&A, 647, A132 [CrossRef] [EDP Sciences] [Google Scholar]
- Koldobskiy, S., Mekhaldi, F., Kovaltsov, G., & Usoskin, I. 2023, J. Geophys. Res. (Space Phys.), 128, e2022JA031186 [NASA ADS] [CrossRef] [Google Scholar]
- Kouloumvakos, A., Papaioannou, A., Waterfall, C. O. G., et al. 2024, A&A, 682, A106 [NASA ADS] [CrossRef] [EDP Sciences] [Google Scholar]
- Liu, Y., Zhang, Z.-F., Peng, Z.-C., et al. 2014, Sci. Rep., 4, 3728 [NASA ADS] [Google Scholar]
- Masson, S., Antiochos, S. K., & DeVore, C. R. 2013, ApJ, 771, 82 [NASA ADS] [CrossRef] [Google Scholar]
- Mekhaldi, F., Muscheler, R., Adolphi, F., et al. 2015, Nat. Commun., 6, 1 [CrossRef] [Google Scholar]
- Mewaldt, R. A., Looper, M. D., Cohen, C. M. S., et al. 2012, Space Sci. Rev., 171, 97 [Google Scholar]
- Mishev, A., & Poluianov, S. 2021, Sol. Phys., 296, 129 [NASA ADS] [CrossRef] [Google Scholar]
- Miyake, F., Nagaya, K., Masuda, K., & Nakamura, T. 2012, Nature, 486, 240 [NASA ADS] [CrossRef] [Google Scholar]
- Miyake, F., Masuda, K., & Nakamura, T. 2013, Nat. Commun., 4, 1748 [Google Scholar]
- Miyake, F., Usoskin, I., & Poluianov, S. eds. 2019, Extreme Solar Particle Storms (IOP Publishing), 2514 [Google Scholar]
- Mohan, A., Gopalswamy, N., Raju, H., & Akiyama, S. 2024, A&A, 691, L8 [NASA ADS] [CrossRef] [EDP Sciences] [Google Scholar]
- Nitta, N. V., Liu, Y., DeRosa, M. L., & Nightingale, R. W. 2012, Space Sci. Rev., 171, 61 [NASA ADS] [CrossRef] [Google Scholar]
- O’Hare, P., Mekhaldi, F., Adolphi, F., et al. 2019, Proc. Nat. Acad. Sci., 116, 5961 [Google Scholar]
- Paleari, C. I., Mekhaldi, F., Adolphi, F., et al. 2022, Nat. Commun., 13, 214 [NASA ADS] [CrossRef] [Google Scholar]
- Papaioannou, A. 2023, NMDB@Athens: Proceedings of the Hybrid Symposium on Cosmic Ray Studies with Neutron Detectors, September 26-30, 2022, 2, 113 [Google Scholar]
- Papaioannou, A. 2025, https://zenodo.org/records/15083732 [Google Scholar]
- Papaioannou, A., Sandberg, I., Anastasiadis, A., et al. 2016, J. Space Weather Space Clim., 6, A42 [NASA ADS] [CrossRef] [EDP Sciences] [Google Scholar]
- Papaioannou, A., Vainio, R., Raukunen, O., et al. 2022, J. Space Weather Space Clim., 12, 24 [Google Scholar]
- Papaioannou, A., Herbst, K., Ramm, T., et al. 2023, A&A, 671, A66 [NASA ADS] [CrossRef] [EDP Sciences] [Google Scholar]
- Papaioannou, A., Herbst, K., Ramm, T., Lario, D., & Veronig, A. M. 2024, A&A, 690, A60 [NASA ADS] [CrossRef] [EDP Sciences] [Google Scholar]
- Patsourakos, S., Vourlidas, A., Török, T., et al. 2020, Space Sci. Rev., 216, 131 [Google Scholar]
- Petrosian, V. 2012, Space Sci. Rev., 173, 535 [NASA ADS] [CrossRef] [Google Scholar]
- Rauer, H., Catala, C., Aerts, C., et al. 2014, Exp. Astron., 38, 249 [Google Scholar]
- Rauer, H., Aerts, C., Cabrera, J., et al. 2024, arXiv e-prints [arXiv:2406.05447] [Google Scholar]
- Raukunen, O., Vainio, R., Tylka, A. J., et al. 2018, J. Space Weather Space Clim., 8, A04 [NASA ADS] [CrossRef] [EDP Sciences] [Google Scholar]
- Reames, D. V. 1999, Space Sci. Rev., 90, 413 [NASA ADS] [CrossRef] [Google Scholar]
- Reames, D. V. 2023, Front. Astron. Space Sci., 10, 1254266 [Google Scholar]
- Richardson, I. G., von Rosenvinge, T. T., Cane, H. V., et al. 2014, Sol. Phys., 289, 3059 [NASA ADS] [CrossRef] [Google Scholar]
- Ross, S. M. 2014, in Introduction to Probability and Statistics for Engineers and Scientists (Fifth Edition), 5th edn. (Boston: Academic Press) [Google Scholar]
- Salas-Matamoros, C., & Klein, K. L. 2015, Sol. Phys., 290, 1337 [NASA ADS] [CrossRef] [Google Scholar]
- Takahashi, T., Mizuno, Y., & Shibata, K. 2016, ApJ, 833, L8 [NASA ADS] [CrossRef] [Google Scholar]
- Temmer, M. 2021, Liv. Rev. Sol. Phys., 18, 4 [NASA ADS] [CrossRef] [Google Scholar]
- Thomas, B. C., Melott, A. L., Arkenberg, K. R., & Snyder, B. R., II 2013, Geophys. Res. Lett., 40, 1237 [Google Scholar]
- Trottet, G., Samwel, S., Klein, K. L., Dudok de Wit, T., & Miteva, R. 2015, Sol. Phys., 290, 819 [Google Scholar]
- Usoskin, I. G., & Kovaltsov, G. A. 2021, Geophys. Res. Lett., 48, e94848 [NASA ADS] [CrossRef] [Google Scholar]
- Usoskin, I., Kromer, B., Ludlow, F., et al. 2013, A&A, 552, L3 [NASA ADS] [CrossRef] [EDP Sciences] [Google Scholar]
- Usoskin, I., Koldobskiy, S., Kovaltsov, G., et al. 2020, A&A, 640, A17 [CrossRef] [EDP Sciences] [Google Scholar]
- Usoskin, I., Koldobskiy, S., Kovaltsov, G., et al. 2021, in Proceedings of 37th International Cosmic Ray Conference - PoS(ICRC2021), 395, 1319 [Google Scholar]
- Usoskin, I., Miyake, F., Baroni, M., et al. 2023, Space Sci. Rev., 219, 73 [Google Scholar]
- Waterfall, C. O. G., Dalla, S., Raukunen, O., et al. 2023, Space Weather, 21, e2022SW003334 [Google Scholar]
- Yashiro, S., Akiyama, S., Gopalswamy, N., & Howard, R. A. 2006, ApJ, 650, L143 [NASA ADS] [CrossRef] [Google Scholar]
- Zhang, J., Dere, K. P., Howard, R. A., Kundu, M. R., & White, S. M. 2001, ApJ, 559, 452 [Google Scholar]
Appendix A: Soft X-ray and CME relations
Observations and theoretical studies have established a significant relationship between coronal mass ejections (CMEs) and the thermal energy release traced by associated solar flare soft X-ray (SXR) emissions (Patsourakos et al. 2020). Statistical analyses indicate that most CMEs exhibit some level of X-ray emission (Yashiro et al. 2006). However, solar flares occur more frequently than CMEs, suggesting a lack of one-to-one correspondence. Nonetheless, the likelihood of a CME being associated with a flare increases with flare intensity in terms of SXR flux (see Fig. 1 of Yashiro et al. 2006).
A moderate correlation has been identified between CME speeds and the peak SXR flux of associated flares (Salas-Matamoros & Klein 2015; Takahashi et al. 2016; Papaioannou et al. 2024). This correlation arises because solar eruptive events – flares and CMEs – are interconnected, both resulting from magnetic field restructuring in the corona. However, significant scatter in the data (see e.g., Fig. 3 in Papaioannou et al. 2024) suggests that while SXR emissions relate to CME kinematics, additional factors influence CME dynamics.
Several studies have explored scaling relations between CME properties and SXRs. For instance, Takahashi et al. (2016) found that CME speed (VCME) scales with the SXR photon flux (FSXR) as  , implying that more intense flares are generally associated with faster CMEs. Expanding on this, upper-limit scaling relations for CME speeds have been derived based on SXR emissions (Papaioannou et al. 2024) and active region (AR) energy (see e.g., Gopalswamy 2018). More recently, Mohan et al. (2024) applied the concept of scaling laws to investigate analogous correlations, extending the concept of these relations to stellar flares and CMEs.
While these scaling laws provide valuable insights into CME-SXR connections, significant variability remains. Factors such as the surrounding magnetic environment, CME geometry, and projection effects contribute to the observed scatter. Thus, although SXR measurements serve as crucial indicators of CME dynamics, they represent only one aspect of a complex interplay of solar eruptive processes (see the relevant discussion in Papaioannou et al. 2024).
Appendix B: Spectral shape
Flares and CMEs are widely recognized to almost always coincide during strong SEP events, which typically obscures the primary acceleration mechanisms (see Kiselev et al. 2022, and references therein). Thus, double power-law spectra in SEPs are expected. Such spectra are frequently observed, spanning from the lowest proton energies up to several hundred MeV (e.g. Mewaldt et al. 2012). They are commonly attributed to: (a) the presence of two distinct accelerators–such as CME-driven shocks and flare-related processes. In particular, the assumption is that CME-driven shocks are the dominant acceleration mechanism at lower energies (see, e.g. Desai & Giacalone 2016) and flare-associated processes, such as magnetic reconnection, dominate at higher energies (Klein & Trottet 2001). As a result, below the break energy, the spectrum exhibits a flatter slope (shock acceleration), while above it, the slope becomes steeper (flare-related acceleration); and (b) low-energy particles are more susceptible to scattering and energy losses due to interactions with the solar wind and interplanetary medium, including Coulomb collisions and adiabatic deceleration, which further modify their spectrum (Dröge 2000) while high-energy particles, being less influenced by these processes, tend to retain spectral features closer to their source (Reames 1999). Nonetheless, it is also possible for a single accelerator to produce such spectra under specific conditions: (i) CME-driven shocks can produce a double power-law spectrum if the acceleration efficiency varies across different energy ranges. For instance, the presence of stronger turbulence at higher energies or a limited supply of low-energy seed particles can naturally lead to a change in the spectral slope (Ellison & Ramaty 1985; ii) shock geometry and evolution can also affect particle acceleration. As the shock expands and weakens, it may favor acceleration at certain energy ranges over others, leading to a break in the spectrum (Kouloumvakos et al. 2024; iii) even if the initial spectrum from a single accelerator is a pure power-law, transport effects such as scattering, energy loss, and escape from the shock region can create a double power-law signature. For example, Coulomb collisions can deplete low-energy particles, while interplanetary propagation can modify high-energy particle distributions (Dröge 2000; iv) a single mechanism, such as stochastic acceleration (second-order Fermi processes), can inherently produce a spectrum with a break if the energy gain per interaction or the rate of particle injection into the process changes with energy (Petrosian 2012) and (v) flare-accelerated electrons and protons are injected both downward into flare loops and upward into a forming flux rope. These particles remain trapped until the expanding flux rope reconnects with an open coronal structure, releasing them into interplanetary space. Within the dense flux rope, Coulomb collisions reduce the low-energy portion of the proton spectrum. Meanwhile, the CME-driven shock independently accelerates a population of suprathermal particles present in the corona and interplanetary medium, gradually increasing their energy spectrum and replenishing the lower-energy component. Together, these processes result in a double power-law proton spectrum, characterized by a flatter slope below the break energy and a steeper slope above it (Masson et al. 2013). Thus, the spectra of low-energy and high-energy particles in SEPs are typically not aligned, reflecting their origins from possibly different acceleration processes and the subsequent propagation effects.
All Tables
All Figures
|
Fig. 1. Statistical distribution of F30 proton fluence obtained using a total of 392 SEP events recorded from 1955 to 2023 aboard spacecraft (magenta bars) and the ESPEs of the past (light blue bar). The dashed black line corresponds to the cumulative distribution function (CDF). The blue trace (right ordinate axis) corresponds to the empirical complementary CDF (CCDF) and gives the probability P(> F30) of having an SEP event with a log fluence above a certain value F (see, e.g., Ross 2014). The horizontal red line indicates the 5% chance of exceeding the value indicated in red. The plot imprints the mean, median, and standard deviation of the entire sample for the log-fluence values. The y-axis is displayed as a log scale so that the whole range of log-fluence values can be displayed without the small ESPE values being compressed. The star corresponds to the Carrington log-fluence value of 1010 cm−2 (Cliver & Dietrich 2013). The orange rectangle depicts the lack of log-fluence values from 1010 − 11 cm−2. |
| In the text | |
|
Fig. 2. Integral fluence spectra of AD774/775 event. Blue and black filled squares display the estimations based on the cosmogenic radionuclide data (Usoskin et al. 2021; Koldobskiy et al. 2023, respectively). While the magenta ribbon reflects the spectrum derived by Koldobskiy et al. (2023), the orange ribbon is obtained as a worst-case upper-limit integral-fluence spectrum based on an X600 solar flare by employing the method outlined in Papaioannou et al. (2023). |
| In the text | |
|
Fig. 3. Integral fluence spectra of AD774/775 event taking into account the reconstructed ESPE events around AD993/994, AD774/775, 660 BCE, and 1776 BCE. Here, the gray shade represents the spread of integral fluence values presented in Koldobskiy et al. (2023), while the filled circles show the integral energy-dependent mean of each fluence bin and the solid black line represents the corresponding band fit. The solid orange line and envelope are similar to those of Fig. 2. |
| In the text | |
|
Fig. 4. Integral fluence spectrum for GLEs from 1956-2017. Each line is a band fit (see Eq. (2)) to the values presented in Table 1. The orange range depicts the worst-case estimated integral fluence spectrum for the lower and highest re-calibrated FSXR values of the associated solar flares for GLE71 (lower) and GLE65 (higher). We note that the results are represented by their obtained PL fit, per case, excluding the according error estimates. |
| In the text | |
Current usage metrics show cumulative count of Article Views (full-text article views including HTML views, PDF and ePub downloads, according to the available data) and Abstracts Views on Vision4Press platform.
Data correspond to usage on the plateform after 2015. The current usage metrics is available 48-96 hours after online publication and is updated daily on week days.
Initial download of the metrics may take a while.