Fig. 4.
Download original image
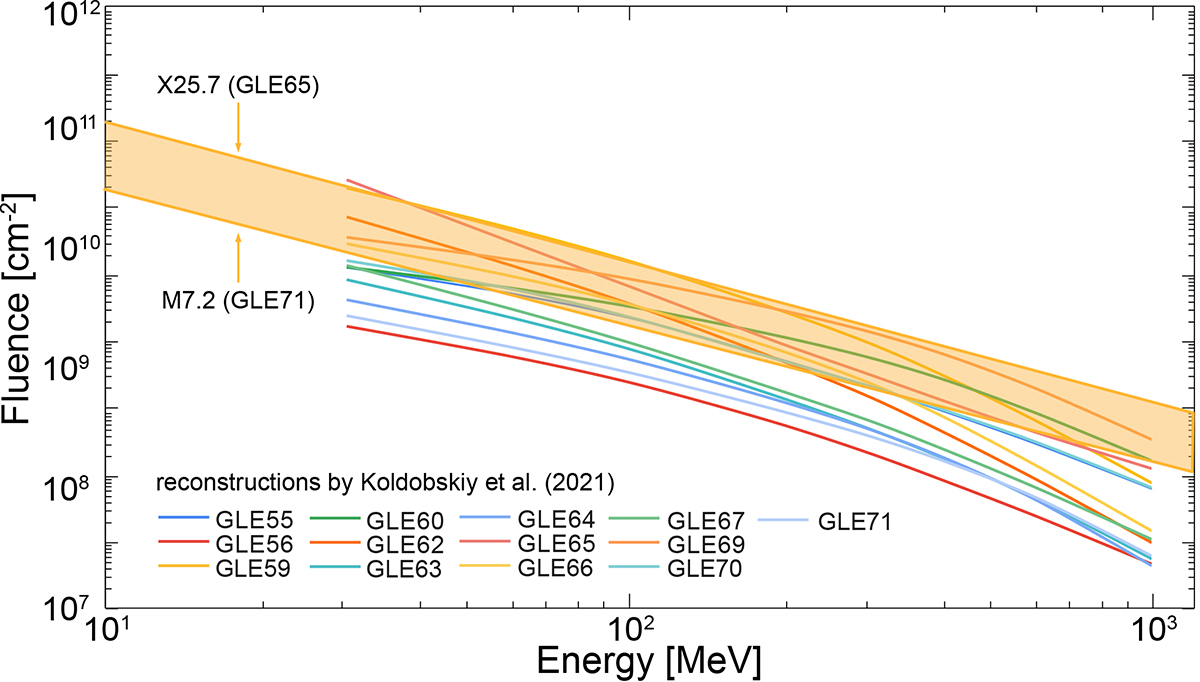
Integral fluence spectrum for GLEs from 1956-2017. Each line is a band fit (see Eq. (2)) to the values presented in Table 1. The orange range depicts the worst-case estimated integral fluence spectrum for the lower and highest re-calibrated FSXR values of the associated solar flares for GLE71 (lower) and GLE65 (higher). We note that the results are represented by their obtained PL fit, per case, excluding the according error estimates.
Current usage metrics show cumulative count of Article Views (full-text article views including HTML views, PDF and ePub downloads, according to the available data) and Abstracts Views on Vision4Press platform.
Data correspond to usage on the plateform after 2015. The current usage metrics is available 48-96 hours after online publication and is updated daily on week days.
Initial download of the metrics may take a while.