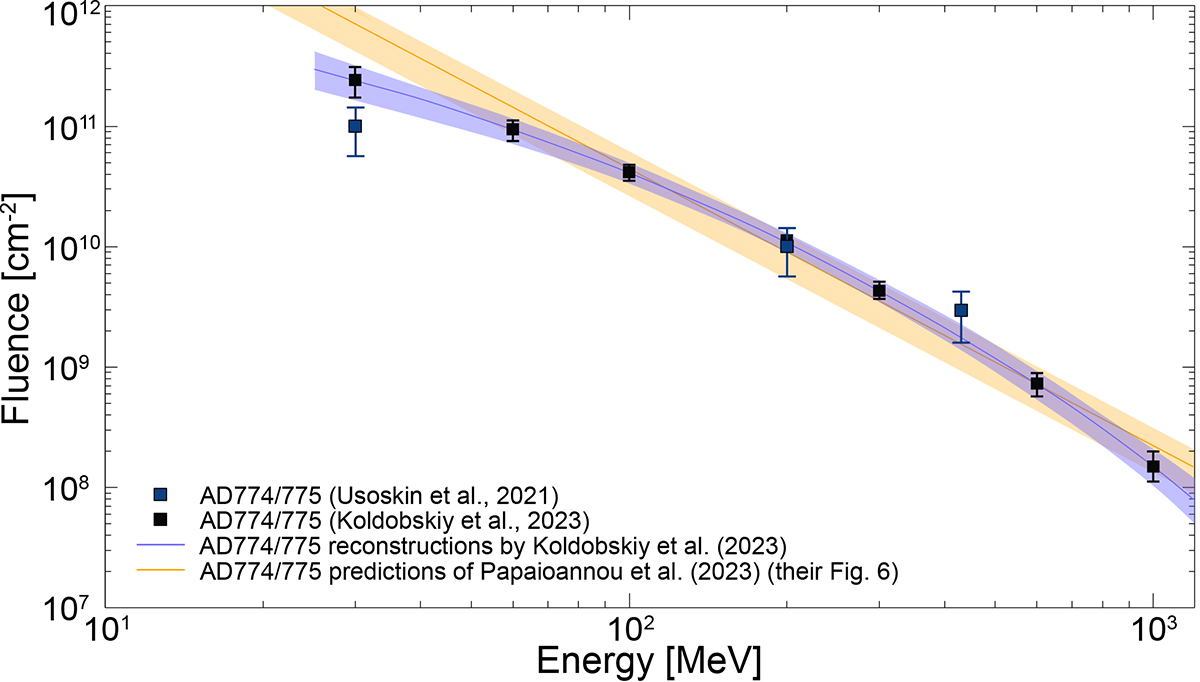
Fig. 2.
Download original image
Integral fluence spectra of AD774/775 event. Blue and black filled squares display the estimations based on the cosmogenic radionuclide data (Usoskin et al. 2021; Koldobskiy et al. 2023, respectively). While the magenta ribbon reflects the spectrum derived by Koldobskiy et al. (2023), the orange ribbon is obtained as a worst-case upper-limit integral-fluence spectrum based on an X600 solar flare by employing the method outlined in Papaioannou et al. (2023).
Current usage metrics show cumulative count of Article Views (full-text article views including HTML views, PDF and ePub downloads, according to the available data) and Abstracts Views on Vision4Press platform.
Data correspond to usage on the plateform after 2015. The current usage metrics is available 48-96 hours after online publication and is updated daily on week days.
Initial download of the metrics may take a while.