Fig. 3.
Download original image
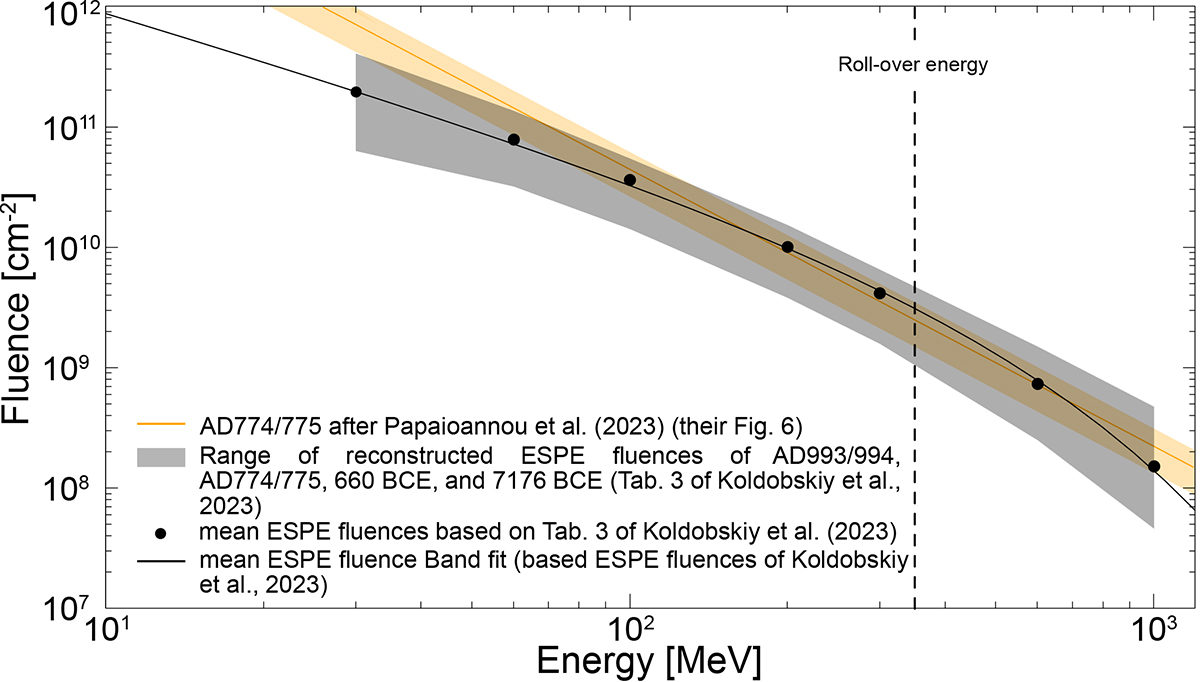
Integral fluence spectra of AD774/775 event taking into account the reconstructed ESPE events around AD993/994, AD774/775, 660 BCE, and 1776 BCE. Here, the gray shade represents the spread of integral fluence values presented in Koldobskiy et al. (2023), while the filled circles show the integral energy-dependent mean of each fluence bin and the solid black line represents the corresponding band fit. The solid orange line and envelope are similar to those of Fig. 2.
Current usage metrics show cumulative count of Article Views (full-text article views including HTML views, PDF and ePub downloads, according to the available data) and Abstracts Views on Vision4Press platform.
Data correspond to usage on the plateform after 2015. The current usage metrics is available 48-96 hours after online publication and is updated daily on week days.
Initial download of the metrics may take a while.