Fig. 1.
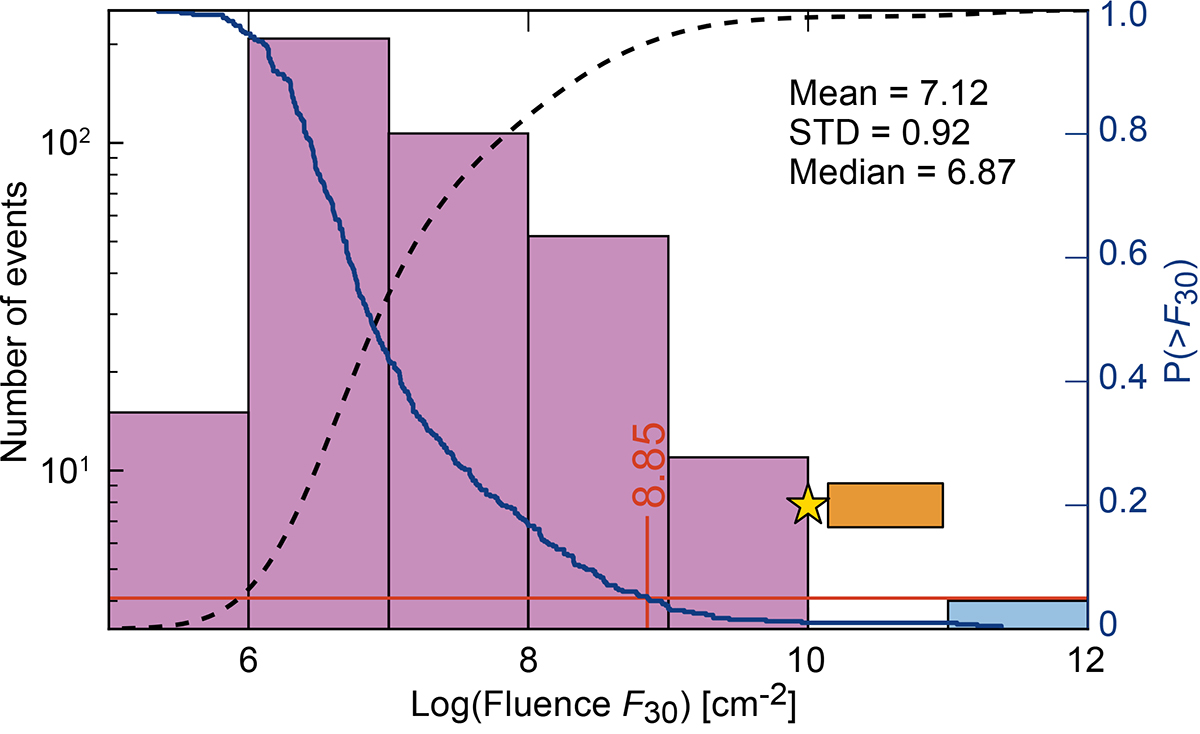
Download original image
Statistical distribution of F30 proton fluence obtained using a total of 392 SEP events recorded from 1955 to 2023 aboard spacecraft (magenta bars) and the ESPEs of the past (light blue bar). The dashed black line corresponds to the cumulative distribution function (CDF). The blue trace (right ordinate axis) corresponds to the empirical complementary CDF (CCDF) and gives the probability P(> F30) of having an SEP event with a log fluence above a certain value F (see, e.g., Ross 2014). The horizontal red line indicates the 5% chance of exceeding the value indicated in red. The plot imprints the mean, median, and standard deviation of the entire sample for the log-fluence values. The y-axis is displayed as a log scale so that the whole range of log-fluence values can be displayed without the small ESPE values being compressed. The star corresponds to the Carrington log-fluence value of 1010 cm−2 (Cliver & Dietrich 2013). The orange rectangle depicts the lack of log-fluence values from 1010 − 11 cm−2.
Current usage metrics show cumulative count of Article Views (full-text article views including HTML views, PDF and ePub downloads, according to the available data) and Abstracts Views on Vision4Press platform.
Data correspond to usage on the plateform after 2015. The current usage metrics is available 48-96 hours after online publication and is updated daily on week days.
Initial download of the metrics may take a while.