| Issue |
A&A
Volume 693, January 2025
|
|
|---|---|---|
| Article Number | A70 | |
| Number of page(s) | 13 | |
| Section | Extragalactic astronomy | |
| DOI | https://doi.org/10.1051/0004-6361/202451551 | |
| Published online | 03 January 2025 | |
A hidden active galactic nucleus powering bright [O III] nebulae in a protocluster at z = 4.5 revealed by JWST
1
Instituto de Estudios Astrofísicos, Facultad de Ingeniería y Ciencias, Universidad Diego Portales, Av. Ejército Libertador 441, 8370191 Santiago, Chile
2
Instituto de Astrofísica, Facultad de Física, Pontificia Universidad Católica de Chile, Santiago 7820436 Chile
3
Las Campanas Observatory, Carnegie Institution of Washington, Raúl Bitrán, 1200 La Serena, Chile
4
Université de Strasbourg, CNRS, Observatoire astronomique de Strasbourg, UMR 7550, 67000 Strasbourg, France
5
Aix Marseille Univ, CNRS, CNES, LAM, Marseille, France
6
Université Côte d’Azur, Observatoire de la Côte d’Azur, CNRS, Laboratoire Lagrange, 06000 Nice, France
7
Departamento de Astronomía, Facultad Ciencias Físicas y Matemáticas, Universidad de Concepción, Av. Esteban Iturra s/n Barrio Universitario, Casilla 160, Concepción, Chile
8
Chemistry Department, Sapienza University of Rome, P.le A. Moro, 00185 Rome, Italy
9
INAF, Osservatorio Astrofisico di Arcetri, Largo E. Fermi 5, I-50125 Firenze, Italy
10
The University of Texas at Austin, 2515 Speedway Blvd Stop C1400, Austin, TX 78712 USA
11
Cosmic Dawn Center (DAWN), Rådmandsgade 64, 2200 København N, Denmark
12
Dipartimento di Fisica e Astronomia, Università di Padova, Vicolo dell’Osservatorio, 3, 35122 Padova, Italy
13
INAF Osservatorio Astronomico di Padova, vicolo dell’Osservatorio 5, 35122 Padova, Italy
14
International Centre for Radio Astronomy Research (ICRAR), The University of Western Australia, M468, 35 Stirling Highway, Crawley, WA 6009 Australia
15
Centre for Astrophysics and Supercomputing, Swinburne Univ. of Technology, PO Box 218 Hawthorn, VIC 3122 Australia
16
ARC Centre of Excellence for All Sky Astrophysics in 3 Dimensions (ASTRO 3D), Australia
17
Sterrenkundig Observatorium, Ghent University, Krijgslaan 281-S9, B-9000 Ghent, Belgium
18
Department of Physics & Astronomy, University College London, Gower Street, London WC1E 6BT UK
19
Kavli Institute for the Physics and Mathematics of the Universe, The University of Tokyo, Kashiwa, 277-8583 (Kavli IPMU WPI) Japan
20
Institute of Astrophysics, Foundation for Research and Technology-Hellas (FORTH), Heraklion 70013 Greece
21
Chinese Academy of Sciences South America Center for Astronomy (CASSACA), National Astronomical Observatories, CAS, Beijing 100101 PR China
22
Caltech/IPAC, MS 314-6, 1200 E. California Blvd. Pasadena, CA 91125 USA
23
Scuola Normale Superiore, Piazza dei Cavalieri 7, I-50126 Pisa, Italy
24
Dipartimento di Fisica e Astronomia, Università di Firenze, via G. Sansone 1, 50019 Sesto Fiorentino, Firenze, Italy
25
INAF – Osservatorio di Astrofisica e Scienza dello Spazio di Bologna, via Gobetti 93/3, 40129 Bologna, Italy
26
Universidad Andrés Bello, Facultad de Ciencias Exactas, Departamento de Física, Instituto de Astrofísica, Fernandez Concha 700, Las Condes, Santiago, RM, Chile
27
Space Telescope Science Institute, 3700 San Martin Dr., Baltimore, MD 21218 USA
28
Instituto de Física y Astronomía, Universidad de Valparaíso, Avda. Gran Bretaña 1111, Valparaíso, Chile
29
Hiroshima Astrophysical Science Center, Hiroshima University, 1-3-1 Kagamiyama, Higashi-Hiroshima, Hiroshima 739-8526 Japan
30
Department of Physics, University of Oxford, Denys Wilkinson Building, Keble Road, Oxford OX1 3RH UK
31
Max-Planck-Institut für extraterrestrische Physik, Gießenbachstraße 1, 85748 Garching, Germany
32
Purple Mountain Observatory, Chinese Academy of Sciences, 10 Yuanhua Road, Nanjing 210023 China
33
Center for Data-Driven Discovery, Kavli IPMU (WPI), UTIAS, The University of Tokyo, Kashiwa, Chiba 277-8583 Japan
34
Department of Astronomy, School of Science, The University of Tokyo, 7-3-1 Hongo, Bunkyo, Tokyo 113-0033 Japan
35
Dipartimento di Fisica e Astronomia, Università di Bologna, via Gobetti 93/2, 40129 Bologna, Italy
36
Dept. Fisica Teorica y del Cosmos, Universidad de Granada, Granada, Spain
37
Instituto Universitario Carlos I de Física Teórica y Computacional, Universidad de Granada, E-18071 Granada, Spain
38
I. Physikalisches Institut, Universität zu Köln, Zülpicher Strasse 77, 50937 Köln, Germany
39
National Centre for Nuclear Research, ul. Pasteura 7, 02-093 Warsaw, Poland
40
Department of Physics and Astronomy and George P. and Cynthia Woods Mitchell Institute for Fundamental Physics and Astronomy, Texas A&M University, 4242 TAMU, College Station, TX 77843-4242 USA
41
Max-Planck-Institut für Radioastronomie, Auf dem Hügel 69, Bonn D-53121 Germany
42
University of California, Davis, 1 Shields Ave., Davis, CA 95616 USA
43
Department of Astronomy and Joint Space-Science Institute, University of Maryland, College Park, MD 20742 USA
44
Astronomisches Rechen-Institut, Zentrum für Astronomie der Universität Heidelberg, Mönchhofstr. 12-14, 69120 Heidelberg, Germany
45
Caltech Optical Observatories, California Institute of Technology, Pasadena, CA 91125 USA
46
ESO Vitacura, Alonso de Córdova 3107, Vitacura, Casilla, 19001 Santiago de Chile, Chile
⋆ Corresponding author; This email address is being protected from spambots. You need JavaScript enabled to view it.
Received:
17
July
2024
Accepted:
12
November
2024
Abstract
Galaxy protoclusters are sites of rapid growth, with a high density of massive galaxies driving elevated rates of star formation and accretion onto supermassive black holes. Here, we present new JWST/NIRSpec IFU observations of the J1000+0234 group at z = 4.54, a dense region of a protocluster hosting a massive, dusty star forming galaxy (DSFG). The new data reveal two extended, high-equivalent-width (EW0 > 1000 Å) [O III] nebulae that appear at both sides of the DSFG along its minor axis (namely O3-N and O3-S). On one hand, the spectrum of O3-N shows a broad and blueshifted component with a full width at half maximum (FWHM) of ∼1300 km s−1, suggesting an outflow origin. On the other hand, O3-S stretches over 8.6 kpc, and has a velocity gradient that spans 800 km s−1, but shows no evidence of a broad component. However, both sources seem to be powered at least partially by an active galactic nucleus (AGN), so we classified them as extended emission-line regions (EELRs). The strongest evidence comes from the detection of the high-ionization [Ne V] λ 3427 line toward O3-N, which paired with the lack of hard X-rays implies an obscuring column density above the Compton-thick regime. The [Ne V] line is not detected in O3-S, but we measure a He IIλ 4687 /Hβ = 0.25, which is well above the expectation for star formation. Despite the remarkable alignment of O3-N and O3-S with two radio sources, we do not find evidence of shocks from a radio jet that could be powering the EELRs. We interpret this as O3-S being externally irradiated by the AGN, akin to the famous Hanny’s Voorwerp object in the local Universe. In addition, more classical line ratio diagnostics (e.g., [O III]/Hβ vs [N II]/Hα) put the DSFG itself in the AGN region of the diagrams, and therefore suggest it to be the most probable AGN host. These results showcase the ability of JWST to unveil obscured AGN at high redshifts.
Key words: galaxies: active / galaxies: high-redshift / galaxies: individual: AzTEC J100055.19+023432.8 / submillimeter: galaxies
© The Authors 2025
 Open Access article, published by EDP Sciences, under the terms of the Creative Commons Attribution License (https://creativecommons.org/licenses/by/4.0), which permits unrestricted use, distribution, and reproduction in any medium, provided the original work is properly cited.
This article is published in open access under the Subscribe to Open model. This email address is being protected from spambots. You need JavaScript enabled to view it. to support open access publication.
1. Introduction
In the current paradigm of galaxy formation, the densest structures form in the most massive halos at high redshifts (z > 2), at the junctures of cosmic web filaments of galaxies and neutral gas. These structures are known as protoclusters, as they eventually evolve into massive galaxy clusters at z < 1 (e.g., Baugh et al. 1998). Protoclusters are sites where active star formation, supermassive black hole (SMBH) accretion, and dynamical interactions trigger powerful feedback processes at large scales (Overzier 2016). The central regions of protoclusters can harbor dozens of galaxies within ≲100 kpc (e.g., Oteo et al. 2018; Miller et al. 2018; Hill et al. 2020), with several of them hosting active galactic nuclei (AGN) and/or starbursts, leading to dramatic effects on the surrounding gas in the form of outflows, shocks, tidal debris, and ionized nebulae.
Protoclusters undergoing their most rapid phase of growth are commonly (though not always) signaled by a luminous quasar (QSO; e.g., Shen et al. 2007; Hennawi et al. 2015; Decarli et al. 2019), a high-redshift radio galaxy (HzRG; e.g., Venemans et al. 2007; Miley & De Breuck 2008; Wylezalek et al. 2013; Noirot et al. 2018), and/or one or more submillimeter-bright dusty star-forming galaxies (DSFGs; e.g., Riechers et al. 2014; Casey 2016; Hill et al. 2020; Wang et al. 2021). These sources are often embedded in giant H I Lyman-α (Lyα) nebulae, which in some cases reach scales of hundreds of kiloparsecs (e.g., McCarthy et al. 1987; Reuland et al. 2003; Borisova et al. 2016; Swinbank et al. 2015; Kikuta et al. 2019; Guaita et al. 2022; Apostolovski et al. 2024).
The gas in such environments is known to be multiphase, and hence the extended emission is not restricted to Lyα. Recent detections of extended CO, [C I] and [C II] emission imply the existence of cold gas reservoirs tracing widespread star formation and accretion (e.g., Emonts et al. 2018, 2023; Umehata et al. 2021). Similarly, He II-, C IV-, and [O III]-emitting ionized nebulae, are typically found to trace outflows and photoionization by AGN (e.g., Overzier et al. 2013; Cai et al. 2017). [O III] nebulae are particularly common around HzRGs, where kinetic feedback also plays a role, as suggested by their alignment with the radio jets (e.g., Nesvadba et al. 2017).
The James Webb Space Telescope (JWST) is becoming an important tool to understand ionized nebulae within protoclusters, since it has opened access to the diagnostic-rich rest-frame optical spectrum at z > 3. The Near-InfraRed Spectrograph’s Integral Field Unit (NIRSpec IFU), in particular, has allowed the community to identify and characterize extended [O III] nebulae around quasars (e.g., Wylezalek et al. 2022; Perna et al. 2023; Decarli et al. 2024), HzRGs (e.g., Saxena et al. 2024; Roy et al. 2024; Wang et al. 2024), and DSFGs (e.g., Pérez-González et al. 2024) in protoclusters or dense groups at high z.
In this paper, we present NIRSpec IFU observations of J1000+0234, a well-known z = 4.54 galaxy group in the COSMOS field (e.g., Capak et al. 2008; Smolčić et al. 2017a) hosting a massive DSFG ( , Smolčić et al. 2015) and a luminous Lyman-break galaxy (LBG, MUV ≈ −24.2; Gómez-Guijarro et al. 2018) called CRISTAL-01a (hereafter C01) within the inner 20 kpc. This system resides in the center of a zphot ≈ 4.5 overdensity of LBGs at both small (< 2′) and large (> 2′) scales (Smolčić et al. 2017a; Jiménez-Andrade et al. 2023), and has been linked to the zspec = 4.57 Taralay protocluster (also known as PCI J1001+0220, Lemaux et al. 2018; Staab et al. 2024). Furthermore, Jiménez-Andrade et al. (2023) observed J1000+0234 using the Multi Unit Spectroscopic Explorer (MUSE) mounted on the Very Large Telescope (VLT), and found a LLyα ≈ 4 × 1043 erg s−1 Lyα blob (LAB) and a handful of lower-mass Lyα emitters distributed around the DSFG. Moreover, the authors confirm the results of Smolčić et al. (2017b) using the COSMOS2020 catalog (Weaver et al. 2022), and find an overdensity of δgal = 6 ± 1 within a comoving volume of 15 Mpc3.
Three puzzling observations make J1000+0234 an interesting case to study: first, the DSFG is detected at radio frequencies with L1.4 GHz = 5.1 ± 10 × 1024 W Hz−1 (Carilli et al. 2008; Capak et al. 2008; Jiménez-Andrade et al. 2023) that are possibly attributed to an AGN, yet have no X-ray counterpart. Secondly, the LAB is spatially and spectrally offset from the DSFG, but is coincident with the nearby LBG C01 (Jiménez-Andrade et al. 2023). Finally, Solimano et al. (2024) find a plume of [C II] 158 μm line emission of 15 kpc in length toward J1000+0234 using deep ALMA observations, indicating a dynamically complex system, although its physical origin remains unclear. The observations presented here reveal additional features that bring us closer to obtaining a full picture of the baryonic cycle around J1000+0234.
Throughout the paper, we assume a flat cosmology described by H0 = 70 km s−1 Mpc−1 Ωm, 0 = 0.3, and ΩΛ, 0 = 0.7. At z = 4.54, the physical scale is 6.578 kpc arcsec−1.
2. Observations and data reduction
2.1. JWST/NIRCam data
Multiband NIRCam imaging data of the J1000+0234 system comprise a total of six broadband filters. Images using the F115W, F150W, F277W, and F444W filters were taken as part of the public Cosmos-Web survey (GO-1727, PI: Kartaltepe & Casey, Casey et al. 2023) using integration times of 515 s per filter at the position of J1000+0234, while the F200W and F356W bands were observed for 1074s as part of GO-4265 (PI: González-López). At the redshift of our source, the F277W and F356W filters cover the [O III]+Hβ and Hα emission lines, respectively.
We reduced these data using the CRAB.Toolkit.JWST1 wrapper of the JWST pipeline (version 1.10.0, pmap = 1075) with highly optimized parameters. In addition, we followed Bagley et al. (2023) for 1/f noise mitigation, applied background subtraction via the skymatch method of the standard pipeline, removed wisp artifacts using published templates (Bagley et al. 2023), and finally aligned our images to the COSMOS2020 catalog (Weaver et al. 2022). The combined images are drizzled to a common grid with a pixel size of  .
.
2.2. JWST/NIRSpec data
In this work, we used JWST/NIRSpec IFU data from programs GO-3045 (PI: Faisst) and GO-4265 (PI: González-Lopez) that target the J1000+0234 system with the G235M (1.7 μm < λ < 3.2 μm, R ∼ 1000) and G395H (2.9 μm < λ < 5.3 μm, R ∼ 2700) gratings, respectively.
The G235M dataset was taken using two 1080 s dithered exposures with overlap at the location of C01. The G395H dataset was set up as a two-tile mosaic covering both C01 and the [C II] plume reported by Solimano et al. (2024). Each tile was observed for 5974 seconds.
The data were reduced with the standard JWST pipeline (version 1.12.5, pmap = 1234) plus some additional tweaks. Briefly, we followed the scripts provided by Rigby et al. (2023)2 but implemented improved snowball removal in Stage 1, and additional bad pixel flagging after Stage 1. Also, we switched on the outlier-rejection step in Stage 3, and turned off the master background subtraction. Instead, background subtraction was performed as a post-processing step, together with stripe mitigation and astrometric alignment to NIRCam. A more detailed description of the reduction is presented elsewhere (Fujimoto et al., in prep.).
3. Results and analysis
The NIRCam images reveal significant emission from several sources that were faint in previous Hubble Space Telescope (HST) imaging (Gómez-Guijarro et al. 2018; Solimano et al. 2024). For example, the DSFG starlight is now clearly detected in the long-wavelength filters. Interestingly, two other sources dominate the emission in the F277W and F356W filters (appearing green in Fig. 1), indicating the possibility of high-equivalent-width [O III], Hβ, and Hα emission lines. The first of these sources is just  north of the DSFG, at the same location as an HST source (J1000+0234-North in Gómez-Guijarro et al. 2018, O3-N hereafter). The other is located south of the DSFG (hence O3-S), and has a projected extent of
  , and extremely faint HST magnitudes (mF125W ≈ 26 AB).
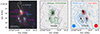 |
Fig. 1. Multiwavelength view of the J1000+0234 system at z = 4.54. Left panel: Color composite image of the J1000+0234 system as seen by JWST/NIRCam. The filters F356W, F277W, and F200W are mapped to the red, green, and blue channels, respectively. The F277W filter captures the Hβ +[O III] emission at z = 4.54. Magenta regions indicate the apertures used in this paper. The gray dashed contour delineates the [C II] plume detected with ALMA (Solimano et al. 2024). The blue arrow points to a foreground galaxy at zspec = 1.41 (Capak et al. 2008). Middle panel: NIRCam F444W image with contours of the [O III] emission detected in the NIRSpec G235M observations. Contours start at 2σ = 3.3 × 10⁻¹⁷ erg s−1 cm−2 arcsec−2 and increase as integer powers of 2. The blue and red solid regions show the footprint of the observations obtained with G235M and G395H gratings, respectively. The green circle in the bottom right corner indicates the angular resolution element. Right panel: NIRCam F277W image with ±3, 4, 5, and 6σ contours from Very Large Array (VLA) S-band continuum (red), and {1,5,16,30} × 10−18 erg s−1 cm−2 arcsec−2 contours of Lyα emission (blue) from VLT/MUSE (Jiménez-Andrade et al. 2023; Solimano et al. 2024). Blue and red circles indicate the angular resolutions of the MUSE and VLA datasets, respectively. |
JWST/NIRSpec observations confirm the presence of strong [O III] emission at the locations of O3-N (EW0 = 1780 ± 80 Å) and O3-S (EW0 = 5100 ± 1000 Å)3 and, more importantly, at the same redshift as J1000+0234, therefore confirming their physical association (see the middle panel of Fig. 1). The nebulae also seem to be co-spatial with the 3 GHz radio detections, but they are offset from the Lyα peak surface brightness (SB; see the right panel of Fig. 1).
In the following subsections, we use apertures to extract and explore the spectroscopic properties of the two [O III] nebulae. The labeled apertures in Fig. 1 were manually defined based on the RGB NIRCam image and the [O III] map. For the DSFG we used an aperture significantly smaller than the full extent of the source to avoid contamination from O3-N. We also defined two sub-apertures within the [O III] nebulae that either enclose the peak of [O III] emission (O3-N-core) or maximize the signal-to-noise ratio (S/N) of the He II line (O3-S-HeII).
3.1. Morphology and kinematics
The middle panel in Fig. 1 shows the distribution of [O III] λ 5008 SB around J1000+0234. As expected, significant emission was detected in O3-N and O3-S, but also on C01 and the DSFG. Moreover, the global [O III] emission seems to be spatially extended and low SB emission connects nearly all of the objects in the scene.
Figure 2 features the velocity field and velocity dispersion maps of the [O III] emission line in the system. These maps were created following Solimano et al. (2024), with a spatial and spectral Gaussian convolution kernel applied to the continuum-subtracted cube. The spatial kernel has σ = 1 spaxel, whereas the spectral kernel has σ = σLSF at the wavelength of the line. The moments were created by masking out all the voxels with S/N < 3 in the convolved cube. In the velocity field map we see the DSFG and O3-N share similar velocities, with an offset of ≈500 km s−1 with respect to C01. In turn, O3-S shows a large velocity gradient north-to-south, with a velocity span of almost ∼800 km s−1 from end to end. If we were to interpret this gradient as a signature of virialized rotation, a rough calculation would yield a dynamical mass on the order of  . This value is comparable to the dynamical mass of the DSFG (Fraternali et al. 2021), but since O3-S lacks significant stellar or dust emission, we deem unlikely that O3-S is a massive rotator. Instead, O3-S could be tidal debris from an ongoing interaction between the members of the system. In particular, the presence of a low-SB bridge between O3-S and C01, together with matching line-of-sight velocities in the southern end of both sources, already hints at a tidal origin. Further discussion of this scenario is presented in Sect. 5.
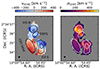 |
Fig. 2. Resolved [O III] kinematics of J1000+0234. Velocity field (left) and velocity dispersion (right) maps. The reference velocity is defined at z = 4.5471. |
Additionally, the velocity dispersion map of the [O III] emission shows a fairly uniform structure at 200 km s−1 in most of the system except for O3-N. The velocity dispersion in O3-N reaches 500 km s−1, indicating a higher dynamical mass, increased turbulence, or additional kinematic components.
3.2. Broad velocity component in O3-N
Inspection of the [O III] and Hα line profiles in the O3-N aperture reveal the presence of broad velocity wings. To characterize this additional kinematic component, we fitted single and double Gaussians plus a constant continuum level as detailed in Appendix B.
The results of our fits are shown in Figure 3. The double Gaussian model is preferred over the single one based on its higher Bayesian evidence score, and lower Akaike Information Criterion (AIC; e.g., Cavanaugh 1997) and Bayesian Information Criterion (BIC; e.g., Schwarz 1978) scores.
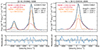 |
Fig. 3. Evidence of a broad velocity component in the strongest emission lines from O3-N, namely [O III] λλ 4960,5008 (left) and Hα +[N II] λλ 6550,6585 (right). In both lines, a double Gaussian profile is preferred over a single Gaussian fit (not shown), based on the former having a larger log(Z), and lower AIC and BIC scores (see upper right legends). The bottom panels show the residuals of the subtraction of the best-fit model from the data, in units of σ. |
The [O III] broad component of O3-N displays a full width at half maximum (FWHM) of  , and is blueshifted by 158 ± 24 km s−1 from the central velocity of the narrow component. Such a profile of the [O III] line (broad and blueshifted) typically points to the existence of strong ionized outflows projected onto the line of sight. Hα shows an even broader but less blueshifted profile.
Notably, since O3-N sits at the base of the [C II] plume (see left panel of Fig. 1) and has a broad [O III] component at the same velocity (v0 ≈ 150 km s−1) as the corresponding [C II] 158 μm line, the outflow scenario proposed by Solimano et al. (2024) emerges as a natural explanation. A detailed assessment of this possibility will be presented in a forthcoming paper.
The spectrum of O3-S (Fig. 4) also shows a secondary velocity component, but this likely arises from the large velocity gradient (cf. Fig. 2) contained within the aperture, or by the superposition of two nebulae separated by roughly 400 km s−1. An outflow origin for O3-S seems less plausible because the two components have the same velocity width.
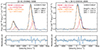 |
Fig. 4. Same as Fig. 3 but for O3-S. Here, both components have similar line width, in contrast with the expectations for an outflow. |
3.3. Line ratio diagnostics and high-ionization species
We measured all line fluxes and errors using pPXF (Cappellari 2017, 2023) as detailed in Appendix A. From these, we computed the five line ratios presented in Fig. 5. The bottom panels of Fig. 5 show three diagrams displaying the R3 = [O III] λ 5008 /Hβ ratio against three different line ratios, namely N2 = [N II] λ 6583 /Hα (Baldwin et al. 1981, the “BPT” diagram), S2 = [S II] λλ 6716,6731 /Hα, and O1 = [O I] λ 6302 /Hα (also known as the Veilleux & Osterbrock 1987, or VO87 diagrams). In each of them we plotted the theoretical boundary between star-formation (SF) and AGN photoionization models from Kewley et al. (2001, 2006). In the BPT diagram we also plotted the boundary between AGN and low-ionization nuclear emission regions (LINERs; Schawinski et al. 2007). Recent JWST observations have found that these classical boundary lines are not reliable at the low metallicities and high-ionization conditions typically found at high redshifts, which make SFGs and AGN overlap in these diagrams (e.g., Harikane et al. 2023; Maiolino et al. 2024; Scholtz et al. 2023). Hence, we also plotted the more conservative boundary line proposed by Scholtz et al. (2023) to account for this issue. In addition, we show in Fig. 5 the He2-N2 diagram (Shirazi & Brinchmann 2012), featuring He2 = He IIλ 4686 /Hβ vs N2. This diagnostic diagram has been cited as a more robust way to select AGN than the classical BPT and VO87 diagrams (e.g., Scholtz et al. 2023), although the He IIλ 4686 is often too faint to be detected.
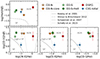 |
Fig. 5. Diagnostic line ratio diagrams for the relevant regions of the J1000+0234 system. Bottom left: Standard BPT R3 vs. N2 diagram. The solid curved lines represent the maximum starburst line of Kewley et al. (2001), while the straight dashed line on the lower right-hand side divides AGN from LINERs according to Schawinski et al. (2007). The dotted line is the separation from SF and AGN adapted for high-z galaxies by Scholtz et al. (2023). Bottom center: R3 vs. S2 VO87 diagram. Again, the solid line is from Kewley et al. (2001) and the dotted line is the high-z SF/AGN separation from Scholtz et al. (2023) Bottom right: R3 vs. O1 VO87 diagram. The solid line separates SF from AGN according to Kewley et al. (2001). Top left: He2 vs. N2 diagram. The division line between AGN and SF is taken from Shirazi & Brinchmann (2012). |
Despite these caveats, we see in Fig. 5 that only C01 appears to be consistent with pure SF, while the rest can be explained at least partially by AGN excitation. On the other hand, the DSFG is the only source showing AGN-like ratios in all diagrams.
The possible presence of an AGN has already been proposed by Jiménez-Andrade et al. (2023) based on the radio detection, and the He IIλ 1640 /Lyα and C IVλ 1551 /Lyα ratios. Additional support to this idea comes from the detection of the [Ne V] λ 3427 line toward O3-N-core (see Fig. C.1), since [Ne V] requires photons with E > 97.11 eV. Such high energies are most easily attainable with AGN activity, either in the form of photoionization or fast shocks (e.g., Gilli et al. 2010; Mignoli et al. 2013; Leung et al. 2021; Cleri et al. 2023).
In O3-S and O3-S-HeII, at the other side of the DSFG, we did not detect [Ne V] λ 3427, but only He IIλ 4686 (see Fig. C.2). Due to the lower ionization energy of helium (E > 54.42 eV), this line is not as clean an indicator of AGN as the [Ne V] line, and can indeed be excited by X-ray binaries (e.g., Schaerer et al. 2019), Wolf-Rayet stars (e.g., Shirazi & Brinchmann 2012), and shocks (Izotov et al. 2012), among others. Nevertheless, its location on the He2-N2 diagram is well above the SF boundary line.
Finally, we also detected the temperature-sensitive [O III] λ 4364 auroral line toward O3-N-core and O3-S-HeII (see Appendix C). A high ratio between [O III] λ 4364 and the Hγ line was recently proposed as an alternative indicator of AGN photoionization (e.g., Übler et al. 2024). In Fig. 6, we plot the position of O3-N-core and O3-S-HeII in the three diagnostic diagrams developed by Mazzolari et al. (2024) based on [O III] λ 4364 emission. We applied a reddening correction of AV = 1.58 ± 0.16 mag to O3-N-core based on its Balmer decrement (see Sect. 5.2), while O3-S-HeII is consistent with zero dust. Our points nominally fall in the AGN-only region in two out of three diagrams, but they cross the boundary lines within the uncertainties. Therefore, we are unable to make any firm conclusions regarding the AGN nature of O3-N-core and O3-S-HeII based on the Mazzolari et al. (2024) diagrams.
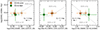 |
Fig. 6. Diagnostic line-ratio diagrams based on [O III] λ 4364 emission. In all three panels the dashed line is the empirical demarcation between pure AGN and AGN/SF mixtures proposed by Mazzolari et al. (2024). The faded markers with error bars are determined from our pPXF fits to the spectra without reddening correction. The bold markers show the values after reddening correction, with AV = 1.58 ± 0.16 mag for O3-N-core and AV = 0 mag for O3-S-HeII. The black arrows denote the dereddening vector for an attenuation of AV = 1 mag with the Calzetti et al. (2000) attenuation law. |
4. Oxygen abundance
We measured gas-phase oxygen abundances in the spectra of the different apertures using the indirect indicator proposed by Dopita et al. (2016). This indicator is calibrated as
 (1)
(1)
We chose this indicator because it uses lines from a single grating/filter combination (G395H), thus avoiding possible systematic effects from the combination of the two datasets, and also because it is fairly robust to dust attenuation effects (which are significant at least in the case of the DSFG). The main caveat is that it relies on the assumption of a specific relation between N/O and O/H abundances.
Figure 7 shows the values obtained for all the apertures considered in this paper, including dedicated apertures for the two clumps C01-SW and C01-NE. As expected, the DSFG shows the highest (even supersolar) oxygen abundance. The rest of the apertures are distributed throughout the abundance scale, with O3-S showing the lowest abundance. We also report a large difference (∼0.8 dex) between C01-SW and C01-NE, with the latter dominating the integrated value (C01-total).
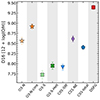 |
Fig. 7. Oxygen abundances of the sources in the J1000+0234 system according to the Dopita et al. (2016) calibration. Markers are the same as in Fig. 5, except we also show C01-NE and C01-SW. |
5. Discussion
We found in the previous section that the two strongest [O III] nebulae in the system are likely related to AGN activity. In the following subsections, we explore the possibility of radiative shocks, provide an estimate of AGN luminosity and obscuring column density given the current constraints, and then discuss the physical scenario for the origin of the [O III] nebulae.
5.1. No evidence of shocks
The detection of radio emission at the positions of O3-N and O3-S suggests the presence of shocks produced by a radio jet. This might explain, for example, the enhanced velocity dispersion observed even in the “narrow” component of the emission lines (σ ≳ 100 km s−1). However, the observed line ratios (see Fig. 5) do not resemble those expected in fast radiative shocks, in contrast to those observed in the “Ulema” galaxy, a low-mass radio-detected AGN at z = 4.6 (D’Eugenio et al. 2025). In particular, shock models assuming solar abundances predict N2, S2 and O1 ratios that are typically above −0.5 dex, −0.5 dex, and −1.2 dex, respectively (e.g., Allen et al. 2008; Alarie & Morisset 2019). At lower metallicities, these ratios can approach the values we observe in our data, but the R3 ratio decreases as well.
These results indicate that shocks play a negligible role in the ionization of the O3-N and O3-S nebulae. To further test this idea, we explored the relationship between the shock-sensitive N2 ratio and the line width. In shocked gas, a positive correlation has been found between N2 and velocity dispersion (e.g., Rich et al. 2011, 2015; Ho et al. 2014), indicating a coupling between the gas ionization and kinematics, which is not predicted in pure photoionization models (Kewley et al. 2019).
We thus took advantage of JWST NIRSpec IFU’s spatial resolution to measure the resolved N2 ratio within O3-N and O3-S. We extracted spectra from the 30 and 39 spaxels contained in O3-N and O3-S apertures (see Fig. 1), respectively. We then fitted each spectrum with single and double Gaussians using the method described in Appendix B. Finally, we removed all fits where the posterior error on log([N II] λ 6585 /Hα) is larger than 0.3 dex.
Obtained values of N2 and velocity dispersion (σ) where the best fit is a single Gaussian component are shown with green markers in Fig. 8, while the results where a double component is preferred are shown in orange and blue markers for the narrow and broad components, respectively.
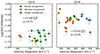 |
Fig. 8. Resolved N2 ratio as a function of line velocity dispersion in O3-S (left) and O3-N (right). The inset text displays the Spearman’s rank correlation coefficient r and its corresponding p-value. No significant correlation is present in either panel. |
We computed the Spearman’s rank correlation coefficient independently for each set of spaxels, and estimated the uncertainties from 600 bootstrap samples. We find no significant correlation between the line ratio and the velocity dispersion in either O3-N ( , p = 0.78) or O3-S (
 , p = 0.71). Instead, the N2 ratio remains relatively uniform across the dispersion axis, with a median value of −0.74 dex in O3-N and −1.5 dex in O3-S. The different median ratio between the two nebulae could be explained by different metallicities (see Sect. 4).
5.2. Constraints on AGN luminosity and obscuration
As pointed out by several authors (e.g., Capak et al. 2008; Smolčić et al. 2015; Jiménez-Andrade et al. 2023), J1000+0234 was undetected in Chandra’s 80 ks observations in the 0.5–2 keV band (Elvis et al. 2009), leading to a flux upper limit of 3 × 10⁻¹⁶ erg s−1 cm−2 (Capak et al. 2008). Assuming a Galactic foreground column density of NH = 2.6 × 1020 cm−2 and a power-law source with a photon index of Γ = 1.4, this upper limit translates to a rest-frame hard X-ray luminosity of L2 − 10 keV < 6.8 × 1043 erg s−1 (Solimano et al. 2024).
We then tried to determine whether such an AGN can explain the observed narrow-line luminosities. To address this question, we used the scaling relations of Berney et al. (2015) based on a sample of nearby, hard X-ray-selected AGN for [O III] and other optical lines as a function of L2 − 10 keV. In O3-N, we measured an [O III] λ 5008 flux of (2.51 ± 0.04)×1016 erg s−1 cm−2, and a Balmer decrement of Hα/Hβ = 4.9 ± 0.6. Assuming case B recombination with an intrinsic ratio of Hα/Hβ = 2.86 and a Calzetti et al. (2000) attenuation law, we derived AV = 1.9 ± 0.4 mag. We thus inferred a reddening-corrected [O III] λ 5008 luminosity of (2.7 ± 0.5)×1044 erg s−1.
The Berney et al. (2015) relation predicts that at an intrinsic 2 − 10 keV luminosity of 6.8 × 1043 erg s−1, the [O III] luminosity reaches log(L[O III]/[erg s−1]) = 42 ± 0.6. Despite the large scatter of the Berney et al. relation, our measured [O III] luminosity exceeds the prediction as a 4σ outlier. This means that either (1) the X-ray source is heavily obscured and thus the intrinsic X-ray luminosity is much larger, (2) the [O III] emission is not only excited by the AGN but is rather mainly excited by SF, (3), the Berney et al. (2015) relation is not applicable at this redshift, or indeed (4) a combination of all of the above.
At face value, the measured [O III] luminosity would correspond to an intrinsic X-ray luminosity of L2 − 10 keV = 1046 erg s−1, after extrapolating the range of the Berney et al. (2015) relation, and assuming no contribution from SF. We used the simple absorbed power-law model with Γ = 1.4 within the Chandra PIMMS tool4 (version 4.12d) to infer a column density of NH > 3.9 × 1024 cm−2 to produce the observed 2–10 keV luminosity. Increasing the photon index to Γ = 2 would raise the column density to NH > 4.7 × 1024 cm−2. In other words, the AGN needs to be Compton-thick along the line of sight to explain the non-detection of X-rays. However, at the same time, there must be an optically thin path for the ionizing radiation to escape and produce the observed [O III] emission.
We repeated the exercise using the [Ne V] λ 3427 detection. Given the extremely high energies needed to produce the Ne4+ ion, the contribution from SF is null or negligible. In the O3-N-core aperture, we measured a [Ne V] λ 3427 flux of (2.25 ± 0.33)10−18 erg s−1 cm−2 and a Balmer decrement of Hα/Hβ = 4.52 ± 0.16. Assuming case B recombination with an intrinsic ratio of Hα/Hβ = 2.86 and a (Calzetti et al. 2000) attenuation law, we derive AV = 1.58 ± 0.16 mag. We thus inferred a reddening-corrected [Ne V] λ 3427 luminosity of (4.8 ± 1.2)×1042 erg s−1. Berney et al. (2015) also provide a relation for [Ne V] luminosity versus X-ray luminosity, although it is derived from a smaller sample and has a larger scatter than the [O III] relation. According to this latter relation, the intrinsic X-ray luminosity should be 2.4 × 1045 erg s−1. Using the same model as before, the column density needed to obscure that X-ray output is NH > 2 × 1024 cm−2, which is just above the Compton-thick limit.
Assuming the AGN is buried at the center of the DSFG, we now ask how much of the inferred obscuration can be accounted for by the ISM alone. This is motivated by the recent results of Andonie et al. (2024) who find that infrared-quasar host galaxies with SFR ≳ 300 M⊙ yr−1 have submillimeter sizes as compact as those of DSFGs, implying a very dense ISM with column densities potentially exceeding the Compton limit. Following Andonie et al. (2024), we estimated the average column density by uniformly distributing the total gas mass (here Mgas = 1.5 × 10¹¹ M⊙, Fraternali et al. 2021) over a sphere with a radius equal to the Sérsic effective radius (reff = 0.74 kpc, measured from a fit to the rest-frame 158 μm ALMA image, Solimano et al. 2024), finding 〈NH〉ISM ≈ 2.5 × 1024 cm−2. Therefore, we conclude that the ISM of the DSFG has enough material to obscure the X-rays. However, some of it must be located very close to the AGN; otherwise, we would detect the broad line region in the spectrum of the DSFG.
The results discussed above again suggest that the AGN is heavily obscured toward our line of sight, yet is powerful enough to produce luminous [O III] (and even [Ne V] emission) along unobscured sightlines. Such sightlines can be the result of a radio jet that has cleared them of obscuring material; we discuss this explanation in Sect. 5.3.
5.3. Proposed scenario and implications
Here, we put forward a scenario that explains the observed emission. First, we assume that an AGN resides in the very center of the DSFG. This is motivated by the fact that the DSFG occupies the AGN loci of all the diagnostic diagrams we have considered (see Sect. 3.3). In addition, given the MSMBH − M* relation (e.g., Reines & Volonteri 2015; Pacucci et al. 2023), the DSFG is the most likely to host a massive SMBH, and thus an AGN. Moreover, its location between the two radio detections makes it the potential launching site of a jet, as proposed by Jiménez-Andrade et al. (2023).
An alternative explanation has O3-N as a separate galaxy altogether; presumably a lower-mass AGN host currently being accreted by the DSFG (see scenarios 3 and 4 of Solimano et al. 2024). This would mean that the J1000+0234 system hosts either a dual AGN (if both the DSFG and O3-N are active) or an offset AGN (if only O3-N is active). Dual and offset AGN have been extensively reported in the literature, with examples in both the local (e.g., Barth et al. 2008; Mazzarella et al. 2012; Koss et al. 2012; Barrows et al. 2017; Secrest et al. 2017) and distant Universe (e.g., Gerke et al. 2007; Comerford et al. 2015; Perna et al. 2023; Übler et al. 2024). These phenomena are strongly linked to galaxy mergers, making J1000+0234 a plausible candidate. However, an investigation of the 3D geometry of the system to decipher whether O3-N is behind or in front of the DSFG is required to provide further insight into the offset/dual AGN scenario. We defer such an analysis to a future paper.
For simplicity, we return to our fiducial scenario where the AGN is at the nucleus of the DSFG. In this picture, O3-N traces an extended emission-line region (EELR; e.g., Stockton et al. 2006) and an outflow driven by the AGN, as evidenced by the line ratios and broad velocity component, respectively.
Regarding O3-S, one could presume it represents the bipolar counterpart of O3-N (i.e., the receding side of the outflow). However, the observed kinematics, morphology, and spectral properties suggest otherwise. In particular, the large velocity gradient, narrower line width, lower SB, lower metallicity (see Sect. 4), and more elongated structure make O3-S fundamentally different from O3-N. As suggested in Sect. 3.1, O3-S is unlikely to be a separate galaxy with Mdyn ≈ 1011 M⊙, but rather a stream of tidal debris. The connection (both spatial and spectral) between C01 and O3-S then suggests that the gas might have been tidally stripped from C01. This is supported by the finding that O3-S has a very similar oxygen abundance to the southern clump of C01 (C01-SW, see Fig. 7).
Finally, due to the high ionization implied by the strong [O III] and He II lines, and its location along the jet axis, we propose that O3-S is being externally illuminated by the AGN. In other words, O3-S is an EELR analog to the famous Hanny’s Voorwerp (Lintott et al. 2009). The Voorwerp is characterized by extended, high-equivalent-width [O III] emission at a far projected distance from the galaxy IC 2497. The leading explanation for the nature of the Voorwerp is that a portion of an otherwise-invisible gas tidal tail was exposed to ionizing radiation from the now-faded AGN in the center of IC 2497. Moreover, the escape path of the ionizing photons was carved by a past jet, as evidenced by the detection of a steep-spectrum extended radio relic (Józsa et al. 2009; Smith et al. 2022).
It could be that we are witnessing a similar situation in J1000+0234, although we cannot say whether the AGN in the DSFG is currently switched off or is simply obscured along the line of sight. However, the radio luminosity in J1000+0234 is approximately 100 times lower than the power of typical radio-selected HzRGs (L1.4 GHz ≳ 1027 W Hz−1, Miley & De Breuck 2008), but at the same time is approximately 500 times higher than that of the Voorwerp (L1.4 GHz ≈ 1023 W Hz−1, Józsa et al. 2009). Therefore, the observed emission is more likely explained by a moderate luminosity jet, rather than a relic. Therefore, when considering the alignment of the radio sources along the axis that connects O3-N and O3-S, the idea of a jet carving an unobscured sightline in the polar direction becomes more compelling.
It is important to emphasize that J1000+0234 was selected because of its bright submillimeter emission and associated Lyα blob, as this could uncover a common trend among DSFG groups or protoclusters. For example, Vito et al. (2020) find a powerful (L2 − 10 keV ≈ 3 × 1045 erg s−1) Compton-thick QSO hiding in the most gas-rich and submillimeter-bright member of the z = 4 protocluster known as DRC (Oteo et al. 2018). This system also hosts a LAB with emission of the high-ionization He II and C IV lines. A second example is that of the SPT2349-56 protocluster, a z = 4.3 structure hosting at least 21 DSFGs (Miller et al. 2018; Hill et al. 2020) and a faint LAB (Apostolovski et al. 2024). Recently, deep X-ray and radio observations revealed the presence of two AGN within SPT2349-56 (Vito et al. 2024; Chapman et al. 2024). Vito et al. (2024) then argue that SPT2349-56 and DRC together provide evidence of an enhanced AGN fraction within gas-rich protoclusters.
J1000+0234 is certainly less massive and extreme than either DRC or SPT2349-56, yet our detection of a Compton-thick AGN in it may be related to the same mechanisms that trigger obscured SMBH accretion in these two protoclusters. In theoretical frameworks of galaxy–SMBH coevolution (e.g., Hopkins et al. 2008), it is expected that the conditions (e.g., those created in gas-rich mergers) that give rise to extreme dusty starbursts also favor (obscured) SMBH accretion. Observationally, the DSFG-AGN connection is stronger in dense environments, which is possibly due to the higher rate of merger and interaction (Monson et al. 2023; Vito et al. 2024). A more systematic investigation of the obscured AGN fraction as a function of overdensity and SFR is needed to consolidate these trends.
While rest-frame hard X-rays will remain the gold standard for selecting obscured AGN, current facilities need to spend several tens of hours on source to produce detections at high z. In this context, our results suggest that a search for EELRs with the JWST NIRCam and NIRSpec might provide an alternative way to select high-z AGN.
6. Summary and conclusions
We present the discovery and characterization of two bright [O III] nebulae, O3-N and O3-S, around the J1000+0234 DSFG. Using JWST/NIRCam and JWST/NIRSpec, we characterized the morpho-kinematic structure of the nebulae, as well as their potential sources of ionization. Our results can be summarized as follows:
-
O3-N, the brightest [O III] nebula in the system, shows a broad and blueshifted velocity component with FWHM ≳ 1200 km s−1, as measured in both [O III] and Hα lines. We interpret this as evidence of ionized outflows, with a potential link to the [C II] plume of Solimano et al. (2024).
-
While fainter than O3-N, O3-S is more extended and shows an elongated but irregular morphology. Moreover, the resolved [O III] velocity field reveals a 800 km s−1 gradient roughly aligned with the major axis of O3-S, but without a peaked velocity dispersion profile. Also, the lack of emission from stars, cold gas or dust from O3-S disfavors its identification as a massive rotating galaxy. Instead, given the low-SB bridge between O3-S and C01, in addition to their similar oxygen abundances, we deem it more likely that O3-S is a tidal feature stemming from C01.
-
Nebular line ratio diagrams suggest at least some degree of AGN ionization in all the sources considered in this paper (except for C01). The DSFG, in particular, shows line ratios consistent with AGN in all the diagrams considered.
-
We detect the temperature-sensitive [O III] λ 4634 auroral line in the central regions of O3-N and O3-S. However, these sources fall very close to the boundary line between pure AGN and an AGN–SF mixture in the [O III] λ 4634 -based diagrams proposed by Mazzolari et al. (2024).
-
The central region of O3-N also shows a significant detection of the high-ionization [Ne V] λ 3427 line (E > 97.1 eV), an almost univocal tracer of AGN activity. Paired with the non-detection of rest-frame hard X-rays, we derive low LX/L[O III] and LX/L[Ne V] ratios that imply Compton-thick levels of obscuration. Interestingly, if the AGN is at the nucleus of the DSFG, the inferred column densities (NH ≳ 2 − 5 × 1024 cm−2) are consistent with arising from the ISM alone, as suggested by its dense and compact morphology, as derived in previous ALMA imaging.
-
We tested whether or not shocks could be responsible for the emission in O3-N and O3-S by measuring the [N II] λ 6850 /Hα ratio on a spaxel-by-spaxel basis. We find no correlation between the ratio and the velocity dispersion, thus disfavoring a shock scenario.
We propose a scenario where both nebulae are EELRs powered by an AGN deeply buried within the DSFG. While O3-N shows a prominent outflow, O3-S belongs to a tidal tail of C01. This scenario makes O3-S a plausible high-z analog of Hanny’s Voorwerp, a residual ionized nebula excited by a faded AGN. In this picture, the action of the radio jets might have opened a path along the polar direction for the AGN ionizing radiation to reach O3-S and O3-N. We discuss our findings in the context of the enhanced AGN fraction found in massive, gas-rich protocluster cores at similar redshifts. Our results suggest that the processes that drive obscured SMBH accretion in these structures (e.g., mergers) might also be at play in the less massive J1000+0234 group. Finally, we highlight the ability of JWST to uncover hidden AGN at high redshifts, in a regime where current X-ray facilities lack the required sensitivity.
Available at https://zenodo.org/doi/10.5281/zenodo.10737011
The equivalent width values presented here consider only the 5008 Å line of the [O III] doublet.
Acknowledgments
This work is based in part on observations made with the NASA/ESA/CSA James Webb Space Telescope. The data were obtained from the Mikulski Archive for Space Telescopes at the Space Telescope Science Institute, which is operated by the Association of Universities for Research in Astronomy, Inc., under NASA contract NAS 5-03127 for JWST. These observations are associated with programs JWST-GO-01727, JWST-GO-0345, and JWST-GO-04265. We also thank Mingyu Li for useful discussions and the My Filter tool https://doi.org/10.5281/zenodo.10210201. M. S. was financially supported by Becas-ANID scholarship #21221511. M. S., S. B., M. A., R. J. A., J. G-L., M. Boquien, and V. V. all acknowledge support from ANID BASAL project FB210003. M. R. acknowledges support from the Narodowe Centrum Nauki (UMO-2020/38/E/ST9/00077) and support from the Foundation for Polish Science (FNP) under the program START 063.2023. E. I. acknowledges funding by ANID FONDECYT Regular 1221846. M. Boquien gratefully acknowledges support from the FONDECYT regular grant 1211000. This work was supported by the French government through the France 2030 investment plan managed by the National Research Agency (ANR), as part of the Initiative of Excellence of Université Côte d’Azur under reference number ANR-15-IDEX-01. G. C. J. acknowledges funding from the “FirstGalaxies” Advanced Grant from the European Research Council (ERC) under the European Union’s Horizon 2020 research and innovation programme (Grant agreement No. 78905). R. J. A. was supported by FONDECYT grant number 1231718. H.I. acknowledges support from JSPS KAKENHI Grant Number JP21H01129 and the Ito Foundation for Promotion of Science. R. L. D is supported by the Australian Research Council through the Discovery Early Career Researcher Award (DECRA) Fellowship DE240100136 funded by the Australian Government.
References
- Alarie, A., & Morisset, C. 2019, Rev. Mex. Astron. Astrofis., 55, 377 [Google Scholar]
- Allen, M. G., Groves, B. A., Dopita, M. A., Sutherland, R. S., & Kewley, L. J. 2008, ApJS, 178, 20 [Google Scholar]
- Andonie, C., Alexander, D. M., Greenwell, C., et al. 2024, MNRAS, 527, L144 [Google Scholar]
- Apostolovski, Y., Aravena, M., Anguita, T., et al. 2024, A&A, 683, A64 [NASA ADS] [CrossRef] [EDP Sciences] [Google Scholar]
- Bagley, M. B., Finkelstein, S. L., Koekemoer, A. M., et al. 2023, ApJ, 946, L12 [NASA ADS] [CrossRef] [Google Scholar]
- Baldwin, J. A., Phillips, M. M., & Terlevich, R. 1981, PASP, 93, 5 [Google Scholar]
- Barrows, R. S., Comerford, J. M., Greene, J. E., & Pooley, D. 2017, ApJ, 838, 129 [NASA ADS] [CrossRef] [Google Scholar]
- Barth, A. J., Bentz, M. C., Greene, J. E., & Ho, L. C. 2008, ApJ, 683, L119 [NASA ADS] [CrossRef] [Google Scholar]
- Baugh, C. M., Cole, S., Frenk, C. S., & Lacey, C. G. 1998, ApJ, 498, 504 [NASA ADS] [CrossRef] [Google Scholar]
- Berney, S., Koss, M., Trakhtenbrot, B., et al. 2015, MNRAS, 454, 3622 [CrossRef] [Google Scholar]
- Borisova, E., Cantalupo, S., Lilly, S. J., et al. 2016, ApJ, 831, 39 [Google Scholar]
- Cai, Z., Fan, X., Yang, Y., et al. 2017, ApJ, 837, 71 [NASA ADS] [CrossRef] [Google Scholar]
- Calzetti, D., Armus, L., Bohlin, R. C., et al. 2000, ApJ, 533, 682 [NASA ADS] [CrossRef] [Google Scholar]
- Capak, P., Carilli, C. L., Lee, N., et al. 2008, ApJ, 681, L53 [Google Scholar]
- Cappellari, M. 2017, MNRAS, 466, 798 [Google Scholar]
- Cappellari, M. 2023, MNRAS, 526, 3273 [NASA ADS] [CrossRef] [Google Scholar]
- Carilli, C. L., Lee, N., Capak, P., et al. 2008, ApJ, 689, 883 [NASA ADS] [CrossRef] [Google Scholar]
- Casey, C. M. 2016, ApJ, 824, 36 [CrossRef] [Google Scholar]
- Casey, C. M., Kartaltepe, J. S., Drakos, N. E., et al. 2023, ApJ, 954, 31 [NASA ADS] [CrossRef] [Google Scholar]
- Cavanaugh, J. E. 1997, Stat. Probabil. Lett., 33, 201 [CrossRef] [Google Scholar]
- Chapman, S. C., Hill, R., Aravena, M., et al. 2024, ApJ, 961, 120 [NASA ADS] [CrossRef] [Google Scholar]
- Cleri, N. J., Olivier, G. M., Hutchison, T. A., et al. 2023, ApJ, 953, 10 [NASA ADS] [CrossRef] [Google Scholar]
- Comerford, J. M., Pooley, D., Barrows, R. S., et al. 2015, ApJ, 806, 219 [Google Scholar]
- Conroy, C., & Gunn, J. E. 2010, ApJ, 712, 833 [Google Scholar]
- Conroy, C., Gunn, J. E., & White, M. 2009, ApJ, 699, 486 [Google Scholar]
- Decarli, R., Mignoli, M., Gilli, R., et al. 2019, A&A, 631, L10 [NASA ADS] [CrossRef] [EDP Sciences] [Google Scholar]
- Decarli, R., Loiacono, F., Farina, E. P., et al. 2024, A&A, 689, A219 [NASA ADS] [CrossRef] [EDP Sciences] [Google Scholar]
- D’Eugenio, F., Maiolino, R., Mahatma, V. H., et al. 2025, MNRAS, 536, 51 [Google Scholar]
- Dopita, M. A., Kewley, L. J., Sutherland, R. S., & Nicholls, D. C. 2016, Ap&SS, 361, 61 [NASA ADS] [CrossRef] [Google Scholar]
- Elvis, M., Civano, F., Vignali, C., et al. 2009, ApJS, 184, 158 [Google Scholar]
- Emonts, B. H. C., Lehnert, M. D., Dannerbauer, H., et al. 2018, MNRAS, 477, L60 [NASA ADS] [CrossRef] [Google Scholar]
- Emonts, B. H. C., Lehnert, M. D., Yoon, I., et al. 2023, Science, 379, 1323 [NASA ADS] [CrossRef] [Google Scholar]
- Fraternali, F., Karim, A., Magnelli, B., et al. 2021, A&A, 647, A194 [NASA ADS] [CrossRef] [EDP Sciences] [Google Scholar]
- Gerke, B. F., Newman, J. A., Lotz, J., et al. 2007, ApJ, 660, L23 [NASA ADS] [CrossRef] [Google Scholar]
- Gilli, R., Vignali, C., Mignoli, M., et al. 2010, A&A, 519, A92 [NASA ADS] [CrossRef] [EDP Sciences] [Google Scholar]
- Gómez-Guijarro, C., Toft, S., Karim, A., et al. 2018, ApJ, 856, 121 [Google Scholar]
- Guaita, L., Aravena, M., Gurung-Lopez, S., et al. 2022, A&A, 660, A137 [NASA ADS] [CrossRef] [EDP Sciences] [Google Scholar]
- Harikane, Y., Zhang, Y., Nakajima, K., et al. 2023, ApJ, 959, 39 [NASA ADS] [CrossRef] [Google Scholar]
- Hennawi, J. F., Prochaska, J. X., Cantalupo, S., & Arrigoni-Battaia, F. 2015, Science, 348, 779 [Google Scholar]
- Hill, R., Chapman, S., Scott, D., et al. 2020, MNRAS, 495, 3124 [NASA ADS] [CrossRef] [Google Scholar]
- Ho, I. T., Kewley, L. J., Dopita, M. A., et al. 2014, MNRAS, 444, 3894 [Google Scholar]
- Hopkins, P. F., Hernquist, L., Cox, T. J., & Kereš, D. 2008, ApJS, 175, 356 [Google Scholar]
- Izotov, Y. I., Thuan, T. X., & Privon, G. 2012, MNRAS, 427, 1229 [NASA ADS] [CrossRef] [Google Scholar]
- Jiménez-Andrade, E. F., Cantalupo, S., Magnelli, B., et al. 2023, MNRAS, 521, 2326 [CrossRef] [Google Scholar]
- Józsa, G. I. G., Garrett, M. A., Oosterloo, T. A., et al. 2009, A&A, 500, L33 [NASA ADS] [CrossRef] [EDP Sciences] [Google Scholar]
- Kewley, L. J., Dopita, M. A., Sutherland, R. S., Heisler, C. A., & Trevena, J. 2001, ApJ, 556, 121 [Google Scholar]
- Kewley, L. J., Groves, B., Kauffmann, G., & Heckman, T. 2006, MNRAS, 372, 961 [Google Scholar]
- Kewley, L. J., Nicholls, D. C., & Sutherland, R. S. 2019, ARA&A, 57, 511 [Google Scholar]
- Kikuta, S., Matsuda, Y., Cen, R., et al. 2019, PASJ, 71, L2 [Google Scholar]
- Koposov, S., Speagle, J., Barbary, K., et al. 2022, https://doi.org/10.5281/zenodo.7388523 [Google Scholar]
- Koss, M., Mushotzky, R., Treister, E., et al. 2012, ApJ, 746, L22 [Google Scholar]
- Lemaux, B. C., Le Fèvre, O., Cucciati, O., et al. 2018, A&A, 615, A77 [NASA ADS] [CrossRef] [EDP Sciences] [Google Scholar]
- Leung, G. C. K., Coil, A. L., Rupke, D. S. N., & Perrotta, S. 2021, ApJ, 914, 17 [NASA ADS] [CrossRef] [Google Scholar]
- Lintott, C. J., Schawinski, K., Keel, W., et al. 2009, MNRAS, 399, 129 [NASA ADS] [CrossRef] [Google Scholar]
- Maiolino, R., Scholtz, J., Curtis-Lake, E., et al. 2024, A&A, 691, A145 [NASA ADS] [CrossRef] [EDP Sciences] [Google Scholar]
- Mazzarella, J. M., Iwasawa, K., Vavilkin, T., et al. 2012, AJ, 144, 125 [Google Scholar]
- Mazzolari, G., Übler, H., Maiolino, R., et al. 2024, A&A, 691, A345 [NASA ADS] [CrossRef] [EDP Sciences] [Google Scholar]
- McCarthy, P. J., Spinrad, H., Djorgovski, S., et al. 1987, ApJ, 319, L39 [NASA ADS] [CrossRef] [Google Scholar]
- Mignoli, M., Vignali, C., Gilli, R., et al. 2013, A&A, 556, A29 [NASA ADS] [CrossRef] [EDP Sciences] [Google Scholar]
- Miley, G., & De Breuck, C. 2008, A&ARv, 15, 67 [Google Scholar]
- Miller, T. B., Chapman, S. C., Aravena, M., et al. 2018, Nature, 556, 469 [CrossRef] [Google Scholar]
- Monson, E. B., Doore, K., Eufrasio, R. T., et al. 2023, ApJ, 951, 15 [NASA ADS] [CrossRef] [Google Scholar]
- Nesvadba, N. P. H., De Breuck, C., Lehnert, M. D., Best, P. N., & Collet, C. 2017, A&A, 599, A123 [NASA ADS] [CrossRef] [EDP Sciences] [Google Scholar]
- Nightingale, J., Hayes, R., & Griffiths, M. 2021, J. Open Source Softw., 6, 2550 [NASA ADS] [CrossRef] [Google Scholar]
- Noirot, G., Stern, D., Mei, S., et al. 2018, ApJ, 859, 38 [NASA ADS] [CrossRef] [Google Scholar]
- Oteo, I., Ivison, R. J., Dunne, L., et al. 2018, ApJ, 856, 72 [Google Scholar]
- Overzier, R. A. 2016, A&ARv, 24, 14 [Google Scholar]
- Overzier, R. A., Nesvadba, N. P. H., Dijkstra, M., et al. 2013, ApJ, 771, 89 [NASA ADS] [CrossRef] [Google Scholar]
- Pacucci, F., Nguyen, B., Carniani, S., Maiolino, R., & Fan, X. 2023, ApJ, 957, L3 [CrossRef] [Google Scholar]
- Pérez-González, P. G., D’Eugenio, F., Rodríguez del Pino, B., et al. 2024, arXiv e-prints [arXiv:2405.03744] [Google Scholar]
- Perna, M., Arribas, S., Marshall, M., et al. 2023, A&A, 679, A89 [NASA ADS] [CrossRef] [EDP Sciences] [Google Scholar]
- Reines, A. E., & Volonteri, M. 2015, ApJ, 813, 82 [NASA ADS] [CrossRef] [Google Scholar]
- Reuland, M., van Breugel, W., Röttgering, H., et al. 2003, ApJ, 592, 755 [CrossRef] [Google Scholar]
- Rich, J. A., Kewley, L. J., & Dopita, M. A. 2011, ApJ, 734, 87 [NASA ADS] [CrossRef] [Google Scholar]
- Rich, J. A., Kewley, L. J., & Dopita, M. A. 2015, ApJS, 221, 28 [Google Scholar]
- Riechers, D. A., Carilli, C. L., Capak, P. L., et al. 2014, ApJ, 796, 84 [Google Scholar]
- Rigby, J. R., Vieira, J. D., Phadke, K. A., et al. 2023, arXiv e-prints [arXiv:2312.10465] [Google Scholar]
- Roy, N., Heckman, T., Overzier, R., et al. 2024, ApJ, 970, 69 [NASA ADS] [CrossRef] [Google Scholar]
- Saxena, A., Overzier, R. A., Villar-Martín, M., et al. 2024, MNRAS, 531, 4391 [CrossRef] [Google Scholar]
- Schaerer, D., Fragos, T., & Izotov, Y. I. 2019, A&A, 622, L10 [NASA ADS] [CrossRef] [EDP Sciences] [Google Scholar]
- Schawinski, K., Thomas, D., Sarzi, M., et al. 2007, MNRAS, 382, 1415 [Google Scholar]
- Scholtz, J., Maiolino, R., D’Eugenio, F., et al. 2023, A&A, submitted [Google Scholar]
- Schwarz, G. 1978, Ann. Stat., 6, 461 [Google Scholar]
- Secrest, N. J., Schmitt, H. R., Blecha, L., Rothberg, B., & Fischer, J. 2017, ApJ, 836, 183 [NASA ADS] [CrossRef] [Google Scholar]
- Shen, Y., Strauss, M. A., Oguri, M., et al. 2007, AJ, 133, 2222 [NASA ADS] [CrossRef] [Google Scholar]
- Shirazi, M., & Brinchmann, J. 2012, MNRAS, 421, 1043 [NASA ADS] [CrossRef] [Google Scholar]
- Smith, D. J. B., Krause, M. G., Hardcastle, M. J., & Drake, A. B. 2022, MNRAS, 514, 3879 [CrossRef] [Google Scholar]
- Smolčić, V., Karim, A., Miettinen, O., et al. 2015, A&A, 576, A127 [NASA ADS] [CrossRef] [EDP Sciences] [Google Scholar]
- Smolčić, V., Miettinen, O., Tomičić, N., et al. 2017a, A&A, 597, A4 [NASA ADS] [CrossRef] [EDP Sciences] [Google Scholar]
- Smolčić, V., Novak, M., Delvecchio, I., et al. 2017b, A&A, 602, A6 [NASA ADS] [CrossRef] [EDP Sciences] [Google Scholar]
- Solimano, M., González-López, J., Aravena, M., et al. 2024, A&A, 689, A145 [NASA ADS] [CrossRef] [EDP Sciences] [Google Scholar]
- Speagle, J. S. 2020, MNRAS, 493, 3132 [Google Scholar]
- Staab, P., Lemaux, B. C., Forrest, B., et al. 2024, MNRAS, 528, 6934 [NASA ADS] [CrossRef] [Google Scholar]
- Stockton, A., Fu, H., & Canalizo, G. 2006, New Astron. Rev., 50, 694 [CrossRef] [Google Scholar]
- Storey, P. J., & Zeippen, C. J. 2000, MNRAS, 312, 813 [NASA ADS] [CrossRef] [Google Scholar]
- Swinbank, A. M., Vernet, J. D. R., Smail, I., et al. 2015, MNRAS, 449, 1298 [NASA ADS] [CrossRef] [Google Scholar]
- Übler, H., Maiolino, R., Pérez-González, P. G., et al. 2024, MNRAS, 531, 355 [CrossRef] [Google Scholar]
- Umehata, H., Smail, I., Steidel, C. C., et al. 2021, ApJ, 918, 69 [NASA ADS] [CrossRef] [Google Scholar]
- Veilleux, S., & Osterbrock, D. E. 1987, ApJS, 63, 295 [Google Scholar]
- Venemans, B. P., Röttgering, H. J. A., Miley, G. K., et al. 2007, A&A, 461, 823 [NASA ADS] [CrossRef] [EDP Sciences] [Google Scholar]
- Vito, F., Brandt, W. N., Lehmer, B. D., et al. 2020, A&A, 642, A149 [NASA ADS] [CrossRef] [EDP Sciences] [Google Scholar]
- Vito, F., Brandt, W. N., Comastri, A., et al. 2024, A&A, 689, A130 [NASA ADS] [CrossRef] [EDP Sciences] [Google Scholar]
- Wang, G. C. P., Hill, R., Chapman, S. C., et al. 2021, MNRAS, 508, 3754 [NASA ADS] [CrossRef] [Google Scholar]
- Wang, W., Wylezalek, D., De Breuck, C., et al. 2024, A&A, 683, A169 [NASA ADS] [CrossRef] [EDP Sciences] [Google Scholar]
- Weaver, J. R., Kauffmann, O. B., Ilbert, O., et al. 2022, ApJS, 258, 11 [NASA ADS] [CrossRef] [Google Scholar]
- Wylezalek, D., Galametz, A., Stern, D., et al. 2013, ApJ, 769, 79 [NASA ADS] [CrossRef] [Google Scholar]
- Wylezalek, D., Vayner, A., Rupke, D. S. N., et al. 2022, ApJ, 940, L7 [NASA ADS] [CrossRef] [Google Scholar]
Appendix A: Line fitting with pPXF
We use the template-fitting software pPXF (version 9.2.1; Cappellari 2017, 2023) to simultaneously model the continuum and the emission lines of our aperture-extracted spectra in the full wavelength range covered by a single grating. We start with the G395H grating since it provides better spectral resolution than G235M. For each spectrum, we perform perform fits with one and two velocity components for the emission lines, but a single component for the stars, which is tied to the narrow gas component. We include the following lines in the fit: He Iλ 5877, [O I] λλ 6303,6365, [N II] λλ 6550,6585, H Iλ 6565 (Hα), [S II] λλ 6718,6732, He Iλ 7065, [Ar III] λ 7138, and [S III] λ 9071, where the [O I] and [N II] doublet ratios have been fixed to their theoretical values. The continuum is fitted against a grid of Stellar Population Synthesis (SPS) spectra computed with fsps v3.2 (Conroy et al. 2009; Conroy & Gunn 2010), but restricted to ages younger than the age of the Universe at z = 4.54. In most cases, the continuum has S/N≲1 per resolution element and no stellar absorption features can be identified, hence we refrain from interpreting any of the SPS output parameters. We find, nevertheless, that these templates provide a good representation of the continuum slope, and naturally incorporate the stellar absorption correction for the Balmer emission lines, even though this correction always stays below 1%.
We then compute the AIC and BIC scores of both single and double component fits, and require the score difference to be larger than five to keep the double component fit as the preferred model. This criterion is only met for O3-N and O3-N-core.
Next, we model the G235M spectrum using the velocity and velocity dispersion best fit values from the G395H fit as starting values. Here, we fit the continuum with the same libraries as above, and include the following list of emission lines: [Ne V] λ 3427, [O II] λλ 3727,3730, [Ne III] λ 3870, [Ne III] λ 3969, [O III] λ 4364, He IIλ 4687, [O III] λλ 4960,5008, and the Balmer series from H Iλ 3799 (H10) to H Iλ 4863 (Hβ). The relative intensities of the [O III] doublet are fixed to their theoretical ratio.
Throughout the paper, we use the line fluxes and uncertainties measured by pPXF to compute line ratios. The values are presented in Table C.1 and represent model fluxes from the single Gaussian component fits, except for O3-N and O3-N-core, where we use the sum of the narrow and broad components. This is because in most lines of the broad component have too low a S/N to provide a meaningful ratio on their own. We also quote fluxes and ratios without correction by reddening unless otherwise noted.
Appendix B: Double Gaussian fitting
In this appendix we describe the method used to fit the line profiles presented in Sect. 3.2. In the case of [O III], we model both lines in the doublet simultaneously but tie their wavelengths and amplitudes to the expected ratios (e.g., [O III] λ 5008 /[O III] λ 4960 = 2.98, Storey & Zeippen 2000). For Hα, we also fit the N II doublet with the [N II] λ 6585 /[N II] λ 6550 ratio fixed to 2.8. We set up the models within the probabilistic programming framework PYAUTOFIT (version 2024.1.27.4, Nightingale et al. 2021), and use the DYNESTY (Speagle 2020; Koposov et al. 2022) backend to sample the posterior probability distribution and estimate the Bayesian evidence log(Z). The width of the line spread function (LSF) is taken from the dispersion curves available in the JWST documentation5.
Appendix C: Faint lines
In this appendix we plot spectral cutouts of O3-N-core (Fig. C.1) and O3-S-HeII (Fig. C.2) around two high-ionization lines (He II and [Ne II]) plus the [O III] λ 4364 auroral line.
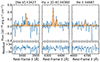 |
Fig. C.1. Zoom-in to high-ionization lines detected in O3-N-core. The orange filled curve denotes the pPXF best fit stellar plus gaseous template. |
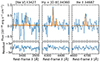 |
Fig. C.2. Same as Fig. C.1 but for O3-S-HeII. Here, the detection of the [Ne V] line is only tentative. |
Line fluxes for the different apertures used in this paper.
All Tables
All Figures
|
Fig. 1. Multiwavelength view of the J1000+0234 system at z = 4.54. Left panel: Color composite image of the J1000+0234 system as seen by JWST/NIRCam. The filters F356W, F277W, and F200W are mapped to the red, green, and blue channels, respectively. The F277W filter captures the Hβ +[O III] emission at z = 4.54. Magenta regions indicate the apertures used in this paper. The gray dashed contour delineates the [C II] plume detected with ALMA (Solimano et al. 2024). The blue arrow points to a foreground galaxy at zspec = 1.41 (Capak et al. 2008). Middle panel: NIRCam F444W image with contours of the [O III] emission detected in the NIRSpec G235M observations. Contours start at 2σ = 3.3 × 10⁻¹⁷ erg s−1 cm−2 arcsec−2 and increase as integer powers of 2. The blue and red solid regions show the footprint of the observations obtained with G235M and G395H gratings, respectively. The green circle in the bottom right corner indicates the angular resolution element. Right panel: NIRCam F277W image with ±3, 4, 5, and 6σ contours from Very Large Array (VLA) S-band continuum (red), and {1,5,16,30} × 10−18 erg s−1 cm−2 arcsec−2 contours of Lyα emission (blue) from VLT/MUSE (Jiménez-Andrade et al. 2023; Solimano et al. 2024). Blue and red circles indicate the angular resolutions of the MUSE and VLA datasets, respectively. |
| In the text | |
|
Fig. 2. Resolved [O III] kinematics of J1000+0234. Velocity field (left) and velocity dispersion (right) maps. The reference velocity is defined at z = 4.5471. |
| In the text | |
|
Fig. 3. Evidence of a broad velocity component in the strongest emission lines from O3-N, namely [O III] λλ 4960,5008 (left) and Hα +[N II] λλ 6550,6585 (right). In both lines, a double Gaussian profile is preferred over a single Gaussian fit (not shown), based on the former having a larger log(Z), and lower AIC and BIC scores (see upper right legends). The bottom panels show the residuals of the subtraction of the best-fit model from the data, in units of σ. |
| In the text | |
|
Fig. 4. Same as Fig. 3 but for O3-S. Here, both components have similar line width, in contrast with the expectations for an outflow. |
| In the text | |
|
Fig. 5. Diagnostic line ratio diagrams for the relevant regions of the J1000+0234 system. Bottom left: Standard BPT R3 vs. N2 diagram. The solid curved lines represent the maximum starburst line of Kewley et al. (2001), while the straight dashed line on the lower right-hand side divides AGN from LINERs according to Schawinski et al. (2007). The dotted line is the separation from SF and AGN adapted for high-z galaxies by Scholtz et al. (2023). Bottom center: R3 vs. S2 VO87 diagram. Again, the solid line is from Kewley et al. (2001) and the dotted line is the high-z SF/AGN separation from Scholtz et al. (2023) Bottom right: R3 vs. O1 VO87 diagram. The solid line separates SF from AGN according to Kewley et al. (2001). Top left: He2 vs. N2 diagram. The division line between AGN and SF is taken from Shirazi & Brinchmann (2012). |
| In the text | |
|
Fig. 6. Diagnostic line-ratio diagrams based on [O III] λ 4364 emission. In all three panels the dashed line is the empirical demarcation between pure AGN and AGN/SF mixtures proposed by Mazzolari et al. (2024). The faded markers with error bars are determined from our pPXF fits to the spectra without reddening correction. The bold markers show the values after reddening correction, with AV = 1.58 ± 0.16 mag for O3-N-core and AV = 0 mag for O3-S-HeII. The black arrows denote the dereddening vector for an attenuation of AV = 1 mag with the Calzetti et al. (2000) attenuation law. |
| In the text | |
|
Fig. 7. Oxygen abundances of the sources in the J1000+0234 system according to the Dopita et al. (2016) calibration. Markers are the same as in Fig. 5, except we also show C01-NE and C01-SW. |
| In the text | |
|
Fig. 8. Resolved N2 ratio as a function of line velocity dispersion in O3-S (left) and O3-N (right). The inset text displays the Spearman’s rank correlation coefficient r and its corresponding p-value. No significant correlation is present in either panel. |
| In the text | |
|
Fig. C.1. Zoom-in to high-ionization lines detected in O3-N-core. The orange filled curve denotes the pPXF best fit stellar plus gaseous template. |
| In the text | |
|
Fig. C.2. Same as Fig. C.1 but for O3-S-HeII. Here, the detection of the [Ne V] line is only tentative. |
| In the text | |
Current usage metrics show cumulative count of Article Views (full-text article views including HTML views, PDF and ePub downloads, according to the available data) and Abstracts Views on Vision4Press platform.
Data correspond to usage on the plateform after 2015. The current usage metrics is available 48-96 hours after online publication and is updated daily on week days.
Initial download of the metrics may take a while.