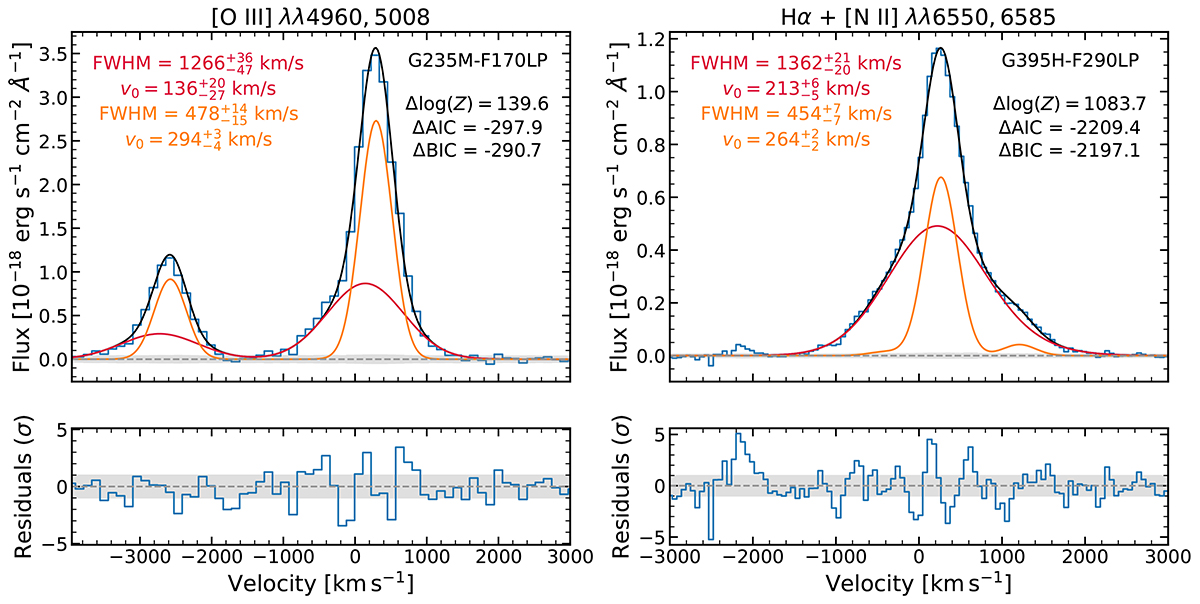
Fig. 3.
Download original image
Evidence of a broad velocity component in the strongest emission lines from O3-N, namely [O III] λλ 4960,5008 (left) and Hα +[N II] λλ 6550,6585 (right). In both lines, a double Gaussian profile is preferred over a single Gaussian fit (not shown), based on the former having a larger log(Z), and lower AIC and BIC scores (see upper right legends). The bottom panels show the residuals of the subtraction of the best-fit model from the data, in units of σ.
Current usage metrics show cumulative count of Article Views (full-text article views including HTML views, PDF and ePub downloads, according to the available data) and Abstracts Views on Vision4Press platform.
Data correspond to usage on the plateform after 2015. The current usage metrics is available 48-96 hours after online publication and is updated daily on week days.
Initial download of the metrics may take a while.