Fig. 6.
Download original image
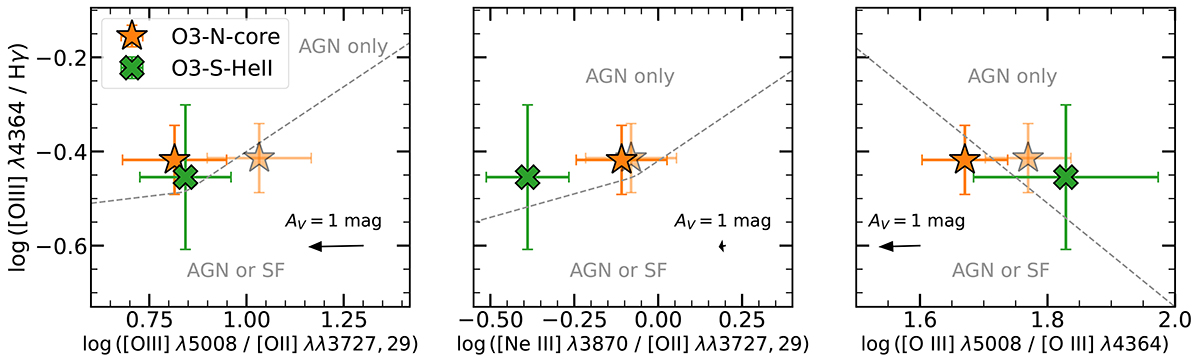
Diagnostic line-ratio diagrams based on [O III] λ 4364 emission. In all three panels the dashed line is the empirical demarcation between pure AGN and AGN/SF mixtures proposed by Mazzolari et al. (2024). The faded markers with error bars are determined from our pPXF fits to the spectra without reddening correction. The bold markers show the values after reddening correction, with AV = 1.58 ± 0.16 mag for O3-N-core and AV = 0 mag for O3-S-HeII. The black arrows denote the dereddening vector for an attenuation of AV = 1 mag with the Calzetti et al. (2000) attenuation law.
Current usage metrics show cumulative count of Article Views (full-text article views including HTML views, PDF and ePub downloads, according to the available data) and Abstracts Views on Vision4Press platform.
Data correspond to usage on the plateform after 2015. The current usage metrics is available 48-96 hours after online publication and is updated daily on week days.
Initial download of the metrics may take a while.