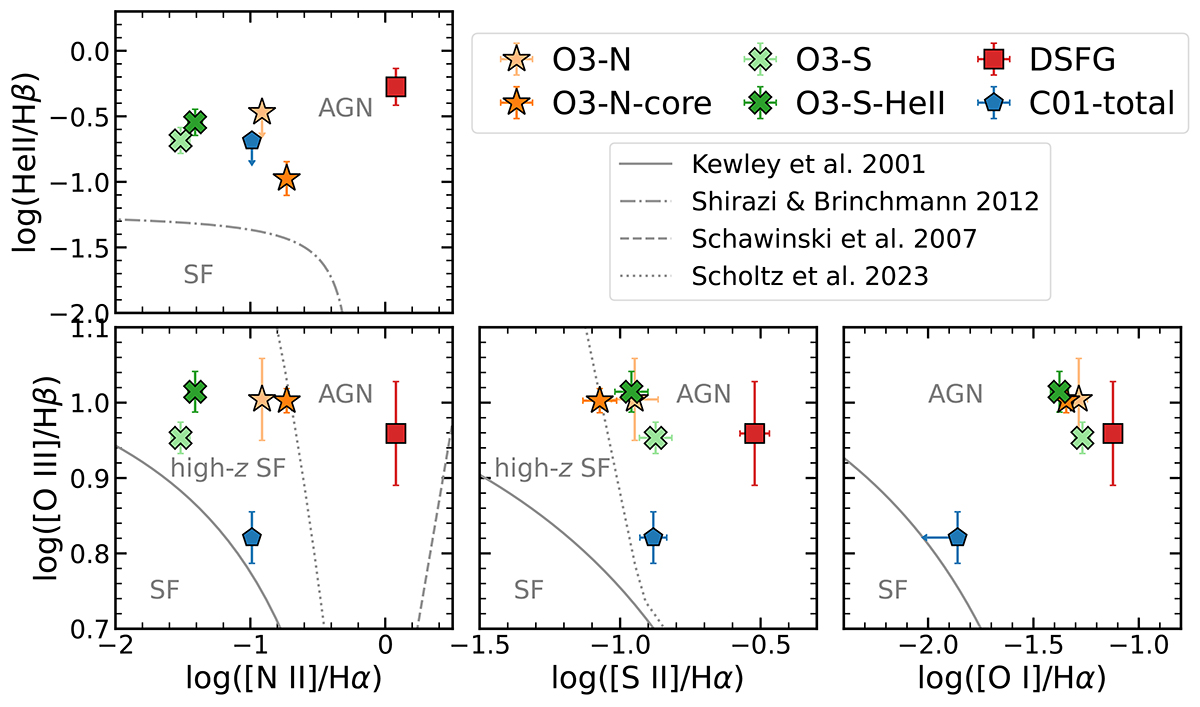
Fig. 5.
Download original image
Diagnostic line ratio diagrams for the relevant regions of the J1000+0234 system. Bottom left: Standard BPT R3 vs. N2 diagram. The solid curved lines represent the maximum starburst line of Kewley et al. (2001), while the straight dashed line on the lower right-hand side divides AGN from LINERs according to Schawinski et al. (2007). The dotted line is the separation from SF and AGN adapted for high-z galaxies by Scholtz et al. (2023). Bottom center: R3 vs. S2 VO87 diagram. Again, the solid line is from Kewley et al. (2001) and the dotted line is the high-z SF/AGN separation from Scholtz et al. (2023) Bottom right: R3 vs. O1 VO87 diagram. The solid line separates SF from AGN according to Kewley et al. (2001). Top left: He2 vs. N2 diagram. The division line between AGN and SF is taken from Shirazi & Brinchmann (2012).
Current usage metrics show cumulative count of Article Views (full-text article views including HTML views, PDF and ePub downloads, according to the available data) and Abstracts Views on Vision4Press platform.
Data correspond to usage on the plateform after 2015. The current usage metrics is available 48-96 hours after online publication and is updated daily on week days.
Initial download of the metrics may take a while.