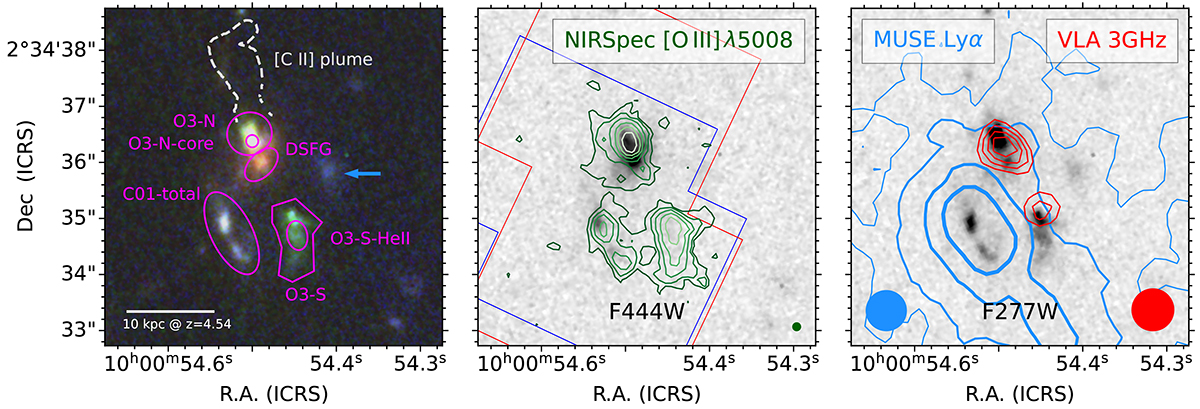
Fig. 1.
Download original image
Multiwavelength view of the J1000+0234 system at z = 4.54. Left panel: Color composite image of the J1000+0234 system as seen by JWST/NIRCam. The filters F356W, F277W, and F200W are mapped to the red, green, and blue channels, respectively. The F277W filter captures the Hβ +[O III] emission at z = 4.54. Magenta regions indicate the apertures used in this paper. The gray dashed contour delineates the [C II] plume detected with ALMA (Solimano et al. 2024). The blue arrow points to a foreground galaxy at zspec = 1.41 (Capak et al. 2008). Middle panel: NIRCam F444W image with contours of the [O III] emission detected in the NIRSpec G235M observations. Contours start at 2σ = 3.3 × 10⁻¹⁷ erg s−1 cm−2 arcsec−2 and increase as integer powers of 2. The blue and red solid regions show the footprint of the observations obtained with G235M and G395H gratings, respectively. The green circle in the bottom right corner indicates the angular resolution element. Right panel: NIRCam F277W image with ±3, 4, 5, and 6σ contours from Very Large Array (VLA) S-band continuum (red), and {1,5,16,30} × 10−18 erg s−1 cm−2 arcsec−2 contours of Lyα emission (blue) from VLT/MUSE (Jiménez-Andrade et al. 2023; Solimano et al. 2024). Blue and red circles indicate the angular resolutions of the MUSE and VLA datasets, respectively.
Current usage metrics show cumulative count of Article Views (full-text article views including HTML views, PDF and ePub downloads, according to the available data) and Abstracts Views on Vision4Press platform.
Data correspond to usage on the plateform after 2015. The current usage metrics is available 48-96 hours after online publication and is updated daily on week days.
Initial download of the metrics may take a while.