| Issue |
A&A
Volume 576, April 2015
|
|
|---|---|---|
| Article Number | A109 | |
| Number of page(s) | 29 | |
| Section | Interstellar and circumstellar matter | |
| DOI | https://doi.org/10.1051/0004-6361/201424538 | |
| Published online | 10 April 2015 | |
Online material
Appendix A: Additional material
Integration limits and contour levels.
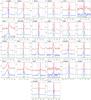 |
Fig. A.1
CO 3−2 spectra with selected integration limits indicated, except for Ced110 IRS4, BHR71, and DK Cha where CO 6−5 was used. Each panel presents these limits for each source. The black spectrum at the bottom is taken from a clean position representative for the envelope emission. The blue spectrum at the middle is the representative spectrum from the blue outflow lobe, and red spectrum at the top is the representative spectrum from the red outflow lobe. Each panel shows five vertical lines, these are VLSR (black dashed line), Vout,blue (dot-dash blue line), Vin,blue (dashed blue line), Vin,red (dashed red line), and Vout,red (dot-dash red line). |
| Open with DEXTER | |
|
Fig. A.2
Each row contains contour and integrated intensity maps (in K km s-1) of sources in 12CO 6−5 and 3−2. The contour levels and integration limits are given in Table A.1 and integration limits shown in Fig. A.1. The color images show all emission integrated from Vout,red to Vout,blue, including any minor cloud contribution. |
|
| Open with DEXTER | |
|
Fig. A.2
continued. |
|
| Open with DEXTER | |
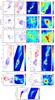 |
Fig. A.2
continued. |
| Open with DEXTER | |
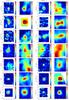 |
Fig. A.3
13CO 6−5 and 3−2 integrated intensity maps of the sources (in K km s-1). |
| Open with DEXTER | |
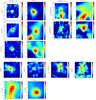 |
Fig. A.3
continued. |
| Open with DEXTER | |
|
Fig. A.4
Correlations between FCO as measured from CO 3−2 and bolometric luminosity, envelope mass and outflow mass as determined from CO 3−2. |
|
| Open with DEXTER | |
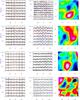 |
Fig. A.5
7 × 7 pixel fully sampled maps are extracted toward the central positions of the sources in 13CO 6−5 (left) and in 12CO 6−5 (middle) transitions. The axes represent the equatorial offsets (Δα, Δδ) in arcsec. The main beam temperature intensity scale of each box are shown in the y-axes of the bottom-left box in Kelvins. The velocity range in each box is ±8 km s-1 for the 13CO spectra, and ±25 km s-1 for the 12CO spectra. The red lines in the left-hand panels are the 13CO 6−5 model line intensities for the passively heated envelope. The excess emission in the observations compared with these model profiles corresponds to the UV-heated gas and is shown as an image in the right panel with the intensity scale in K km s-1. The middle and right panels contain the red and blue outflow lobes with the contour levels given in Table A.1. The blue and red arrows in the right-hand panels show the direction of the outflow lobes. |
| Open with DEXTER | |
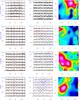 |
Fig. A.5
continued. |
| Open with DEXTER | |
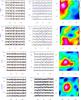 |
Fig. A.5
continued. |
| Open with DEXTER | |
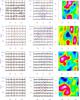 |
Fig. A.5
continued. |
| Open with DEXTER | |
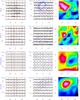 |
Fig. A.5
continued. |
| Open with DEXTER | |
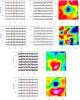 |
Fig. A.6
Same as Fig. A.5. 12CO 6−5 transitions were not observed for L1448MM and L1551 IRS5 in our observing campaign, therefore left blank. |
| Open with DEXTER | |
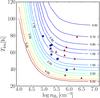 |
Fig. A.7
13CO 3−2/6−5 intensity ratio as a function of density and gas temperature calculated via RADEX for N(13CO) = 1.5 × 1014 cm-2. Red markers indicate the observed intensity ratios for the central pixels for Class 0 sources whereas blue markers are for Class I sources. Both pixels are taken to be 15″ diameter. The corresponding densities are the values at the 7.5″ radius found in the power-law envelope models of Kristensen et al. (2012). |
| Open with DEXTER | |
© ESO, 2015
Current usage metrics show cumulative count of Article Views (full-text article views including HTML views, PDF and ePub downloads, according to the available data) and Abstracts Views on Vision4Press platform.
Data correspond to usage on the plateform after 2015. The current usage metrics is available 48-96 hours after online publication and is updated daily on week days.
Initial download of the metrics may take a while.