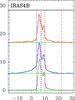
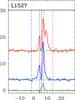
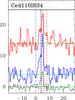
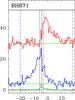
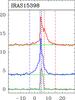
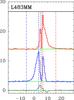
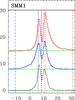
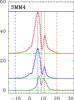
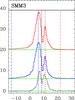
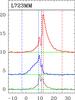
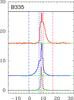
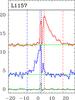
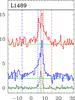
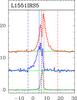
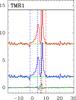
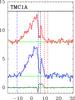
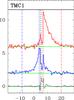
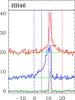
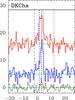
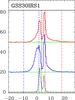
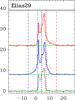
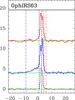
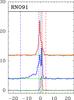
Fig. A.1
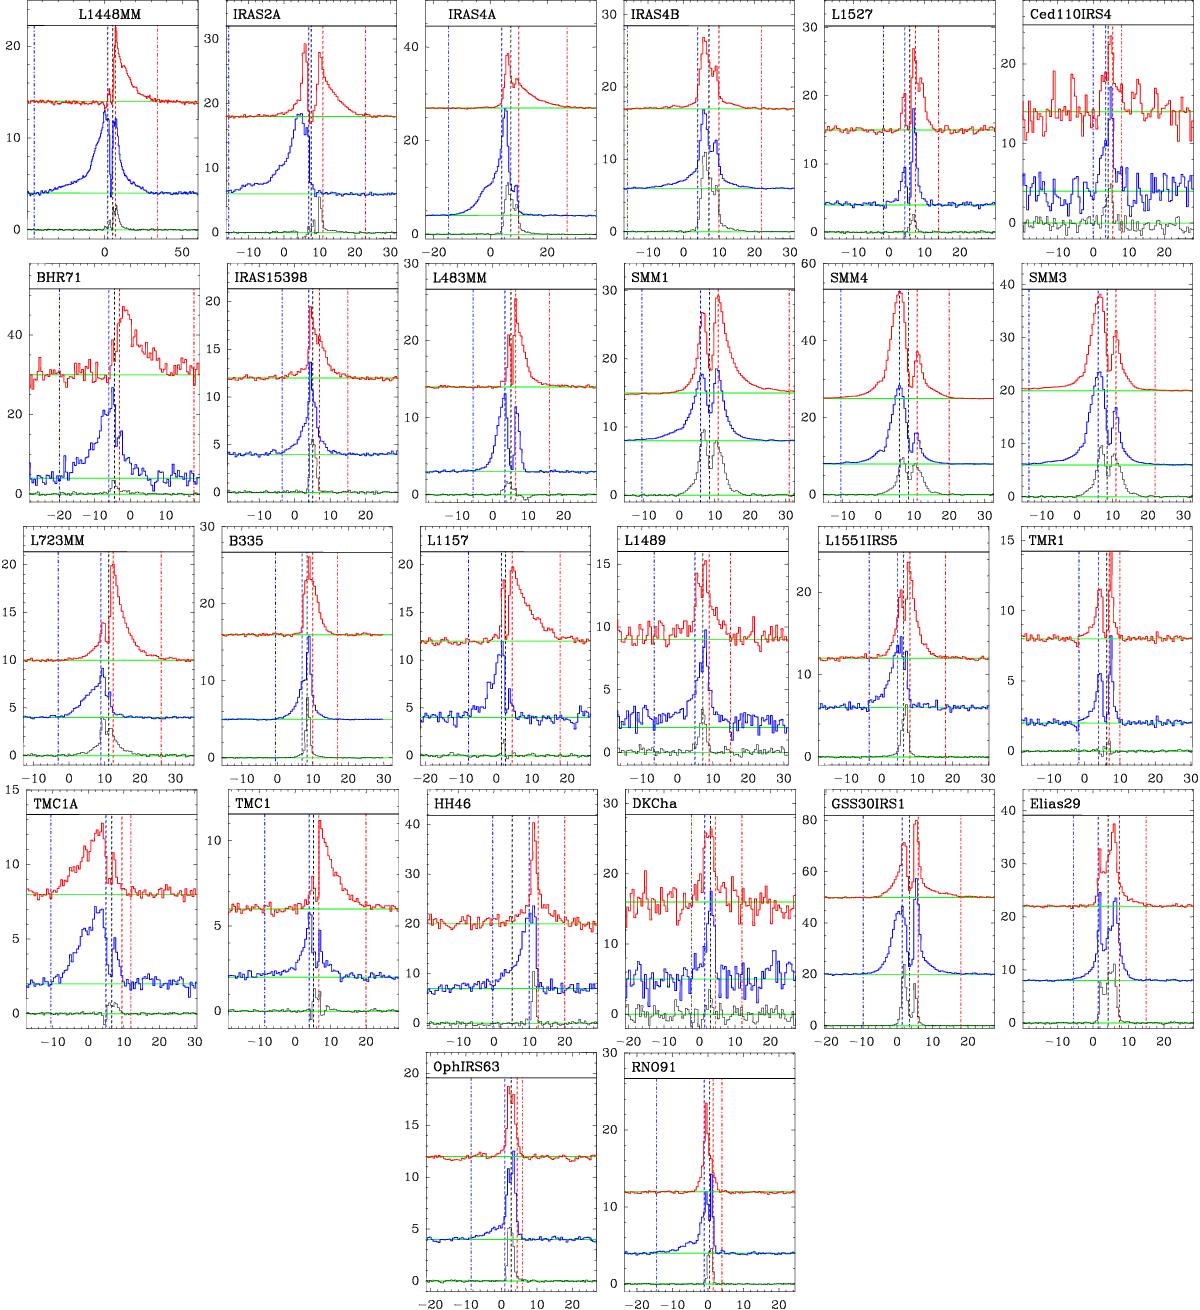
CO 3−2 spectra with selected integration limits indicated, except for Ced110 IRS4, BHR71, and DK Cha where CO 6−5 was used. Each panel presents these limits for each source. The black spectrum at the bottom is taken from a clean position representative for the envelope emission. The blue spectrum at the middle is the representative spectrum from the blue outflow lobe, and red spectrum at the top is the representative spectrum from the red outflow lobe. Each panel shows five vertical lines, these are VLSR (black dashed line), Vout,blue (dot-dash blue line), Vin,blue (dashed blue line), Vin,red (dashed red line), and Vout,red (dot-dash red line).
Current usage metrics show cumulative count of Article Views (full-text article views including HTML views, PDF and ePub downloads, according to the available data) and Abstracts Views on Vision4Press platform.
Data correspond to usage on the plateform after 2015. The current usage metrics is available 48-96 hours after online publication and is updated daily on week days.
Initial download of the metrics may take a while.