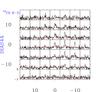
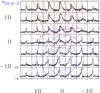
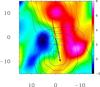
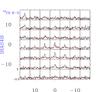
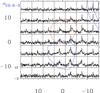
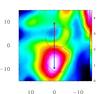
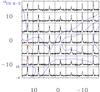
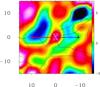
Fig. A.5
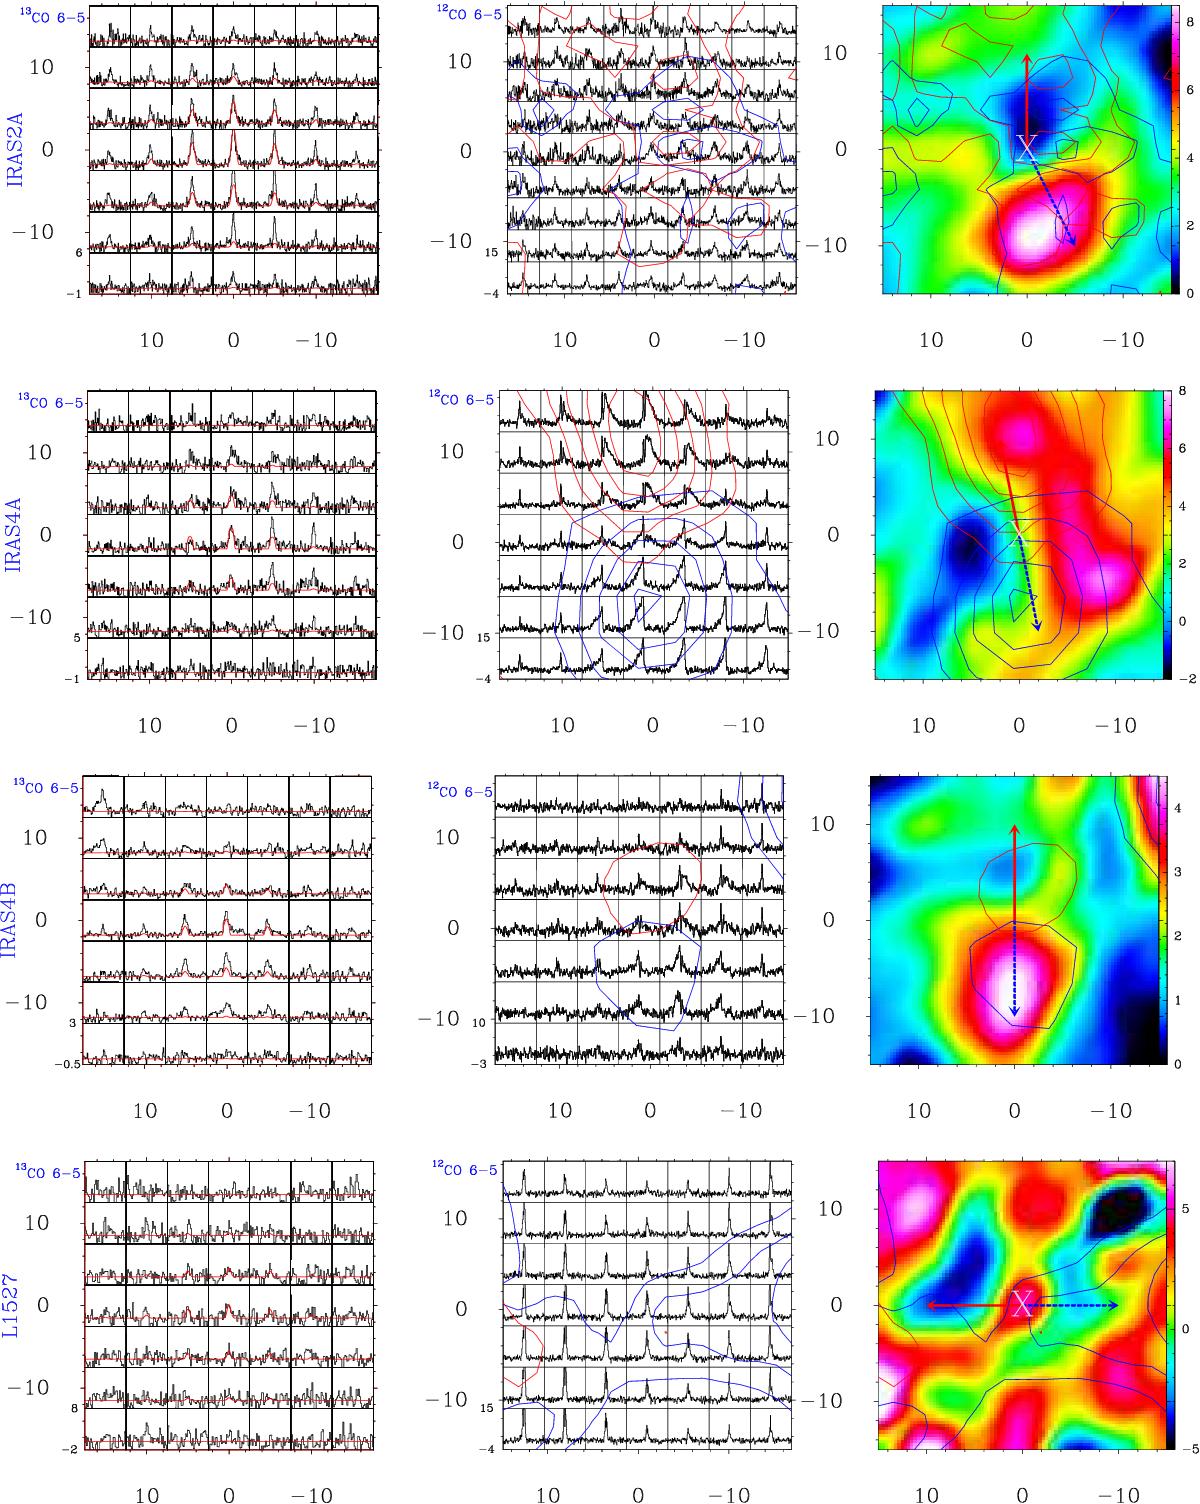
7 × 7 pixel fully sampled maps are extracted toward the central positions of the sources in 13CO 6−5 (left) and in 12CO 6−5 (middle) transitions. The axes represent the equatorial offsets (Δα, Δδ) in arcsec. The main beam temperature intensity scale of each box are shown in the y-axes of the bottom-left box in Kelvins. The velocity range in each box is ±8 km s-1 for the 13CO spectra, and ±25 km s-1 for the 12CO spectra. The red lines in the left-hand panels are the 13CO 6−5 model line intensities for the passively heated envelope. The excess emission in the observations compared with these model profiles corresponds to the UV-heated gas and is shown as an image in the right panel with the intensity scale in K km s-1. The middle and right panels contain the red and blue outflow lobes with the contour levels given in Table A.1. The blue and red arrows in the right-hand panels show the direction of the outflow lobes.

Current usage metrics show cumulative count of Article Views (full-text article views including HTML views, PDF and ePub downloads, according to the available data) and Abstracts Views on Vision4Press platform.
Data correspond to usage on the plateform after 2015. The current usage metrics is available 48-96 hours after online publication and is updated daily on week days.
Initial download of the metrics may take a while.