


| Issue |
A&A
Volume 712, August 2026
|
|
|---|---|---|
| Article Number | A29 | |
| Number of page(s) | 25 | |
| Section | Extragalactic astronomy | |
| DOI | https://doi.org/10.1051/0004-6361/202659045 | |
| Published online | 31 July 2026 | |
Tidal preconditioning and ram-pressure stripping in NGC 1427A
Deep VLT/MUSE spectroscopy and FUV-to-radio observations trace a Fornax cluster dwarf in transformation
1
Institute of Astrophysics, Pontificia Universidad Católica de Chile,
Av. Vicuña Mackenna 4860,
7820436
Macul, Santiago,
Chile
2
Centro Espacial Nacional, Fuerza Aérea de Chile,
Av. Pedro Aguirre Cerda 5500,
Cerrillos, Santiago,
Chile
3
Department of Astrophysics, University of Vienna,
Türkenschanzstraße 17,
1180
Wien,
Austria
4
European Southern Observatory,
Karl-Schwarzschild-Straße 2,
85748
Garching bei München,
Germany
5
Minnesota Institute for Astrophysics, University of Minnesota,
116 Church Street SE,
Minneapolis,
MN
55455,
USA
6
Las Campanas Observatory, Carnegie Observatories,
Casilla 601,
La Serena
7820436,
Chile
7
Gemini Observatory, South Operations Center,
Casilla 603,
La Serena,
Chile
8
Instituto de Estudios Astrofísicos, Facultad de Ingeniería y Ciencias, Universidad Diego Portales,
Av. Ejército Libertador 441,
Santiago,
Chile
9
Instituto de Astrofísica, Universidad Andrés Bello,
Fernández Concha 700,
7591538
Las Condes, Santiago,
Chile
10
Max Planck Institute for Astronomy,
Königstuhl 17,
69117
Heidelberg,
Germany
★ Corresponding author: This email address is being protected from spambots. You need JavaScript enabled to view it.
Received:
19
January
2026
Accepted:
11
May
2026
Abstract
Context. The early environmental transformation of low-mass cluster galaxies from gas rich to gas poor remains poorly constrained in part because clear phase-resolved observations are rare. NGC 1427A, a disturbed star-forming dwarf in the Fornax cluster, offers a favorable case for studying this process.
Aims. We aim to build a spatially resolved multiphase picture of NGC 1427A in order to constrain the roles of ram-pressure stripping and tidal perturbations in its present transformation.
Methods. We combined a deep, spatially contiguous VLT/MUSE mosaic with ancillary data from the far ultraviolet to the radio. Full-spectrum fitting of the MUSE cube yielded maps of stellar kinematics, ages, metallicities, and continuum attenuation, while emission-line modeling provides ionized-gas kinematics, Balmer-decrement reddening, and star formation rate surface densities. The ancillary multiwavelength data trace the neutral and molecular gas, dust, and recent star formation, placing the MUSE-based results in a broader multiphase context.
Results. We find a pronounced decoupling between stars and gas: The H I and ionized gas rotate about an axis tilted with respect to the stellar field and are globally blueshifted. Joint constraints from stellar and nebular attenuation, infrared dust tracers, and H I morphology indicate stripping with a strong line-of-sight component that has progressed into the interstellar medium. At the same time, the asymmetric distribution of gas and dust, together with the structured and time-dependent star formation, points to an additional gravitational perturbation, with a recent mild flyby by a nearby dwarf being the favored interpretation.
Conclusions. We propose that dwarf–dwarf tidal effects have torqued and preconditioned the gas, while the Fornax intracluster medium is driving ram-pressure stripping that now reaches the interstellar medium and coincides with a declining global star formation rate. This places NGC 1427A at the onset of environmentally driven quenching, making it a useful benchmark for early cluster dwarf transformation.
Key words: galaxies: dwarf / galaxies: evolution / galaxies: interactions / galaxies: ISM / galaxies: clusters: individual: Fornax / galaxies: individual: NGC 1427A
© The Authors 2026
 Open Access article, published by EDP Sciences, under the terms of the Creative Commons Attribution License (https://creativecommons.org/licenses/by/4.0), which permits unrestricted use, distribution, and reproduction in any medium, provided the original work is properly cited.
This article is published in open access under the Subscribe to Open model. This email address is being protected from spambots. You need JavaScript enabled to view it. to support open access publication.
1 Introduction
Low-mass galaxies in clusters are heavily transformed by their environment, yet the relative roles of ram-pressure stripping (RPS), gravitational tides, and, crucially, how the collisionless stellar component and collisional (ionized and neutral gas, and dust) remain coupled or decouple are still debated (e.g., Mayer et al. 2006; Cortese et al. 2021; Boselli et al. 2022). Compared to field dwarfs, present-day cluster dwarfs are systematically redder, more quiescent, and structurally transformed, reflecting accelerated quenching and morphological change in dense environments (e.g., Boselli et al. 2022; Wang et al. 2023; Brown et al. 2023; Chamba et al. 2024; Blaña et al. 2025). However, the transitional path between field-like and cluster-processed dwarfs remains poorly constrained, complicating like-for-like comparisons of scaling relations across environments (e.g., Mistani et al. 2016; Romero-Gómez et al. 2024). Observationally, key uncertainties persist and prevent fully understanding timescales, viewing geometry, and the disentanglement of hydrodynamical and tidal effects (e.g., Poggianti et al. 2017; Boselli et al. 2022; Cortese et al. 2021; Poggianti et al. 2025). The scarcity of clear RPS “snapshots” may reflect rapid processing. Simulations have suggested efficient removal of circumgalactic gas on timescales of approximately a few times 108 yr, shortening the observable transition window in low-mass systems (e.g., Benítez-Llambay et al. 2013; Zhu et al. 2024; Ghosh et al. 2024). Furthermore, the accretion history leaves an imprint on the kinematics and morphology of stars and cold gas, as well as on their mutual misalignment, underscoring the importance of multiphase tracers (e.g., Zeng et al. 2024). Spatially contiguous phase-resolved observations are therefore essential to connecting stellar structure and kinematics to the evolving gas and dust during environmental transformation.
The Fornax galaxy cluster is an ideal nearby laboratory for such studies. It is compact and dynamically evolved. It is at a distance of D ≃ 19.3 ± 0.7 Mpc (Anand et al. 2024; Blakeslee et al. 2009), and its substructure and internal dynamics are well-mapped (Drinkwater et al. 2001a,b; Schuberth et al. 2010; Chaturvedi et al. 2022; Reiprich et al. 2025). Its total mass is comparatively modest (Mvir ≈ 7 × 10¹³ M⊙ Drinkwater et al. 2001a), potentially extending the timescales over which early gas removal and transformation can be observed. Deep wide-field imaging from the Next Generation Fornax Survey (NGFS) and the Fornax Deep Survey (FDS) has enabled a detailed census of dwarfs and low-surface-brightness structure (e.g., Muñoz et al. 2015; Eigenthaler et al. 2018; Venhola et al. 2018; Raj et al. 2019). On the gas side, the MeerKAT Fornax Survey has revealed a sub-population of H I-rich dwarfs, some with disturbances or tails (Serra et al. 2023; Kleiner et al. 2023), tracing gas loss. These assets, together with the distance-modulus precisions that can be achieved with James Webb Space Telescope (JWST) for 3D placement (Anand et al. 2024), make Fornax uniquely suited to dissect the roles of RPS and tides in dwarf galaxies in cluster environments.
NGC 1427A is a star-forming Fornax dwarf with an arrowhead-like, cometary morphology and a one-sided H I tail pointing in the anti-cluster-centric direction (e.g., Hilker et al. 1997; Chanamé et al. 2000; Lee-Waddell et al. 2018; Serra et al. 2024). Early work combining Australia Telescope Compact Array (ATCA) H I with deep optical imaging suggested a tidal or merger origin for the disturbed stellar structure (Lee-Waddell et al. 2018). A different interpretation was proposed by Mastropietro et al. (2021), who showed with simulations that the combined effect of the Fornax tidal field, galaxy rotation, orbital curvature, and RPS can reproduce a two-tail morphology resembling NGC 1427A if the galaxy is only ~200 kpc in front of the cluster center. A legacy globular cluster luminosity function distance places NGC 1427A marginally in the foreground relative to the Fornax core, albeit with large uncertainties (we adopt D = 17 ± 1.5 [stat.] ± 1.0 [syst.] Mpc throughout this work; see Georgiev et al. 2006). Together with its large line-of-sight velocity offset relative to NGC 1399 (about 600 km s−1 larger), this supports a high-velocity infall scenario in which the cluster environment can play a central role (Chanamé et al. 2000). The deeper MeerKAT analysis of Serra et al. (2024), however, revealed a more extended and kinematically complex H I structure and favored a scenario in which gas that was already tidally disturbed by a galaxy–galaxy encounter or merger was subsequently shaped by RPS. The complex optical low-surface-brightness environment, including an asymmetric outer envelope and nearby dwarf candidates, is illustrated in Fig. 1.
Here we present results from a four-field Very Large Telescope/Multi Unit Spectroscopic Explorer (VLT/MUSE) mosaic of NGC 1427A with a uniform reduction optimized for heterogeneous observing conditions (see Table 1) and providing contiguous coverage across the main body and outskirts (Fig. 1). We analyze the MUSE mosaic alongside MeerKAT H I maps (Kleiner et al. 2023), deep NGFS imaging (Muñoz et al. 2015), AstroSat/Ultraviolet Imaging Telescope (UVIT) far-ultraviolet (FUV) imaging, and Spitzer/Herschel infrared data (Sivanandam et al. 2014; Fuller et al. 2014). These data enable a spatially registered multiphase view of the stars, ionized gas, neutral gas, and dust.
Summary of MUSE observations for NGC 1427A.
2 Data
2.1 MUSE observations and data reduction
The VLT/MUSE observations were obtained between 2015 and 2023, using WFM-noAO and WFM-AO mode (Table 1). The data were reduced with the ESO MUSE pipeline (v3.13.8; Weilbacher et al. 2020), complemented by custom procedures designed for the galaxy’s extended low-surface-brightness outskirts and heterogeneous observing conditions.
At a high level, the workflow comprises (i) standard calibrations and construction of science pixel tables, (ii) astrometric alignment of each exposure to a common reference frame using an archival Hubble Space Telescope/Advanced Camera for Surveys (HST/ACS) image (Prog. ID 9689), (iii) sky modeling and subtraction with field-specific strategies, and (iv) coaddition onto a common output WCS to form the final cube. Fields 2 and 3 include dedicated offset-sky exposures, Field 4 contains sufficient blank sky for in-field modeling, while Field 1 is entirely filled by galaxy emission and therefore uses a sky-continuum estimate anchored to the overlap with Fields 2–3. Residual sky features are mitigated using ZAP (Soto et al. 2016). After this procedure, the flux levels between fields agree to within ≲10% in pairwise overlap regions. We also construct a no-ZAP control mosaic to verify that ZAP does not introduce artifacts in either emission-line measurements or the continuum. A detailed description of the reduction steps is provided in Appendix A.
2.2 MUSE data analysis
We derived high-level products from the final MUSE mosaic (Sect. 2.1; Appendix A) using a workflow similar in spirit to widely used data-analysis pipelines (DAPs) for resolved optical spectroscopy, such as TIMER (Gadotti et al. 2019), MaNGA (Belfiore et al. 2019; Westfall et al. 2019), and PHANGS-MUSE (Emsellem et al. 2022, E22 hereafter). These approaches typically build on full-spectrum fitting and simultaneous line modeling with tools such as penalized pixel-fitting PPXF (Cappellari & Emsellem 2004; Cappellari 2017). We treated the wavelength-dependent MUSE line-spread function (LSF) as described in (E22); key configuration choices and derived estimators are summarized in Appendix B.
We analyzed the ZAP-cleaned cube with a modified version of TARDIS1, the open-source implementation of the PHANGS-MUSE DAP (E22), which itself builds on GIST2 (Bittner et al. 2019). We adopted TARDIS because it is extensively tested on star-forming systems (E22), and crucially for a disturbed dwarf with spatially varying star formation (e.g., McQuinn et al. 2009), its default stellar-population fits do not impose regularization. We constructed maps directly from the PPXF outputs to retain explicit control over masking and quality cuts and to avoid propagating measurements into bins with poor fits (see Appendix B).
Preparation and masking. We adopted a reference systemic velocity of 2035 km s−1 (e.g., Tonry et al. 2001; Serra et al. 2024) and a Milky-Way foreground reddening E(B–V) = 0.01 (Schlafly & Finkbeiner 2011). Foreground stars and unrelated background sources were masked prior to binning and fitting; these sources are not analyzed further. We applied adaptive Voronoi binning (Cappellari & Copin 2003) to reach a uniform continuum signal-to-noise ratio (S/N) across the mosaic, computing S/N in the 5300–5500 Å window from the propagated variance. We adopted a baseline target S/N = 35 and repeated the full analysis at S/N = 60 and 90 as a robustness check. Key maps and integrated quantities were shown to be consistent, with the expected trade-off between spatial resolution and statistical noise.
Stellar continuum: kinematics, attenuation, and populations. We fit the stellar continuum with PPXF using E-MILES simple stellar population (SSP) models (Vazdekis et al. 2016) assuming a Chabrier (2003) initial mass function (IMF) and BaSTI isochrones (Pietrinferni et al. 2004). We follow the E22 fitting sequence, but use extended low-metallicity SSP grids better suited to dwarf galaxies; the exact kinematic and stellar-population template subsets are listed in Appendix B. The sequence consists of (i) a stellar-kinematics fit measuring the first four Gauss-Hermite moments (V, σ, h3, h4), (ii) a dedicated attenuation step to constrain E(B–V)* while mitigating template/continuum degeneracies (see Sextl et al. 2024, 2025), and (iii) a non-regularized stellar-population fit over a broad MUSE wavelength range to recover template weights and their uncertainties via Monte Carlo realizations (E22). Strong night-sky residual regions are masked during the fits (Fig. A.1; gray bands show the masked spectral windows used in the fits). In the attenuation step, we disable both additive and multiplicative Legendre polynomials; the polynomial scheme in the other PPXF runs follows E22 and is summarized in Appendix B.
For internal attenuation within NGC 1427A, we adopt a Calzetti-type extinction curve with an LMC-like total-to-selective ratio RV = 3.41 (Calzetti et al. 2000; Gordon et al. 2003), and apply this prescription consistently to both the stellar continuum and nebular emission.
Emission-line modeling. Nebular emission lines were fitted with PPXF after subtracting the best-fitting stellar continuum, tying kinematics within three line families (hydrogen recombination, low-ionization, and high-ionization species) following Belfiore et al. (2019). Line amplitudes are fit freely, with fixed branching ratios where required by atomic physics (e.g., common strong doublets); we adopt a single kinematic component per family. To improve stability in the red, we mask the brightest sky lines in the observed frame using the UVES sky-emission atlas (Hanuschik 2003) as a reference. We fit emission lines at the Voronoi-bin level and at the spaxel level initialized from the S/N = 35 solution. Lines are considered robust where they are not fully compromised by masking and reach S/N > 5 in at least one bin.
Derived maps. From the fitted products we constructed maps of stellar kinematics, stellar attenuation, and stellar-population summaries (e.g., surface-mass density and mass-weighted mean age/metallicity), together with emission-line fluxes and gas kinematics. Where needed, we convert extinction-corrected Hα luminosities into star formation rates (SFRs) using standard calibrations (Kennicutt & Evans 2012; Chomiuk & Povich 2011) and Balmer-decrement reddening under case-B assumptions (with a Calzetti-type curve; Calzetti et al. 2000, C00 hereafter). The exact estimators, quality cuts, and uncertainty propagation used for derived quantities (including Balmer-decrement reddening and Hα-based SFRs) are summarized in Appendix B.
 |
Fig. 1 NGFS DECam i′g′u′ (RGB) view of NGC 1427A. North is up, east is left; the arrow marks the direction to the Fornax cluster center. The MUSE mosaic footprint is shown in transparent red. White and black curves trace u′+g′+i′ isophotes at different surface-brightness levels (see legend). The dashed white circle marks the “northern clump” (Lee-Waddell et al. 2018); labeled red ellipses mark nearby dwarf candidates discussed in the text and listed in Table 2. |
2.3 Ancillary data
To place the MUSE results in a multiphase context, we combined the optical ionized-gas and stellar diagnostics with ancillary constraints on the neutral and molecular gas, recent star formation, and dust. In practice, we relied on (i) MeerKAT H I products from the MeerKAT Fornax Survey (Serra et al. 2023; Kleiner et al. 2023; Serra et al. 2024), which provide H I column density and kinematics at arcsecond-to-kiloparsec scales in the Fornax environment; (ii) a deep UVIT FUV image in the F148W band (Rampazzo et al. 2022; Tandon et al. 2017, 2020), used as an independent tracer of recent (≲100 Myr) star formation along-side Hα; (iii) infrared constraints from Spitzer/IRAC imaging and Spitzer/IRS spectroscopy together with Herschel far-infrared (FIR) photometry (Ordenes-Briceño et al. 2018; Smith et al. 2007a; Fuller et al. 2014), which trace polycyclic aromatic hydrocarbon (PAH) sensitive emission and the warm and cold dust components; and (iv) the ALMA CO(1–0) non-detection reported by Zabel et al. (2019), which bounds the CO-bright molecular gas reservoir.
For the qualitative multiwavelength comparisons presented in this work, we registered ancillary maps to the MUSE astrometric frame; where appropriate (e.g., UV and IR overlays), we homogenized the effective resolution by PSF-matching to a common Gaussian FWHM set by the lowest-resolution dataset in the comparison. We restrict the main text to the aspects of these data products that directly support the interpretation of the MUSE results, while technical details (UVIT calibration, IR processing choices, and derived global quantities such as dust SED fits and CO-to-H2 limits) are reported in Appendix C.
Nearby dwarf galaxies within ~10′ of NGC 1427A.
3 Results
3.1 Multiphase morphology and environment
The NGFS image in Figure 1 shows that NGC 1427A has a characteristic arrowhead or cometary appearance with bright, clumpy star-forming knots embedded in an irregular low-surface-brightness (LSB) envelope. At μ ≃ μ0 + 3.5 the isophotes depart from simple ellipses with a southward extension, and the faintest levels (μ ≃ μ0 + 5) are elongated toward the southwest. A very faint, stream-like feature is tentatively traced in that direction. Several LSB dwarfs within a projected radius of ~10′ (~60 kpc) are listed in Table 2 with literature identifiers and stellar-mass estimates. The most massive of those, FCC 229, lies approximately along the axis of the faint southwest extensions. None shows an obvious substructure at our depth, with only FCC 229 having a nuclear star cluster offset by 1″from the center (see Appendix C.2). We defer membership and dynamical relevance to the discussion, but note here that their projected configuration naturally allows for fast flyby scenarios. Toward the northeast, the LSB envelope appears noticeably bluer, suggesting a younger halo population, consistent with the measured FUV emission (Fig. 2).
The optical morphology captured by NGFS is put into context by the MeerKAT H I column density map. Figure 3 overlays H I contours at levels NH I = 3.0 × 1018 × 5n cm−2 (increasing integer n) on the NGFS color image. Three features stand out: (i) two tails, one in the anti-cluster-centric direction (southeast) and another pointing toward FCC 229 (see also Loni et al. 2021; Mastropietro et al. 2021; Serra et al. 2024), (ii) an elongation from northeast to southwest at NH I = 3.8 × 1020cm−2, and (iii) the highest column densities offset to the southwest relative to the optical body. Taken together, these patterns show that the gas distribution is disturbed on multiple spatial scales, with one component aligned roughly anti-cluster-centrically and another along the northeast–southwest axis. We return to the possible origin of these components, including RPS, cluster tides, and galaxy–galaxy interactions, in Sect. 4.
The displacement of the bulk H I is similarly evidenced by other tracers of collisional phases, such as ionized gas via optical emission lines (Fig. 4), and warm dust via Spitzer spectral mapping (Fig. C.2). The spatial distribution of the non-collisional component is best shown by the pPXF MUSE-inferred stellar surface density map (see Fig. 6; see also 3.6 μm imaging in Sivanandam et al. 2014). These observations evidence decoupling between the collisional (gas and dust) and non-collisional (stars) phases.
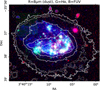 |
Fig. 2 Three-color composite highlighting distinct star formation and interstellar medium (ISM) tracers in NGC 1427A: IRAC 8 μm (red; stellar-continuum subtracted), MUSE Hα (green), and UVIT FUV (blue). All images are PSF-matched to a common 2″ FWHM Gaussian. In the main body, 8 μm emission envelopes Hα knots as expected for dusty H II regions; the northern clump shows clear 8 μm emission, with faint bridge-like 8 μm connecting to the main body. By contrast, several high-surface-brightness Hα clouds at the leading edge (toward the Fornax cluster center) exhibit little or no 8 μm, indicating ionized gas with weak co-spatial aromatic and small-grain emission. We also note extended FUV emission to the northeast with weak Hα counterparts, consistent with ~50–100 Myr populations after ionizing stars have faded. See Section 2 and Appendix C for details. |
3.2 Multiphase kinematics
Figure 4 summarizes the stellar and gaseous kinematics together with surface-brightness tracers. MeerKAT H I maps trace the cold atomic phase, MUSE constrains the stars and the gas via Balmer and ionized element emission lines.
A global feature in the velocity maps is an offset between the stellar and gaseous kinematics. To quantify this in a homogeneous way, we estimate the dominant large-scale velocity gradient of the stellar, Hα, and H I velocity fields within a common elliptical aperture tracing the main stellar body, and define the corresponding kinematic major-axis position angle from the direction of that gradient (see Appendix D for details). With position angles measured east of north, we obtain PAkin = 63.6° ± 1.4° for the stellar component, PAkin = 91.4° ± 0.5° for Hα, and PAkin = 102.0° ± 1.8° for H I. These values confirm a clear kinematic misalignment of order ~30° between the stellar and gaseous components, while Hα and H I remain more nearly aligned with each other.
Within the main body (inside the μ0 and μ0 + 1 isophotes), the Hα and H I surface-brightness distributions and velocities broadly coincide. Northward, H I becomes increasingly blueshifted relative to the ionized clumps. Velocity residuals inside the μ0 + 2 isophote are defined as Δv ≡ v − 2035 km s−1 (our adopted systemic radial velocity; negative values denote blueshift). As shown in Figure 5, the H I residuals are skewed to negative values, with a mean offset of ~ − 16 km s−1 and a median of ~ − 24 km s−1 relative to the stars. Hα residuals are closer to the stellar distribution but are marginally skewed to negative values, with a median of −3.5 km s−1. Low- and high-ionization tracers ([S II], [O III]) have incomplete coverage within this isophote. However, where measured, their kinematics are consistent with Hα. The H I map has a beam size of ≳6″. Beam smearing broadens the velocity distribution and may dilute peak offsets.
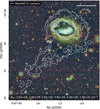 |
Fig. 3 NGFS u′g′i′ RGB image of NGC 1427A with MeerKAT H I column-density contours (6″ beam) overlaid in white. Contours are drawn at several column densities, tracing the concentration of H I, the gaseous disk, and the southwest tail around the stellar body. |
3.3 Stellar-population properties
In Figure 6, we map the stellar mass surface density, Σ*, the mass-weighted mean metallicity, ⟨𝒵⟩M, and the massweighted mean logarithmic age, ⟨𝒜⟩M ≡ ⟨log10(age/yr)⟩M (see also Sect. 2.2 and Appendix B.2). For each bin, these quantities were derived from the pPXF SSP template masses returned over the Monte Carlo ensemble: Σ* is the total present-day stellar mass in the bin divided by its projected area, while ⟨𝒵⟩M and ⟨𝒵⟩M are the corresponding mass-weighted means over the SSP metallicity and age grid. Figure 7 presents the region-integrated age–metallicity distributions and their one-dimensional projections for the whole galaxy, the main body, and the northern clump.
To summarize the stellar-population fits over a region, we combine the pPXF template masses across all Voronoi bins in that region and normalize them so that the total sums to unity. The resulting 2D distribution on the SSP age–metallicity grid therefore represents the fraction of present-day stellar mass assigned to each (age, [Z/H]) template. One-dimensional star-formation histories are obtained by converting present-day mass to initially formed mass using the SSP living-mass fractions and dividing by the age-bin width; metallicity distribution functions are obtained by marginalizing over age and converted into present-day stellar mass.
The stellar surface-mass density peaks across the main body, coincident with the solid-body-like stellar rotation, and declines smoothly toward the outskirts. Optical light peaks overemphasize regions with recent star formation relative to Σ*, and the mass map illustrates the underlying stellar population structure. The northern clump does not appear strongly as a stellar overdensity. Its contrast is dominated by a bright, young component and local dust geometry, consistent with its prominence in Hα and FUV.
The region-integrated stellar age–metallicity distributions (Fig. 7) show three prominent components: (i) a dominant old, metal-poor population in mass; (ii) a young (0.1–1.0 Gyr), metal-rich component that contributes strongly to the light; and (iii) very young (≲0.1 Gyr), metal-poor pockets. In the maps, some of the most metal-poor zones coincide with Hα-bright regions (Fig. 6; see also Fahrion et al. 2026).
The combination of the Hα- and FUV-based star formation tracers, together with the pPXF-inferred stellar populations, provides complementary constraints on the star formation history (SFH) from million-year to billion-year timescales (see Fahrion et al. 2026 for insights from star clusters). The youngest stellar-population templates in our grid have an age of 30 Myr. The recovered SFR in this youngest age bin (≲40 Myr) is ![Mathematical equation: $\[1.2_{-0.4}^{+0.3}\]$](/articles/aa/full_html/2026/08/aa59045-26/aa59045-26-eq1.png) M⊙ yr−1. For comparison, the FUV-based SFR is 0.117 ± 0.041 M⊙ yr−1 and the Hα-based SFR is 0.069 ± 0.020 M⊙ yr−1 (Table 3). The relative offsets between these indicators and with respect to the star-forming main sequence (SFMS) are discussed in Sect. 4.4.
M⊙ yr−1. For comparison, the FUV-based SFR is 0.117 ± 0.041 M⊙ yr−1 and the Hα-based SFR is 0.069 ± 0.020 M⊙ yr−1 (Table 3). The relative offsets between these indicators and with respect to the star-forming main sequence (SFMS) are discussed in Sect. 4.4.
The northern clump is marginally more metal-poor than the main body by ~0.2 dex. Both the light- and mass-weighted ages are similar across apertures (Table 3), indicating no marked differences in the SFH. Within the apertures, the main body contains ~74% of the stellar mass and the northern clump ~3.4%.
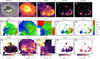 |
Fig. 4 Multiphase overview of NGC 1427A. Each column shows the same tracer; each row shows a different property. The maps for MUSE-based emission lines show only measurements with S/N >10 (i.e., relative flux error <10%). For visualization, the ionized-gas velocity and dispersion maps are hybrid: spaxel-level values where S/N > 10, Voronoi-bin values elsewhere. Row 1 – surface brightness: NGFS u′g′i′ composite; MeerKAT H I column density (6" beam); and MUSE maps of Hα, [S II] λλ6716, 6731, and [O III] λλ4959, 5007 flux. Row 2 – line-of-sight velocity: stellar pPXF velocity, H I moment–1, and hybrid ionized–gas velocity maps (spaxel-level where S/N > 10, Voronoi-bin values elsewhere). All five panels share the color bar on the right. In all but the last panel, the systemic-velocity contour (v = 2035 km s−1) is highlighted within the μ0 + 2 isophote to guide the eye to the approximate zero-velocity line. Row 3-velocity dispersion: stellar, H I, Hα, [S II], and [O III] dispersions with individual color bars below each panel. Overlaid on each frame are the contours for spatial reference. These isophotes were calculated over the NGFS u′ + g′ + i′ image. From the brightest isophote with surface brightness μ0, the others show μ0 + 1, μ0 + 2, and μ0 + 4.5, with no spatial smoothing. A 1 kpc bar is shown in the top-left corner of every panel (distance adopted: 17 Mpc). |
3.4 Dust attenuation from stars and gas
We mapped stellar and nebular reddening using the estimators described in Section 2.2 and Appendix B. Figure 8 shows (i) the MeerKAT H I column density, (ii) stellar E(B–V)* from the pPXF stellar continuum fit, and (iii) nebular E(B–V)gas from the Balmer decrement together with (iv) their distributions inside the μ0+1 isophote. Approximately 90% of the Hα emission originates from within this contour, and it contains most of the H I gas. It is therefore the most representative region for the nebular emission and provides the fairest comparison with the stellar attenuation.
Inside the μ0+1 isophote, the stellar and nebular reddening distributions differ, and we measured ⟨E(B–V)*⟩ ≃ 0.17 with median ![Mathematical equation: $\[\tilde{E}(B\text{-}V)_{*} \simeq 0.14\]$](/articles/aa/full_html/2026/08/aa59045-26/aa59045-26-eq2.png) , versus ⟨E(B–V)gas⟩ ≃ 0.04 with median
, versus ⟨E(B–V)gas⟩ ≃ 0.04 with median ![Mathematical equation: $\[\tilde{E}(B\mathrm{-}V)_{\text {gas }} \simeq 0.04\]$](/articles/aa/full_html/2026/08/aa59045-26/aa59045-26-eq3.png) 3. The stellar reddening positively correlates with the H I column density, except in the brightest Hα regions where E(B–V)* is reduced and the continuum is dominated by young stellar populations. A highly obscured bridge between the main body and the northern clump coincides with 8 μm dust emission (see Fig. 2, and Fig. 13 of Sivanandam et al. 2014). Herschel FIR images lack the resolution to trace this feature. We therefore used H I as our primary tracer of cold, collisional matter. The implications of these dust constraints are discussed in Section 4.2.2.
3. The stellar reddening positively correlates with the H I column density, except in the brightest Hα regions where E(B–V)* is reduced and the continuum is dominated by young stellar populations. A highly obscured bridge between the main body and the northern clump coincides with 8 μm dust emission (see Fig. 2, and Fig. 13 of Sivanandam et al. 2014). Herschel FIR images lack the resolution to trace this feature. We therefore used H I as our primary tracer of cold, collisional matter. The implications of these dust constraints are discussed in Section 4.2.2.
Integrated properties of NGC 1427A in three apertures.
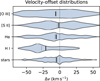 |
Fig. 5 Violin plot of the line-of-sight velocity residuals of individual components with respect to the systemic radial velocity: Δv = v − 2035 km s−1, where 2035 km s−1 is our adopted systemic velocity. From top to bottom: Residuals in [O III] (high-ionization), [S II] (low-ionization), Hα (Balmer emission), H I, and the stellar component, measured inside the μ0 + 2.0 isophote. Each violin shows the kernel-density estimate (vertical width ∝ probability), while the gray line marks the median, the black line indicates the mean, and the dashed vertical line highlights Δv = 0. Distributions were computed from the velocity maps in Fig. 4. |
3.5 Current star formation rate from Hα and FUV
Figure 9 shows the Hα-based star formation rate (SFR) surface density (ΣSFR) map after Balmer-decrement correction (Appendix B). Star formation is clumpy and widespread across the main body, with additional activity in the outer halo. The global SFRHα within the FoV is ![Mathematical equation: $\[\dot{M}_{*}\]$](/articles/aa/full_html/2026/08/aa59045-26/aa59045-26-eq4.png) = 0.069 M⊙ yr−1 (Table 3), while the main body contributes ~0.061 M⊙ yr−1 and the northern clump contributes only ~0.003 M⊙ yr−1.
= 0.069 M⊙ yr−1 (Table 3), while the main body contributes ~0.061 M⊙ yr−1 and the northern clump contributes only ~0.003 M⊙ yr−1.
The UVIT FUV data (Fig. 2) shows a similarly patchy distribution, with a prominent northeast extension that is weak in Hα. Using the attenuation-corrected UVIT/F148W magnitudes and the Lν calibration for a Kroupa/Chabrier IMF described in Appendix C.1, we obtain a global SFRFUV = 0.117 ± 0.041 M⊙ yr−1. To emphasize the influence of dust corrections, the corresponding bandpass-weighted attenuation is AFUV = 0.492 ± 0.201 mag for all three apertures. We assumed that the young stellar populations that dominate the FUV emission are subject to a similar dust geometry as the nebular emitting gas (⟨E(B–V)gas⟩ ≃ 0.04), but if the geometry is instead closer to the older stellar population, then FUV attenuation and star formation rates could be underestimated. Per-aperture FUV SFRs are reported in Table 3.
On integrated scales, SFRFUV is modestly higher than SFRHα (globally and for the main body, within uncertainties) and is comparatively enhanced in the northern clump (Table 3). For the FUV attenuation correction, we adopt a single internal color excess consistent with the spatially averaged Balmer decrement reddening, implicitly assuming that the FUV-emitting populations experience similar dust columns to the nebular gas. If the FUV continuum is instead attenuated more like the older stellar population, then the inferred AFUV and SFRFUV could be biased low. The statistical error budget is dominated by uncertainties in attenuation and distance; distance contributions can be neglected when comparing tracers internally within the galaxy. We discuss the physical interpretation of the offsets between tracers and their different characteristic timescales in Section 4.4.
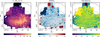 |
Fig. 6 From left to right, we show the stellar mass surface density (Σ*) averaged across MC realizations, the mass-weighted metallicity (⟨𝒵⟩M), and the mass-weighted age (⟨𝒜⟩M). Only bins with continuum S/N > 30 are shown, close to the target of 35. |
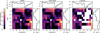 |
Fig. 7 Region-integrated stellar age–metallicity distributions and their 1D projections. Each column corresponds to a spatial region (whole galaxy, main body, northern clump). The heatmap shows PDFreg on the native SSP (log t,[Z/H]) grid, defined as the region-summed PPXF template masses normalized to unity (i.e., the fraction of the region’s present-day stellar mass assigned to each template; Appendix B.2). Top panels: star-formation histories derived by converting the mass-weighted distribution to formed mass using the SSP living-mass fraction, marginalizing over metallicity and dividing by the linear time-bin width to yield SFR(t). Side panels: metallicity distribution functions obtained by marginalizing over age and scaling by the region’s present-day stellar mass. |
4 Discussion
4.1 The big picture of the evolution of NGC 1427A
NGC 1427A is a low-mass, gas-rich dwarf that is currently undergoing strong environmental processing in the Fornax cluster. Throughout this work, we identify two main classes of environmental agents. The first is RPS by the Fornax ICM, which has a significant global effect on the collisional, gaseous components. The long anti-cluster-centric H I tail and the additional H I extension toward the southwest (Loni et al. 2021; Serra et al. 2023, 2024), the systematic blueshift of H I with respect to the stars, and the displacement of dusty gas along the line of sight all point to gas and dust being removed from the galaxy and pushed toward the observer. The unusual “reddening inversion” between stars and ionized gas (Sects. 3.4 and 4.2.2), together with the lack of obvious jellyfish-like Hα tentacles in projection (Ebeling et al. 2014; Poggianti et al. 2016), suggests that a substantial fraction of the dusty ISM associated with the inner disk has been displaced out of the disk plane and now lies in front of much of the stellar body along the line of sight. The enhanced gas velocity dispersion seen in the southeastern part of the disk (Fig. 4) is also consistent with turbulence and shear where gas is being displaced from the rotating disk by the ICM wind.
The second agent is a gravitational perturbation. RPS alone does not naturally explain the disturbance of the stellar body, the gas–star kinematic misalignment, and the off-center concentration of dense gas, dust, and recent star formation. Non-collisional tracers (i.e., stellar mass distribution and stellar kinematics; Fig. 4) reveal a significant misalignment between the stellar and gaseous kinematics, while collisional tracers (H I, ionized gas, warm dust, and FUV emission) are systematically displaced relative to the old stellar body. We also observe an FUV-bright, Hα-faint extension to the northeast, consistent with a ~50–100 Myr-old star-forming episode.
Several tidal channels could, in principle, contribute to this disturbance. Mastropietro et al. (2021) showed that the combined action of the Fornax tidal field, galaxy rotation, orbital curvature, and RPS can reproduce a two-tail morphology resembling NGC 1427A. This remains a possible alternative scenario. However, the deeper MeerKAT analysis of Serra et al. (2024, see their Sect. 4.2) revealed a longer (70 kpc-long tail with scattered clouds out to 300 kpc) and more kinematically complex H I structure than was available in the earlier ATCA-based view (~25 kpc-long tail), and favored a scenario in which gas that had already been tidally disturbed by a galaxy–galaxy encounter or merger was subsequently shaped by RPS. In this sense, the newer H I evidence, together with the expected weakness of cluster tides at the present projected radius for a system of NGC 1427A’s mass density (Serra et al. 2024; Blaña et al. 2025), shifts the balance away from a dominant role for the global Fornax tidal field and toward a galaxy–galaxy tidal perturbation plus RPS.
Our MUSE data support this mixed interpretation and add a recent-timescale constraint. The FUV and Hα morphology, the southwestern displacement of dense gas and dust, and the gas–star kinematic offset suggest that a recent or ongoing local perturbation has affected the ISM. Among the nearby dwarfs, FCC229 provides the most natural projected anchor for this recent localized component, as it lies to the southwest near the end of the secondary H I extension. We therefore favor a recent mild flyby involving FCC229 as a plausible contributor to the current off-center star formation and gas reorientation, while not requiring it to explain the full older large-scale stellar and H I disturbance on its own.
Although NGC 1427A lies close to the Fornax center in projection (~23′from NGC 1399, i.e., ~130 kpc at the Fornax distance), its true 3D cluster-centric distance remains uncertain. The legacy GCLF-based distance places it in the foreground of the Fornax core, albeit with large uncertainties. Nevertheless, the relevant point is that RPS can operate beyond the immediate cluster core in Fornax. eROSITA shows ICM emission and substructure to large radii (e.g., R200 ≈ 604 kpc), and long H I tails are observed in Fornax galaxies at large projected separations along likely infall paths, such as NGC 1437A at ~73.6′, or ~410 kpc, from NGC 1399 (Fig. 14 of Reiprich et al. 2025). Therefore, although the scenario of Mastropietro et al. (2021), in which NGC 1427A lies ~200 kpc in front of the cluster center and cluster tides play a major role, remains viable, it is not our preferred interpretation. The uncertain 3D distance prevents a purely geometrical discrimination between cluster tides and galaxy–galaxy perturbations. Our preference for a galaxy–galaxy tidal perturbation plus RPS is instead based mainly on the morphology and kinematics of the gas and stars, especially in light of the deeper MeerKAT analysis of Serra et al. (2024). A quantitative orbit reconstruction remains beyond the scope of this work.
In the remainder of this section, we interpret our results within a mixed scenario in which RPS by the Fornax ICM acts on gas that had already been tidally disturbed. We first assess how far RPS has progressed through the different gas and dust phases, then examine the evidence for a localized recent perturbation, with FCC 229 as the favored nearby candidate in projection. We then discuss how these processes have shaped the recent and past SFH, the chemical and dust content of NGC 1427A, and the properties of its surrounding substructures, before synthesizing the results into an evolutionary scenario.
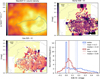 |
Fig. 8 Dust and gas context. Top left: MeerKAT H I column density (6″ beam). Top right: stellar E(B–V)* from stellar continuum fit (Appendix B.1). Bottom left: nebular E(B–V)gas from the Balmer decrement, masking bins with ΔE(B–V)gas > 0.1 mag. Both E(B–V) maps share the same color scale. Bottom right: normalized histograms inside the μ0+1 isophote (blue: stars; red: gas); vertical lines mark the mean (dashed) and median (dotted). Contours show NGFS isophotes; a 1 kpc bar is shown in each map. |
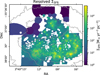 |
Fig. 9 Extinction-corrected Hα SFR surface density. The ΣSFR was computed per Voronoi bin using the Balmer-decrement-corrected Hα luminosity (Appendix B.1). Bins failing the S/N criteria (≲10) or uncertainty cuts are masked (white). |
4.2 The extent of ram-pressure stripping
In this subsection, we examine how far RPS has progressed through the collisional components of NGC 1427A: the neutral and ionized gas, and the dust. Taken together, these tracers indicate that ram pressure is not only removing gas from the circumgalactic regions but is also affecting the interstellar medium (ISM) of the main body, with a significant component along our line of sight.
4.2.1 Neutral gas and kinematics
The H I morphology and kinematics provide the clearest evidence for ongoing RPS. MeerKAT data reveal a long tail extending to the southeast, roughly anti-cluster-centric, as well as a secondary H I enhancement toward the southwest (Fig. 3; Serra et al. 2024). Both features are consistent with gas being removed from the outer disk or circumgalactic medium (CGM) as NGC 1427A moves through the Fornax ICM even at a large cluster-centric radius. In addition to these spatial asymmetries, the H I is systematically blueshifted with respect to the stars by a median offset of ~−24 km s−1 (within the μ0+2 optical isophote; see Figs. 1 and 5), indicating that a substantial fraction of the neutral gas is being accelerated toward the observer. The line-of-sight velocity distribution (LOSVD) of the ionized gas is also skewed toward negative velocities, but the difference between its median velocity and that of the stars is only marginal. Larger LOSVD offsets between the velocities of different gas phases and the stars have been reported as signatures of RPS acting in other jellyfish systems (e.g., Bellhouse et al. 2019).
These H I-based signatures closely resemble those identified by Serra et al. (2024), who used the U-shaped kinematical minor axis, the velocity gradient along the southern tail, and the lack of outer-disk compression to argue that NGC 1427A is experiencing a predominantly line-of-sight, blueshifting ram-pressure wind, with the southeastern tail containing gas that was first displaced tidally and only later accelerated by ram pressure. Our analysis confirms and extends this picture with independent tracers (young and old stars, ionized gas, and dust), and it allowed us to quantify how far this line-of-sight ram pressure has propagated into the main body.
The large projected extent of the long southeastern H I tail, together with its substantial line-of-sight velocity gradient (from ~2035 km s−1 near the galaxy to ~1770 km s−1 in the farthest detached clouds along the tail; Serra et al. 2024; Kleiner et al. 2025), is naturally explained if NGC 1427A follows a curved orbit through the Fornax potential. In that case, the material now forming the outer tail was likely removed more than 300 Myr ago (Serra et al. 2024), when the stripping direction had a stronger plane-of-sky component than it does today. The outer, mostly starless H I tail and the inner dusty ISM would then trace different stages of the same stripping event rather than the same instantaneous geometry. Figure 10 illustrates this interpretation, which we discuss further below. As an additional caution, a slight offset between the projected H I tail and the instantaneous anti-motion direction could partly reflect the imprint of gas-disk rotation on the stripped wake (e.g., Roediger et al. 2006; Roediger & Brüggen 2006).
Beyond these global trends, the detailed H I morphology may retain information about the three-dimensional disk geometry. Around the NH I ~ 4 × 1020 cm−2 contours in Fig. 3, the inner H I distribution shows curved overdensities and extensions, giving the gaseous disk a disturbed and mildly twisted appearance, with weak spiral-arm-like features in a counterclockwise direction. Observational and theoretical work shows that the vast majority of disk galaxies host trailing rather than leading spiral arms (see Sellwood & Masters 2022, and references therein). This pattern suggests that the inferred H I arms in NGC 1427A are trailing. Together with the consistent velocity pattern seen across all tracers in Fig. 4 with the eastern side of the disk blueshifted and the western side redshifted, this favors a configuration in which the northern side of the disk is nearest to the observer, and the southern side is closer to the galaxy cluster. This orientation is also consistent with the dust-reddening geometry discussed in Sect. 4.2.2.
There are marked differences in the velocity-dispersion maps of H I and Hα (bottom row in Fig. 4). The western side of the galaxy appears relatively more turbulent in H I, but exhibits a comparatively low Hα velocity dispersion. The eastern side, on the other hand, shows systematically higher velocity dispersion in both H I and Hα. This is consistent with the scenario outlined earlier in which the neutral gas is being stripped toward the observer primarily on the western side, leaving behind the star-forming clumps and little velocity dispersion in the young stellar component, which implies that the neutral gas must have decoupled from the star-forming clumps ≳10 Myr ago. The Hα velocity dispersion on the western side, tracing ionized gas associated with young star-forming regions, resembles the relatively featureless stellar velocity-dispersion map. The eastern side of the galaxy is more likely the result of flyby-induced turbulence with more recent star-formation activity (see Sect. 4.3).
4.2.2 Geometry effects on dust attenuation
The dust distribution and its imprint on the stellar continuum and nebular emission confirm that ram pressure has started to affect the ISM within the main body. Most of the dust is cold and emits in the FIR, with a warmer component that is bright in the mid-infrared (Fig. C.2). Fuller et al. (2014) reported log(Mdust/M⊙) = 6.62 ± 0.12 and Tdust = 15.8 ± 1.3 K for NGC 1427A. Over the same aperture, our simultaneous fit of a two-component (warm+cold; see Sect. C.3) dust model at the adopted distance in this work yields log(Mdust/M⊙) = 6.60 ± 0.25, where the distance uncertainty contributes significantly to the error budget, at essentially the same temperature. The dust emission, however, extends significantly beyond the D25 isophote considered by Fuller et al. (2014). Our MIR-based estimate suggests an increase of up to a factor of ~2 in the total dust mass when extending the aperture from the main body to the whole galaxy (from μ0+1 to μ0+2, still avoiding obvious contamination from bright background sources), implying a total dust mass of log(Mdust/M⊙) ≃ 6.90 ± 0.25 when the full extent is considered. In what follows, we focus on the main body, where the dust geometry can be more directly compared to the stellar and ionized-gas distributions.
Adopting a thick exponential disk for the main body (half-light radius Re ≃ 2.8 kpc at D ≃ 17 Mpc; Lee-Waddell et al. 2018), an observed axial ratio b/a ≃ 0.65, and an intrinsic thickness q0 ≃ 0.30 appropriate for massive dwarfs (Sánchez-Janssen et al. 2010; Roychowdhury et al. 2013), Holmberg’s relation (Holmberg 1958) implies an inclination of i ≃ 53° for the stellar disk. Approximating for simplicity of this toy model that Re = D25/2 ≃ 3 kpc, the mean dust surface density is
![Mathematical equation: $\[\Sigma_{\mathrm{dust}}=\frac{M_{\mathrm{dust}}}{\pi R_e^2} \simeq 3.5 \times 10^{-5} \mathrm{~g} \mathrm{~cm}^{-2}.\]$](/articles/aa/full_html/2026/08/aa59045-26/aa59045-26-eq5.png)
Using a V-band mass absorption coefficient κV ≃ 8.6 × 103 cm2 g−1 for Milky Way (MW) type grains (Draine 2003), the face-on and inclined optical depths are
![Mathematical equation: $\[\tau_{V, \perp}=\kappa_V ~\Sigma_{\mathrm{dust}} \simeq 0.30, \qquad \tau_V=\frac{\tau_{V, \perp}}{\cos~ i} \simeq 0.50.\]$](/articles/aa/full_html/2026/08/aa59045-26/aa59045-26-eq6.png)
Two limiting geometries then bracket the attenuation (Disney et al. 1989; Charlot & Fall 2000): a foreground screen with ![Mathematical equation: $\[A_{V}^{\mathrm{fs}}=1.086 ~\tau_{V} \simeq 0.54 ~\mathrm{mag}\]$](/articles/aa/full_html/2026/08/aa59045-26/aa59045-26-eq7.png) and a mixed slab with
and a mixed slab with
![Mathematical equation: $\[A_V^{\mathrm{ms}}=-2.5 ~\log _{10}\left[\frac{1-e^{-\tau_V}}{\tau_V}\right] \simeq 0.26 ~\mathrm{mag}.\]$](/articles/aa/full_html/2026/08/aa59045-26/aa59045-26-eq8.png)
Converting these to color excess using the Cardelli MW law (RV=3.1; Cardelli et al. 1989, C89 hereafter) and the Calzetti starburst law (RV=4.05; C00) to bracket the expected RV yields the expected E(B–V) under idealized geometries, which is summarized in Table 4.
Allowing for uncertainties in κV (±25%), in the intrinsic thickness q0 (0.25–0.35), and in the dust extent, we estimate that the expected ranges are E(B–V)fs ≃ 0.05-0.23 and E(B–V)ms ≃ 0.02-0.11 for the main body.
The relative attenuation of stars and ionized gas is strongly geometry-dependent. In local starbursts and spiral disks, the nebular lines are typically more attenuated than the stellar continuum, with E(B–V)*≃0.44 E(B–V)gas (Calzetti 2001, E22). In NGC 1427A, we see the opposite. Inside the μ0+1 isophote, we measure median reddening of ![Mathematical equation: $\[\tilde{E}(B\mathrm{-}V)_{*} \simeq 0.14\]$](/articles/aa/full_html/2026/08/aa59045-26/aa59045-26-eq9.png) and
and ![Mathematical equation: $\[\tilde{E}(B-V)_{\text {gas}}\]$](/articles/aa/full_html/2026/08/aa59045-26/aa59045-26-eq10.png) ≃ 0.04 (Sect. 3.4; Fig. 8), i.e., E(B–V)*/E(B–V)gas ≈ 3.34. Placed against our FIR-based expectations (Table 4), the stellar E(B–V) is consistent with a foreground-screen-like configuration, whereas the nebular E(B–V) lies at or below the mixed-slab prediction. The simplest configuration that reproduces both is one in which a substantial fraction of the dusty, cold ISM has been displaced in front of much of the older stellar population along our line of sight, while the currently ionized gas is mixed with the rest of the dust, with stellar feedback possibly clearing some of the dust, thereby further reducing the reddening (see Kronberger et al. 2008, for a numerical simulation of a similar geometry produced by RPS).
≃ 0.04 (Sect. 3.4; Fig. 8), i.e., E(B–V)*/E(B–V)gas ≈ 3.34. Placed against our FIR-based expectations (Table 4), the stellar E(B–V) is consistent with a foreground-screen-like configuration, whereas the nebular E(B–V) lies at or below the mixed-slab prediction. The simplest configuration that reproduces both is one in which a substantial fraction of the dusty, cold ISM has been displaced in front of much of the older stellar population along our line of sight, while the currently ionized gas is mixed with the rest of the dust, with stellar feedback possibly clearing some of the dust, thereby further reducing the reddening (see Kronberger et al. 2008, for a numerical simulation of a similar geometry produced by RPS).
This extinction-based picture is fully consistent with the multiphase kinematics. The H I gas is systematically blueshifted relative to the stars (median ~−24 km s−1; Fig. 5) and forms extended tails (Sect. 3.1), indicating that gas and dust are being pushed toward the observer. The inferred dust-gas decoupling, with E(B–V)* ≫ E(B–V)gas, therefore provides independent evidence that RPS is acting with a strong line-of-sight component and has already started to affect the ISM within the main body, even though the velocity offset between stars and ionized gas remains modest. This geometry naturally explains the lack of a canonical jellyfish morphology in optical images: if most of the stripped gas and dust lies between us and the galaxy, we would not see bright Hα tentacles trailing away from the disk on the sky; instead, the stripped material acts as a foreground screen reddening the stellar continuum, while the nebular emission traces less obscured pockets of ongoing star formation in the disk and inner tail.
 |
Fig. 10 Illustration of the likely evolutionary path described in this work. |
Expected E(B–V) values based on the FIR in the main body under idealized geometries.
4.2.3 Gas-phase budget in the stripped system
At face value, the multiwavelength data show that NGC 1427A currently hosts a substantial atomic reservoir but very little cold, CO-bright molecular gas, while its warm H2 and dust components remain prominent. Within the main body, MeerKAT yields an H I mass of log10(MHI/M⊙) ≃ 9.22 (see Table 3; Serra et al. 2024). In contrast, the ALMA Fornax survey detected no CO(1–0) emission from NGC 1427A (Zabel et al. 2019). For non-detections in the ALMA Fornax survey, Zabel et al. (2019) estimate 3σ upper limits on MH2 by assuming a Gaussian CO(1–0) line profile with FWHM = 50 km s−1 and adopting a metallicity- and sSFR-dependent CO-to-H2 conversion factor αCO from Accurso et al. (2017) (their Eq. (25)), converted to XCO following Bolatto et al. (2013). For NGC 1427A this yields an upper limit of log10(MH2/M⊙) < 7.42 at the survey distance of 19.95 Mpc; rescaled to our adopted 17 Mpc distance, this becomes log10(MH2/M⊙) < 7.28. For a galaxy with NGC 1427A’s stellar mass and SFR, the Accurso et al. (2017) prescription implies an αCO of the same order as, but plausibly higher than, the canonical Galactic value (αCO,MW ≃ 4.3 M⊙ [K km s−1 pc2]−1; Bolatto et al. 2013). Even allowing for such variations, the CO non-detection demonstrates that the cold, CO-bright molecular reservoir is small compared to the galaxy’s substantial H I mass. For metallicities comparable to those measured in the young star clusters by Mora et al. (2015), the inferred CO-based H2 upper limit would change by ~0.9 dex.
A further caveat is spatial filtering. For the compact ALMA configurations used in the Fornax survey, the largest recoverable scale at 115 GHz is ~25″, whereas the stellar and H I disks of NGC 1427A extend well beyond this and the bulk of the neutral gas (as well as Hα and FUV flux) is displaced toward the southwest relative to the optical center (Fig. 3). Zabel et al. (2019) explicitly note that, for this galaxy, diffuse CO emission on scales larger than ~25″ may be resolved out by the interferometer. Thus, the quoted upper limit strictly applies to CO(1–0) structures on scales ≲25″ (i.e., ~2–3 kpc at Fornax distance) within the primary beam; more extended, low-surface-brightness molecular gas associated with the outer, clumpy H I distribution could in principle escape detection, especially in the southwestern regions where the neutral gas column peaks.
Even allowing for this possibility, combining the compact ALMA limit with the strong H I reservoir still implies that any cold, CO-bright phase is subdominant: at face value the CO(1–0) non-detection gives MH2,CO/MHI ≲ 10−2, and even boosting MH2,CO by an order of magnitude to account for spatial filtering or enhanced metallicity would only bring MH2,CO/MHI into the ~0.1 regime. For comparison, in typical late-type galaxies the molecular phase typically contributes ~15% of the total cold gas mass (Boselli & Gavazzi 2006), and Virgo star-forming dwarfs show molecular-to-total gas fractions of ~9-38% (≃14% mean) despite the ongoing removal of their atomic and dust components by the cluster environment (Grossi et al. 2016; Boselli et al. 2014). NGC 1427A thus lies toward the extreme, H I-dominated end of the distribution of cluster star-forming dwarfs, with a cold CO-bright component that is at most comparable to, and likely lower than, the molecular fractions seen in Virgo and Herschel Reference Survey (Boselli et al. 2010) samples, even though its H I disk remains massive and extended.
4.2.4 Lessons from the presence of warm dust
Independent constraints from mid-infrared spectroscopy suggest that a substantial warm molecular component is present. Sivanandam et al. (2014) detect the H2 S(0) J=2→0 line at 28 μm in two IRS long-low apertures on NGC 1427A, but find no corresponding S(1) J=3→1 detection at 17 μm. They derive a 3σ upper limit on the S(1)/S(0) flux ratio of ≲0.4, whereas the other galaxies in their sample have S(1)/S(0) in the range ~2–6 and the SINGS galaxies show a median ratio of 3.1 (Roussel et al. 2007). In the SINGS sample, only three systems (NGC 24, NGC 1705, and NGC 4552) exhibit similarly low S(1)/S(0) ratios < 1.0; all three have low ortho-to-para ratios, 0.5 ≲ OPR ≲ 1.5, and relatively cool warm-H2 components with T ≃ 80–130 K (Roussel et al. 2007). By analogy, the stringent S(1)/S(0) limit in NGC 1427A most likely reflects a cool warmH2 phase with an ortho-to-para ratio below the LTE value of 3. This is consistent with H2 that formed in colder clouds and is now residing in a more diffuse, recently heated, low-density component where spin conversion is slow. For NGC 1427A, Sivanandam et al. (2014) infer a warm H2 mass lower limit of log10(MH2,warm/M⊙) ≳ 7.4 (Table 3), already exceeding the CO-based upper limit. Thus, even before accounting for any CO-dark component, the warm molecular phase contributes at least a few percent of the H I mass and plausibly dominates over the cold, CO-bright H2.
The low S(1)/S(0) ratio and implied low OPR in NGC 1427A therefore point to warm H2 that is either unusually cool or out of ortho-para equilibrium. In low-density gas, the ortho and para levels can remain decoupled for long times, so the OPR may stay “frozen” at its formation value rather than equilibrating to the high-temperature limit of three (Roussel et al. 2007; Sivanandam et al. 2014). This is qualitatively consistent with a scenario in which ram pressure and/or interaction-driven perturbations have already reached the ISM, dispersing or truncating the densest molecular clouds and leaving behind a diffuse, low-density warm-H2 component mixed with the extended H I. In this picture, a substantial fraction of the molecular material may reside in extended, only moderately heated layers or RPS-rarefied filaments, while compact, well-shielded CO-bright clumps have a low filling factor.
4.2.5 PAH signatures
The mid-infrared aromatic bands provide independent clues on how the dust-bearing phase has been processed. Here we use “PAH” in the usual observational sense, while noting that these features may trace a broader population of very small aromatic carbonaceous grains rather than a single family of isolated PAH molecules. In NGC 1427A the 6.2 and 11.3 μm bands are clearly detected, but the 7.7 μm feature is unusually weak in the spectrum: Sivanandam et al. (2014) constrain the PAH(7.7)/PAH(11.3) flux ratio to ≲1, well below the typical values of ~3–4 measured in normal star-forming galaxies (e.g., Smith et al. 2007b; Roussel et al. 2007). Models and observations of photodissociation regions (PDRs) show that mid-IR PAH ratios depend on charge state, size distribution, molecular structure, and radiation-field conditions; in broad terms, the 6.2 and 7.7 μm bands are enhanced in more ionized PAH populations, whereas the 11.3 μm band is stronger for more neutral aromatic grains (e.g., Draine & Li 2001; Flagey et al. 2006; Ogle et al. 2010; Maragkoudakis et al. 2020).
NGC 1427A also shows a high PAH(6.2)/PAH(7.7) ≳ 0.8, implying that the 7.7 μm complex is weak relative to both the 6.2 and 11.3 μm bands. This points to an unusual aromatic spectrum, but it does not uniquely determine the underlying grain-size distribution. Fine-structure line diagnostics show that the radiation field is not unusually hard: the [Ne III] 15.6 μm to [Ne II] 12.8 μm ratios are [Ne III]/[Ne II] ≲ 0.1 for the global extraction and ≲0.3 in the brightest region (Sivanandam et al. 2014, their Table 3), values characteristic of normal star-forming galaxies and well below those of AGN hosts with similarly depressed 7.7/11.3 μm ratios (e.g., Smith et al. 2007b). A plausible interpretation is therefore that the weak 7.7 μm complex reflects a processed aromatic and small-grain population rather than an unusually hard radiation field. This processing could involve changes in the PAH charge balance, changes in the grain-size distribution, or altered excitation and survival of small grains in stripped or shocked gas (e.g., Egorov et al. 2023; Chastenet et al. 2023). However, without access to the 3.3 μm feature, which provides a stronger constraint on the smallest aromatic grains (as clearly shown in Fig. 7 of Maragkoudakis et al. 2020), the low PAH(7.7)/PAH(11.3) ratio should not be interpreted as sufficient evidence for selective destruction of the smallest PAHs (see also Maragkoudakis et al. 2023; Tarantino et al. 2025).
The spatial information from the IRAC 8 μm map supports this picture. In the bright main body, the 8 μm emission wraps around the Hα knots, as expected for PAH-bearing material in and around dusty H II regions and adjacent PDRs. By contrast, some of the highest surface-brightness Hα clouds on the southeastern edge show little 8 μm emission (Sivanandam et al. 2014, and Fig. C.2), coincident with regions of elevated Hα velocity dispersion (Fig. 4). The outermost star-forming regions therefore appear relatively faint in aromatic and small-grain emission compared to Hα. This is broadly consistent with local processing of the dust-bearing ISM by stellar feedback, shocks, and/or stripping. Future narrow- and medium-band JWST near-infrared (NIR) and mid-infrared (MIR) observations could test this interpretation by mapping the 3.3, 7.7, and 11.3 μm features at sub-kiloparsec scales and comparing them with the MUSE and UVIT tracers of star formation and ionization (see Tarantino et al. 2025).
Taken together, the large H I reservoir, stringent CO(1–0) upper limit, and bright but cool warm-H2 emission indicate that the ISM in and around NGC 1427A is dominated by atomic gas and warm molecular material, while any cold CO-bright molecular component is comparatively limited. This does not require the absence of cold H2: in low-metallicity or porous media, H2 can survive in regions where CO is faint or photodissociated, producing a substantial CO-dark molecular component (e.g., Bolatto et al. 2013; Madden et al. 2020). The measured cold dust mass can be reconciled with the CO(1–0) non-detection. A global dust reservoir does not guarantee that the dust is distributed in compact, high-AV structures with sufficient local shielding to maintain an extended CO-bright phase, especially if the elevated star formation over the past ~Gyr has increased the porosity of the ISM and reduced the filling factor of well-shielded molecular clouds.
The low S(1)/S(0) ratio and likely non-equilibrium OPR point to warm H2 residing in a diffuse, low-density component that still preserves the spin distribution of its colder progenitor clouds. This phase balance is consistent with environmental processing acting on a low-mass system: ram pressure, repeated stellar feedback over the recent SFH, and/or a recent tidal perturbation can disperse dense gas, heat or shock molecular material, and reduce the filling factor of well-shielded CO-bright clouds. In this configuration, the ISM would be more susceptible to further stripping and less efficient at sustaining ongoing star formation, consistent with the declining SFRs presented in Sect. 3.5.
4.3 Tidal perturbations and the FCC229 flyby scenario
Beyond the global signatures of RPS discussed above, NGC 1427A exhibits a set of more localized, non-collisional features that are difficult to attribute to ICM-ISM interactions alone and instead point to a recent localized tidal perturbation.
4.3.1 Misalignment and global morphology
The first indication is a kinematic tilt between the stellar rotation axis and the cold and warm gas: both the H I and ionized-gas velocity fields are systematically misaligned with respect to the stellar component, with the gas disk clearly reoriented relative to the underlying stars. Such a configuration is naturally produced when a gravitational encounter torques the gaseous disk while leaving the more centrally concentrated stellar body largely intact, as seen in simulations of dwarf-dwarf interactions (e.g., Starkenburg et al. 2016; Zeng et al. 2024). In addition, the highest surface-density H, the bulk of the ionized gas, and the warm-dust emission are all displaced toward the southwest with respect to the stellar mass distribution. This off-center gas and dust concentration is difficult to obtain purely through interactions with the ICM wind, which tends to act more immediately on the outer disk (e.g., Kronberger et al. 2008), but follows naturally from an off-axis tidal perturbation that displaces the gaseous disk and compresses it locally as the perturber passes. We discuss below the potential effects at play in NGC 1427A.
4.3.2 Cluster tides, preprocessing, and galaxy–galaxy perturbations
The cluster-tide scenario of Mastropietro et al. (2021) is an important alternative to consider. In that framework, the NE–SW stellar and gaseous extension can arise from the combined action of the Fornax tidal field, galaxy rotation, orbital curvature, and RPS near pericenter, without requiring a specific nearby perturber. We distinguish this scenario from a broader form of environmental preprocessing: NGC 1427A may have been affected by interactions during infall through the Fornax environment without the central cluster potential being the dominant tidal agent. This distinction is important because mergers and close galaxy–galaxy encounters are expected to occur preferentially along filaments and cluster outskirts, where relative velocities are lower than in virialized cluster cores (e.g., Dulcien et al. 2026).
The deeper MeerKAT analysis of Serra et al. (2024) shifts the balance toward this latter picture. Compared to the older ATCA-based view, MeerKAT reveals a longer, more structured, and kinematically complex H I tail. Serra et al. (2024) argue that the global Fornax tidal field is unlikely to dominate the observed disturbance, and instead favor a high-speed encounter or advanced merger that tidally disturbed the gas before RPS shaped the extended tail. That event would have occurred on a timescale of at least a few times 108 yr and therefore should not be identified one-to-one with the more recent interaction discussed below.
Our MUSE and UVIT results add a shorter-timescale constraint. The FUV and Hα morphology, the off-center young component, and the present gas–star kinematic decoupling point to an additional recent, localized perturbation over the past ~30–100 Myr. We therefore favor a two-stage interpretation: an older galaxy–galaxy perturbation or merger, together with RPS, preconditioned the outer gas and produced the large-scale H I disturbance on timescales of at least a few 108 yr, while a more recent mild flyby, with FCC 229 as the favored projected candidate, may have modulated the current star-forming ISM over the past ~30–100 Myr.
4.3.3 FUV versus Hα: Location and timing of star formation episodes
A second line of evidence comes from the relative distribution of FUV and Hα emission. The only region that is clearly FUV-bright yet Hα-faint is the diffuse northeast extension (Fig. 2), located immediately east of the northern clump. This morphology is consistent with a fading star-formation episode on ~30–100 Myr timescales, older than the currently FUV- and Hα-bright sites concentrated in the main body. The absence of comparable FUV-only features elsewhere argues against a global trigger and instead points to a localized perturbation acting preferentially on the northeastern outer disk.
A schematic flyby scenario can account for this configuration: a close passage on the near, northeastern side of the disk could have compressed the outer gas layers and triggered star formation there. In this picture, the northern clump could mark the primary impact/compression site where star formation remains ongoing (traced by Hα), while the adjacent diffuse FUV-only emission would reflect an older, already fading episode. As the disk rotated and the perturber continued along its orbit toward the current projected southwest direction, the original impact region would not have had time to move far in azimuth. Adopting as reference the stellar rotation speed of ~20 km s−1 at a radial distance of 3 kpc (see Fig. 4), the northern FUV-bright region in Figure 1 would have azimuthally moved in 30–100 Myr counterclockwise by 12°−40°, i.e., less than a full quadrant.
The stellar population fits in the outer disk include a young, comparatively metal-poor component, suggesting that part of the fuel could have been low-metallicity gas, either preexisting at large radii or redistributed during an interaction. In the schematic recent flyby picture (≲100 Myr; Fig. 10), the most plausible perturbers are the nearby dwarfs discussed earlier (Table 2), with FCC229 being the most compelling candidate in projection for this recent localized component. On longer timescales of a few 108 yr, additional galaxies at larger projected separations (e.g., FCC 248, FDS6 100b, and FCC 247) provide plausible earlier interaction candidates that could have contributed to the prior gas decoupling required to produce the extended H I tail and detached clouds (Serra et al. 2024; Kleiner et al. 2025); however, their dynamical role remains uncertain in the absence of 3D orbit constraints. RPS can also enhance star formation through compression on the wind-facing side, but such enhancements typically act on a global scale (e.g., Kronberger et al. 2008; Steinhauser et al. 2016). We therefore interpret the northeastern FUV and Hα mismatch as the imprint of a locally triggered episode whose ionizing population has largely faded, superposed on the more global disturbance over both the CGM and ISM.
We stress that this flyby scenario is intended as a schematic, non-collisional complement to the ram-pressure picture; quantitative tests will require tailored hydrodynamical modeling and a more complete reconstruction of the interaction geometry and disk rotation curve.
4.3.4 Candidate perturber FCC 229
Among the nearby dwarfs discussed in Table 2, FCC 229 is the most plausible candidate for a recent tidal perturber in projection, lying to the southwest of NGC 1427A (Fig. 1). In deep NGFS imaging, its stellar body appears largely regular, with no obvious shells, streams, or strong asymmetries (Fig. C.1). This disfavors a very strongly disruptive encounter, but the absence of clear stellar debris is not a stringent constraint for dwarf spheroidals, which can remain photometrically smooth under tidal forcing for many dynamical times, particularly if dark-matter dominated (e.g., Fellhauer et al. 2008). We therefore treat the current morphology as consistent with a tidally mild flyby, and revisit this interpretation below in light of the nuclear structure of FCC 229.
The optical luminosity contrast should not be interpreted directly as the total encounter mass ratio. FCC 229 has M⋆ ≃ 107.6 M⊙, compared to M⋆ ≃ 109.3 M⊙ for NGC 1427A, corresponding to a stellar-mass ratio of order 50:1. However, for dwarf galaxies, the stellar-to-halo mass relation is steep and uncertain, and the total pre-infall halo mass contrast can be substantially less extreme than the stellar contrast alone suggests (down to order 5 : 1; e.g., Moster et al. 2013; Read et al. 2017). Even if FCC 229 has been tidally stripped, a dark-matter-dominated remnant could still perturb the outer gas disk of NGC 1427A without producing a strongly disrupted stellar morphology in FCC 229 itself. Simulations of dwarf tidal stripping show that the inner stellar body of dark-matter-dominated dwarfs can remain comparatively regular after substantial mass loss (e.g., Peñarrubia et al. 2008; Smith et al. 2013; Errani et al. 2022). Thus, FCC 229 is not ruled out by the optical mass contrast alone, although the interaction must have been mild and/or primarily affected the extended gaseous component.
In this configuration, enhanced recent star formation in NGC 1427A could arise primarily through tidal compression of its outer gas layers, inducing non-axisymmetric structure and promoting cloud collapse even in the absence of direct gas–gas collisions. A secondary possibility is that FCC 229 carried some gas at pericenter, allowing additional hydrodynamic interaction with the outer H I disk of NGC 1427A and potentially contributing low-metallicity fuel. However, the present-day optical morphology of FCC229 and the lack of an obvious associated starburst argue that, if FCC 229 was gas-bearing, it likely contained only a modest and/or diffuse reservoir at the time of the encounter, which is not constrained by existing data. Conversely, if the flyby involved substantial gas–gas interaction at relative velocities of a few 102 km s−1, one might expect stronger, more conspicuous star formation signatures and/or kinematic components tied to the perturber; testing this requires tailored simulations and deeper gas observations.
A simple timescale estimate supports the plausibility of a recent encounter. Adopting the projected separation between FCC229 and NGC 1427A, d ≃ 20 kpc, and a characteristic relative velocity of order the Fornax velocity dispersion, Δv ~ σ ≃ 350 km s−1 (Schuberth et al. 2010; Chaturvedi et al. 2022), yields tfb ~ d/Δv ≃ 55 Myr. Given the large uncertainty in the true 3D separation and relative velocity, this should be regarded as an order-of-magnitude consistency check, but it matches the ~30–100 Myr timescale implied by the fading FUV-only episode (Sect. 4.4; Fig. 7).
The internal structure of FCC 229 is compatible with, but not diagnostic of, mild tidal perturbation. Morphological modeling reveals a compact nuclear component (mi′ ≃ 23.5) offset by ~1″ (~80–100 pc) from the center of the best-fitting Sérsic profile in g′ and i′ (Fig. C.1). In low-mass galaxies, nuclear star clusters can remain displaced for many dynamical times after tidal perturbations because of long dynamical-friction timescales in low-density (and potentially cored) potentials (e.g., Bellovary et al. 2021; Fahrion et al. 2021; Poulain et al. 2025). The putative NSC has colors consistent with the inner galaxy light, arguing against an extremely young nuclear starburst. While not definitive on its own, the combination of a modest nuclear offset with an otherwise regular stellar morphology is compatible with FCC 229 having experienced a recent, tidally mild encounter.
Ultimately, the gas content and dynamical impact of FCC229 remain weakly constrained with current data. Deeper HI and CO observations and spectroscopy of FCC229 are required to test whether it carried gas at pericenter and to place tighter constraints on the interaction strength and timing.
4.4 Star formation rate properties of NGC 1427A
The SFH of NGC 1427A is best interpreted by combining tracers that probe different timescales. Hα emission is sensitive to the massive O-type stars and therefore traces star formation over the last ~10 Myr (with mean age ~3 Myr). The FUV continuum responds to stars of somewhat lower mass and integrates star formation over the past ~100 Myr (with mean age ~10 Myr; Kennicutt & Evans 2012). Our pPXF stellar-population modeling infers older stellar population ages (log[Age] ≲ 10.4, see Fig. 7) and includes youngest templates with ages of ~30 Myr.
The resolved SFMS provides a stringent sub-kiloparsec diagnostic of how efficiently different patches of the NGC 1427A disk are converting gas into stars at a fixed underlying stellar surface density and therefore whether environmental processing is acting as a smooth “global dimmer” or as a highly structured local phenomenon. The kernel-density estimate distribution of the Hα-based SFR surface density relation ΣSFR-Σ* in Figure 11a peaks at ≳1σ below the SFMS of Cano-Díaz et al. (2016), but is noticeably skewed toward enhanced ΣSFR. This implies that widespread regions are forming stars inefficiently, while a smaller subset still hosts locally boosted, high-ΣSFR clumps. In the flyby + first-infall picture, this combination is expected as a recent satellite encounter can torque/displace the gaseous disk and produce localized compression (feeding the high-ΣSFR tail), while the onset of ICM interaction during first infall simultaneously strips/shreds the ISM and suppresses star formation over much of the disk (shifting the mode of the distribution below the ridge line).
4.4.1 SFRs from multi-timescale indicators
Viewed together, the three SFR tracers (Hα, FUV, pPXF stellar population modeling) reveal a coherent temporal sequence of the SFH. The youngest pPXF bin indicates that the most recent burst was ~3σ above the SFMS at the recently formed M* (see Fig. 11), i.e., NGC 1427A experienced a strong star-formation burst when integrated over the last ~30–40 Myr. The FUV-based SFR places the galaxy on or slightly below the local SFMS, while the Hα-based estimate lies ~1σ below it. This ordering therefore points to a system whose SFR has peaked within the past few tens of millions of years and is declining on a similar timescale. In combination with the evidence for a displaced, disturbed ISM, this trend suggests that NGC 1427A is entering an environmentally driven quenching phase.
A caveat in comparing SFRFUV and SFRHα is the dust geometry. In this work we assume E(B–V)FUV = E(B–V)gas (Sect. 3.5; Appendix C.1), i.e., the young stellar continuum and nebular gas suffer the same dust attenuation. If RPS and stellar feedback clear dust and gas more efficiently along sightlines to the very youngest, Hα-emitting regions than toward the slightly older FUV-bright populations, then the Balmer decrement would trace a lower effective attenuation than the FUV continuum. In that case, our FUV attenuation would be overestimated and SFRFUV biased low, implying that the true decline from pPXF → FUV → Hα is at least as strong as observed, and possibly more pronounced.
 |
Fig. 11 (a) Resolved SFMS kernel-density estimate (KDE): dust-corrected Hα-based ΣSFR versus Σ⋆ for Voronoi bins. Solid and dashed lines show the best-fit resolved SFMS and ±1σ envelope from Cano-Díaz et al. (2016). (b) Integrated SFMS for the whole galaxy, main body, and northern clump compared to the local SFMS (Cano-Díaz et al. 2016). Filled circles: Hα-based SFRs (Appendix B); open circles: FUV-based SFRs (Appendix C.1). Triangles show the pPXF-inferred mean SFR in the youngest SFH bin (30 Myr template, which integrates over the past ~40 Myr). |
4.4.2 Global and resolved star-forming main sequence
On integrated scales, the three apertures (whole galaxy, main body, and northern clump) follow a consistent pattern relative to the global SFMS (Fig. 11b). As summarized in Table 3 and Sect. 3.5, the FUV-based SFRs place NGC 1427A on or only slightly below the local SFMS of Cano-Díaz et al. (2016), whereas the Hα-based values sit ~1σ below the relation. The main body follows the same behavior, and the northern clump shows a slightly stronger suppression in Hα, consistent with enhanced stripping in the outskirts. Visually, the fact that FUV-based SFRs (open symbols in Fig. 11b) lie systematically closer to the SFMS ridge line than Hα-based SFRs (filled symbols) provides a compact representation of the temporal SFR decline mentioned above. The pPXF-based SFRs (triangles) sit substantially above the SFMS, reflecting the much higher SFR when integrated over the last ~40 Myr compared to the present-day Hα and FUV indicators.
The fact that the resolved offset is larger than the integrated one further indicates that the environmental impact is patchy (and therefore partially “averaged out” in global apertures), consistent with the integrated behavior where FUV places the galaxy near the SFMS while Hα lies ~1σ lower, which implies a recent decline on ≲100 Myr timescales superposed on spatially intermittent and interaction-triggered star formation. Part of this offset may simply reflect that the reference resolved SFMS from Cano-Díaz et al. (2016) is dominated by more massive, more metal-rich disks, which can exhibit higher star-formation efficiencies at fixed Σ*. Nonetheless, this systematic does not affect the central result, i.e., the distribution’s shape in Figure 11a remains a robust signature of spatially heterogeneous star formation in NGC 1427A.
4.4.3 Effects on star formation from cluster infall
On longer timescales, the pPXF-based SFH Indicates an underlying old stellar population plus a prolonged episode of moderately elevated star formation over the last ~1 Gyr at ![Mathematical equation: $\[\dot{M}_{*}\]$](/articles/aa/full_html/2026/08/aa59045-26/aa59045-26-eq11.png) ≈ (3-4) × 10−2 M⊙ yr−1. The youngest pPXF bin and the FUV and Hα tracers together reveal a strong recent burst in the last ~30-40 Myr followed by a current decline, i.e., a transition from burst to quenching. This kind of gigayear-scale enhancement with shorter-lived, spatially migrating starbursts is reminiscent of the behavior seen in nearby dwarf galaxies (e.g., McQuinn et al. 2010), and is echoed in NGC 1427A by the mix of FUV-bright but Hα-faint and FUV-faint but Hα-bright regions across the galaxy (Fig. 2).
≈ (3-4) × 10−2 M⊙ yr−1. The youngest pPXF bin and the FUV and Hα tracers together reveal a strong recent burst in the last ~30-40 Myr followed by a current decline, i.e., a transition from burst to quenching. This kind of gigayear-scale enhancement with shorter-lived, spatially migrating starbursts is reminiscent of the behavior seen in nearby dwarf galaxies (e.g., McQuinn et al. 2010), and is echoed in NGC 1427A by the mix of FUV-bright but Hα-faint and FUV-faint but Hα-bright regions across the galaxy (Fig. 2).
These internal SFH signatures are naturally embedded in a larger-scale infall scenario. The accretion of galaxies into clusters is expected to be anisotropic, occurring preferentially along filaments and planar structures within the surrounding dark matter distribution. Recent work on the spatial and kinematic distribution of Fornax globular clusters in galaxies and in the intra-cluster population reveals coherent structures, some filament-like, extending toward the southeastern region from which NGC 1427A may be approaching (e.g., D’Abrusco et al. 2025; Chaturvedi et al. 2022). NGC 1427A’s elevated SFR over the past ~1 Gyr could reflect the period during which it was entering and traveling along a filament, with an increased occurrence of encounters with other dwarfs, boosting star formation (Stierwalt et al. 2015) or experiencing preprocessing in general. Internal secular mechanisms (e.g., bar-driven inflows) could in principle contribute, but bars are expected to be uncommon at NGC 1427A’s low stellar mass, and we do not see an obvious bar signature in the optical morphology (e.g., Méndez-Abreu et al. 2011). In this view, the ~1 Gyr scale elevated SFR marks an earlier infall and preprocessing stage that plausibly set the initial conditions for the more recent, shorter-timescale evolution discussed in Sects. 4.2.3 and 4.3 (Fig. 10).
 |
Fig. 12 Stellar mass-stellar metallicity plane. Blue line and band: SDSS stellar mass-metallicity relation from Gallazzi et al. (2005). Gray dotted line: dwarf–galaxy relation from Kirby et al. (2013), converted to total metallicity and stellar mass as discussed in the text. Colored symbols: NGC 1427A measurements in three apertures (gold = whole galaxy; green = main body; purple = northern clump). Filled circles show pPXF mass-weighted metallicities ⟨[Z/H]⟩MW; open circles show light-weighted values ⟨[Z/H]⟩LW, with vertical connectors. |
4.5 Stellar metallicity in context
Figure 12 places the stellar metallicities of NGC 1427A on the stellar mass-metallicity plane relative to two widely used, but methodologically distinct, reference relations: (i) the light-weighted SDSS relation of Gallazzi et al. (2005) and (ii) the Local Group dwarf relation of Kirby et al. (2013), converted from luminosity to stellar mass and from [Fe/H] to total metallicity using a constant [α/Fe] = 0.2 dex, following Romero-Gómez et al. (2023). For each of our apertures (whole galaxy, main body, northern clump), we plot both light-weighted (LW) and mass-weighted (MW) values derived with pPXF.
Across all apertures we find ⟨[Z/H]⟩LW > ⟨[Z/H]⟩MW by ~0.4–0.5 dex (Table 3). This offset reflects a luminous young component superposed on an old, more metal-poor stellar body, consistent with the age structure discussed in Sect. 3.3. For the whole-galaxy aperture, NGC 1427A’s light-weighted metallicity falls slightly below the median SDSS mass-metallicity relation of Gallazzi et al. (2005) and the Kirby et al. (2013) Local Group dwarf sequence, which are mutually consistent at this mass. The outer regions of the galaxy, including the northern clump, are on average more metal-poor.
The northern clump is indeed slightly more metal-poor by ~0.2 dex (in both LW and MW values), but still lies within the scatter of dwarf mass-metallicity relations. Together with its regular stellar and gas kinematics and the lack of enhanced velocity dispersion, this disfavors the interpretation of the clump as a separate dwarf currently merging with NGC 1427A. Instead, its metallicity and kinematics are compatible with it being an off-center star-forming region within the same system, plausibly linked to the recent flyby discussed in Section 4.3.
Independent constraints from star clusters support this picture of enrichment. Georgiev et al. (2006) find old globular clusters around NGC 1427A with typical sub-solar metallicities, indicating that the early assembly of the system proceeded from metal-poor gas, as in other low-mass dwarfs. In contrast, Mora et al. (2015) reported near-solar metallicities for young star clusters associated with the current starburst, with a complete picture of the star clusters presented by Fahrion et al. (2026). Our pPXF inferred SFHs show the two components (see marginal metallicity histograms in Fig. 7), as well as the marked differences between MW and LW measurements. This combination suggests that NGC 1427A remained overall metal-poor for its mass, likely due to a history of metal-loaded outflows in the field phase and, more recently, formed stars in star cluster complexes that efficiently retained their metals, and dominated the fraction of star formation as suggested by Mora et al. (2015).
Methodological differences between the reference relations and our pPXF-based estimates, as well as uncertainties in the [Fe/H]-to-[Z/H] conversion, may shift the absolute metallicity scale by ~0.1 dex, but do not alter this qualitative scenario.
5 Summary and conclusions
We have presented a spatially resolved multiphase view of the Fornax dwarf NGC 1427A combining a custom-reduced four-field VLT/MUSE mosaic with optical, FUV, IR, and MeerKAT H I data. Our aim was to characterize how RPS and tidal perturbations jointly transform a gas-rich star-forming dwarf during first infall into the Fornax cluster. In the following, we summarize our work and provide conclusions:
Resolved benchmark for early dwarf transformation in Fornax: NGC 1427A is a gas-rich, actively star-forming dwarf galaxy with a disturbed “cometary” stellar body, a long one-sided H I tail, a secondary short H I feature, and an extended low-surface-brightness envelope. Deep imaging (e.g., Muñoz et al. 2015; Iodice et al. 2016) and the MeerKAT census of disturbed gas-rich Fornax dwarfs (Serra et al. 2023; Kleiner et al. 2023) have revealed a nearby sample of systems caught during transformation. NGC 1427A’s surface brightness and our spatially complete MUSE mosaic make it an unusually clean resolved benchmark for studying the onset of cluster-driven transformation in low-mass galaxies. Our four-field MUSE mosaic provides contiguous coverage of the main body and outskirts with homogeneous reduction and robust sky subtraction. Together with AstroSat/UVIT FUV imaging, NGFS optical imaging, Spitzer/Herschel dust and gas tracers, and MeerKAT H I observations, this mosaic allowed us to map stellar populations, ionized gas, neutral gas, and dust, deriving stellar and gas kinematics, extinction, ages, metallicities, and ΣSFR in a self-consistent way;
-
Global environmental picture: NGC 1427A is affected by both ram-pressure stripping and tidal perturbations. It shows a clear misalignment between the stellar and gaseous kinematics. A simple characterization of the large-scale velocity gradients (see Appendix D) yields kinematic major-axis position angles of 63.6° ± 1.4° for the stars, 91.4° ± 0.5° for Hα, and 102.0° ± 1.8° for H I. These values confirm that both gas phases are significantly tilted with respect to the stars while remaining mostly aligned with each other. Furthermore, the H I gas is globally blueshifted, and the Hα velocities are skewed blueward, with the median marginally offset from the stars, indicating that a substantial fraction of the disk gas is currently being removed with a significant line-of-sight component toward us. The comparison of stellar and nebular attenuation with IR dust tracers showed that dust and gas are displaced in front of the old stellar body but remain tightly coupled to the ionized gas where the surface brightness is high. This is expected if the collisional components in the inner disk and ISM are being compressed and stripped along the line of sight.
The long, mostly starless MeerKAT H I tail lies roughly in the plane of the sky and points toward the anti-cluster-center direction. Together with the modest cluster tidal field, this identifies RPS by the Fornax ICM as the dominant driver of the extended gas removal from the circumgalactic and outer-disk regions over the past few hundred million years. As argued by Serra et al. (2024), the absence of a strongly compressed leading edge in projection during this earlier more plane-of-sky phase suggests that an additional mechanism had already decoupled and stirred the outer gas, making it easier for the ICM to peel off. Our MUSE-based dust and kinematic diagnostics add a complementary view of the current orbital phase: While the outer H I tail traces gas removed earlier along a stripping direction with a stronger plane-of-sky component, the displaced dusty and ionized ISM in the inner body indicates that the present stripping geometry has acquired a substantial line-of-sight component toward the observer. In this sense, the outer tail and the dusty inner ISM do not trace the same instantaneous geometry but different stages of a curved infall through the Fornax potential. In this work, we have identified and characterized a plausible tidal perturber; we provide a summary of this finding in the next item;
A localized tidal perturbation: FCC 229 is the favored nearby candidate for the recent perturber. Beyond RPS alone, there are indications of a global decoupling between the gas and stars. These include the kinematic misalignment, the southwestern pile-up of high-density H I, ionized gas, and warm dust offset from the stellar mass peak, and the exclusively northeastern FUV-bright and Hα-faint extension. Together with the arguments of Serra et al. (2024) for early circumgalactic disturbance, these observations point to an additional tidal perturbation. We considered the cluster-tide scenario of Mastropietro et al. (2021); however, the deeper MeerKAT analysis favors a galaxy–galaxy tidal perturbation or a merger plus RPS over a dominant role for the global Fornax tidal field. Within this broader picture, FCC 229 is the favored nearby candidate for the recent localized component based on its projected alignment, crossing-time estimate, and internal structure;
-
Star formation: a recent burst followed by an early decline is consistent with the onset of quenching. Multi-timescale SFR tracers (pPXF, FUV, and Hα) reveal a coherent temporal sequence. The youngest SFH bin (~30–40 Myr from pPXF) implies a recent SFR peak ~3σ above the SFMS at the current stellar mass. The FUV-based SFR lies on or slightly below the local SFMS, with the caveat that our assumption E(B–V)FUV = E(B–V)gas may underestimate the true FUV attenuation if RPS clears dust preferentially around the youngest Hα-emitting regions. The Hα-based SFR falls ~1σ below the SFMS, indicating that the instantaneous SFR has already declined from the recent peak.
Resolved SFR maps show NGC 1427A moving from a bursty phase toward quenching, with the northern clump exhibiting slightly stronger Hα suppression, as expected for an outer region that is more easily stripped and heated. Over the past ~1 Gyr, the SFH points to a prolonged episode of moderately elevated SFR (~3-4 × 10⁻² M⊙ yr−1), consistent with the migrating starburst behavior seen in other dwarfs (e.g., McQuinn et al. 2010) and plausibly fostered by interactions as NGC 1427A traveled along a filament into Fornax. As the galaxy plunges deeper into the ICM, the combination of ongoing RPS and the prior flyby explains both the strong recent burst and the present-day drop in Hα-traced SFR, marking the onset of environmentally driven quenching as the ISM begins to be stripped and heated;
Metallicity structure: A luminous young, enriched component lies on top of an older metal-poor body. Light-weighted metallicities exceed mass-weighted values by ~0.4–0.5 dex, implying that recent star formation dominates the light while an older more metal-poor component dominates the mass. On the mass-metallicity plane, the galaxy remains modestly metal poor for its mass, consistent with metal-loaded outflows in the pre-infall phase and efficient metal retention in compact star-forming complexes in the recent burst.
The multiphase morphology, kinematics, extinction geometry, and time-resolved star formation together suggest the following sequence (Fig. 10). NGC 1427A likely formed as a gas-rich metal-poor dwarf and experienced elevated spatially migrating star formation over the past ~1 Gyr, plausibly aided by increased encounter rates as it moved from the field into a denser infall environment. An earlier galaxy–galaxy perturbation or merger, as favored by Serra et al. (2024), may have decoupled the gas and facilitated stripping of the CGM and outer disk over the past few hundred million years via RPS by the Fornax ICM, producing the long and largely starless H I tail. More recently (~30–100 Myr), a mild localized flyby, plausibly involving FCC 229, may have helped torque and displace the gaseous disk, triggering a localized burst in the northeast outer disk and later activity in the main body and in the southwest while further decoupling collisional phases from the old stellar body.
At the present epoch (over the past few tens of millions of years), RPS is no longer acting only on the circumgalactic gas but has reached the inner ISM. The gas disk is misaligned, partially stripped, and shifted in front of the stars; the ionized, neutral, and dusty components are decoupled from the old stellar body; and the instantaneous SFR has declined below the SFMS. These signatures mark the onset of environmentally driven quenching, as stripping, heating, and gas removal begin to directly affect the star-forming ISM. Continued interaction with the ICM is expected to exhaust and remove the remaining cold gas, leaving a quenched, gas-poor Fornax dwarf whose subsequent evolution is dominated by the collisionless components.
This reconstruction should be read as the most consistent scenario allowed by the currently available multiphase data, not as a unique dynamical solution. As also emphasized by Serra et al. (2024), NGC 1427A is a complex system, and the relative timing and strength of the evolutionary drivers remain uncertain. JWST observations of the dust-bearing ISM and a direct TRGB distance to NGC 1427A would be especially valuable for constraining its three-dimensional location, the role of cluster tides, and the progression of RPS from the CGM into the ISM. As a spatially resolved snapshot of this transition, NGC 1427A provides a benchmark for mixed RPS+tidal pathways in low-mass cluster satellites.
Data availability
The reduced and calibrated VLT/MUSE mosaic data cube of NGC 1427A and its associated white-light image are available through the ESO Science Archive under the Phase 3 collection NGC1427A_MUSE-Deep: https://doi.org/10.18727/archive/109. The advanced data products derived from the analysis pipeline, including stellar-continuum and emissionline maps, binned products, and related value-added products, are available from the corresponding author upon reasonable request.
Acknowledgements
We thank the referee for constructive comments that improved the clarity and balance of the manuscript. JPC thanks the ISM* group at STScI for valuable discussions on ISM tracers, dust, and PAH diagnostics. This work is based on observations collected at ESO/Paranal with VLT/MUSE (programs listed in Table 1) and makes use of archival data from HST (MAST), AstroSat/UVIT (ISSDC), Spitzer (IRSA), Herschel, MeerKAT (SARAO; MeerKAT Fornax Survey products), NGFS/DECam (CTIO/NOIRLab), and public SRG/eROSITA survey products. We made use of ASTROPY (Astropy Collaboration 2013, 2018, 2022), MPDAF (Bacon et al. 2016), ZAP (Soto et al. 2016), and PPXF/VORBIN (Cappellari & Copin 2003; Cappellari 2017). We acknowledge support from the Agencia Nacional de Investigación y Desarrollo (ANID) (CATA-Basal FB210003; Beca Doctorado Nacional for RR and JPC; Proyecto Fondecyt Regular 1231345 for JC). KF acknowledges funding from the EU Horizon 2020 Marie Skłodowska-Curie program (grant No. 101103830). YOB acknowledges support from ESO Comité Mixto 2024.
References
- Accurso, G., Saintonge, A., Catinella, B., et al. 2017, MNRAS, 470, 4750 [NASA ADS] [Google Scholar]
- Anand, G. S., Tully, R. B., Cohen, Y., et al. 2024, ApJ, 973, 83 [Google Scholar]
- Astropy Collaboration (Robitaille, T. P., et al.) 2013, A&A, 558, A33 [NASA ADS] [CrossRef] [EDP Sciences] [Google Scholar]
- Astropy Collaboration (Price-Whelan, A. M., et al.) 2018, AJ, 156, 123 [Google Scholar]
- Astropy Collaboration (Price-Whelan, A. M., et al.) 2022, ApJ, 935, 167 [NASA ADS] [CrossRef] [Google Scholar]
- Bacon, R., Piqueras, L., Conseil, S., Richard, J., & Shepherd, M. 2016, Astrophysics Source Code Library [record ascl:1611.003] [Google Scholar]
- Belfiore, F., Westfall, K. B., Schaefer, A., et al. 2019, AJ, 158, 160 [CrossRef] [Google Scholar]
- Bellhouse, C., Jaffé, Y. L., McGee, S. L., et al. 2019, MNRAS, 485, 1157 [Google Scholar]
- Bellovary, J. M., Hayoune, S., Chafla, K., et al. 2021, MNRAS, 505, 5129 [NASA ADS] [CrossRef] [Google Scholar]
- Benítez-Llambay, A., Navarro, J. F., Abadi, M. G., et al. 2013, ApJ, 763, L41 [Google Scholar]
- Binggeli, B., Barazza, F., & Jerjen, H. 2000, A&A, 359, 447 [NASA ADS] [Google Scholar]
- Bittner, A., Falcón-Barroso, J., Nedelchev, B., et al. 2019, A&A, 628, A117 [NASA ADS] [CrossRef] [EDP Sciences] [Google Scholar]
- Blakeslee, J. P., Jordán, A., Mei, S., et al. 2009, ApJ, 694, 556 [Google Scholar]
- Blaña, M., Puzia, T. H., Ordenes-Briceño, Y., et al. 2025, A&A, 699, A69 [NASA ADS] [CrossRef] [EDP Sciences] [Google Scholar]
- Bolatto, A. D., Wolfire, M., & Leroy, A. K. 2013, ARA&A, 51, 207 [Google Scholar]
- Boselli, A., & Gavazzi, G. 2006, PASP, 118, 517 [Google Scholar]
- Boselli, A., Eales, S., Cortese, L., et al. 2010, PASP, 122, 261 [Google Scholar]
- Boselli, A., Cortese, L., Boquien, M., et al. 2014, A&A, 564, A67 [NASA ADS] [CrossRef] [EDP Sciences] [Google Scholar]
- Boselli, A., Fossati, M., & Sun, M. 2022, A&A Rev., 30, 3 [Google Scholar]
- Brown, T., Roberts, I. D., Thorp, M., et al. 2023, ApJ, 956, 37 [NASA ADS] [CrossRef] [Google Scholar]
- Calzetti, D. 2001, PASP, 113, 1449 [Google Scholar]
- Calzetti, D., Armus, L., Bohlin, R. C., et al. 2000, ApJ, 533, 682 [NASA ADS] [CrossRef] [Google Scholar]
- Cano-Díaz, M., Sánchez, S. F., Zibetti, S., et al. 2016, ApJ, 821, L26 [Google Scholar]
- Cappellari, M. 2017, MNRAS, 466, 798 [Google Scholar]
- Cappellari, M., & Copin, Y. 2003, MNRAS, 342, 345 [Google Scholar]
- Cappellari, M., & Emsellem, E. 2004, PASP, 116, 138 [Google Scholar]
- Cardelli, J. A., Clayton, G. C., & Mathis, J. S. 1989, ApJ, 345, 245 [Google Scholar]
- Chabrier, G. 2003, PASP, 115, 763 [Google Scholar]
- Chamba, N., Hayes, M. J., & LSST Dark Energy Science Collaboration. 2024, A&A, 689, A28 [NASA ADS] [CrossRef] [EDP Sciences] [Google Scholar]
- Chanamé, J., Infante, L., & Reisenegger, A. 2000, ApJ, 530, 96 [CrossRef] [Google Scholar]
- Charlot, S., & Fall, S. M. 2000, ApJ, 539, 718 [Google Scholar]
- Chastenet, J., Sutter, J., Sandstrom, K., et al. 2023, ApJ, 944, L12 [NASA ADS] [CrossRef] [Google Scholar]
- Chaturvedi, A., Hilker, M., Cantiello, M., et al. 2022, A&A, 657, A93 [NASA ADS] [CrossRef] [EDP Sciences] [Google Scholar]
- Chomiuk, L., & Povich, M. S. 2011, AJ, 142, 197 [Google Scholar]
- Cortese, L., Catinella, B., & Smith, R. 2021, PASA, 38, e035 [NASA ADS] [CrossRef] [Google Scholar]
- D’Abrusco, R., Mirabile, M., Cantiello, M., et al. 2025, arXiv e-prints [arXiv:2511.01576] [Google Scholar]
- Disney, M., Davies, J., & Phillipps, S. 1989, MNRAS, 239, 939 [NASA ADS] [CrossRef] [Google Scholar]
- Draine, B. T. 2003, ARA&A, 41, 241 [Google Scholar]
- Draine, B. T., & Li, A. 2001, ApJ, 551, 807 [NASA ADS] [CrossRef] [Google Scholar]
- Drinkwater, M. J., Gregg, M. D., & Colless, M. 2001a, ApJ, 548, L139 [Google Scholar]
- Drinkwater, M. J., Gregg, M. D., Holman, B. A., & Brown, M. J. I. 2001b, MNRAS, 326, 1076 [Google Scholar]
- Dulcien, C., Jaffe, Y. L., Crossett, J. P., et al. 2026, Caught in the Web: Galaxy Mergers along Cosmic Filaments [Google Scholar]
- Ebeling, H., Stephenson, L. N., & Edge, A. C. 2014, ApJ, 781, L40 [Google Scholar]
- Egorov, O. V., Kreckel, K., Sandstrom, K. M., et al. 2023, ApJ, 944, L16 [NASA ADS] [CrossRef] [Google Scholar]
- Eigenthaler, P., Puzia, T. H., Taylor, M. A., et al. 2018, ApJ, 855, 142 [Google Scholar]
- Emsellem, E., Schinnerer, E., Santoro, F., et al. 2022, A&A, 659, A191 [NASA ADS] [CrossRef] [EDP Sciences] [Google Scholar]
- Errani, R., Navarro, J. F., Ibata, R., & Peñarrubia, J. 2022, MNRAS, 511, 6001 [Google Scholar]
- Fahrion, K., Lyubenova, M., van de Ven, G., et al. 2021, A&A, 650, A137 [NASA ADS] [CrossRef] [EDP Sciences] [Google Scholar]
- Fahrion, K., Hilker, M., Chaturvedi, A., Carvajal, J. P., & Puzia, T. H. 2026, A&A, 712, A28 [NASA ADS] [CrossRef] [EDP Sciences] [Google Scholar]
- Fellhauer, M., Wilkinson, M. I., Evans, N. W., et al. 2008, MNRAS, 385, 1095 [Google Scholar]
- Ferguson, H. C. 1989, AJ, 98, 367 [Google Scholar]
- Flagey, N., Boulanger, F., Verstraete, L., et al. 2006, A&A, 453, 969 [NASA ADS] [CrossRef] [EDP Sciences] [Google Scholar]
- Fuller, C., Davies, J. I., Auld, R., et al. 2014, MNRAS, 440, 1571 [Google Scholar]
- Gadotti, D. A., Sánchez-Blázquez, P., Falcón-Barroso, J., et al. 2019, MNRAS, 482, 506 [Google Scholar]
- Gallazzi, A., Charlot, S., Brinchmann, J., White, S. D. M., & Tremonti, C. A. 2005, MNRAS, 362, 41 [Google Scholar]
- Georgiev, I. Y., Hilker, M., Puzia, T. H., et al. 2006, A&A, 452, 141 [NASA ADS] [CrossRef] [EDP Sciences] [Google Scholar]
- Ghosh, R., Dutta, A., & Sharma, P. 2024, MNRAS, 531, 3445 [NASA ADS] [CrossRef] [Google Scholar]
- Gordon, K. D., Clayton, G. C., Misselt, K. A., Landolt, A. U., & Wolff, M. J. 2003, ApJ, 594, 279 [NASA ADS] [CrossRef] [Google Scholar]
- Grossi, M., Corbelli, E., Bizzocchi, L., et al. 2016, A&A, 590, A27 [NASA ADS] [CrossRef] [EDP Sciences] [Google Scholar]
- Hanuschik, R. W. 2003, A&A, 407, 1157 [NASA ADS] [CrossRef] [EDP Sciences] [Google Scholar]
- Helou, G., Roussel, H., Appleton, P., et al. 2004, ApJS, 154, 253 [NASA ADS] [CrossRef] [Google Scholar]
- Hilker, M., Bomans, D. J., Infante, L., & Kissler-Patig, M. 1997, NGC 1427A – An LMC Type Galaxy in the Fornax Cluster [Google Scholar]
- Holmberg, E. 1958, Meddelanden fran Lunds Astron. Observ. II, 136, 1 [Google Scholar]
- Iodice, E., Capaccioli, M., Grado, A., et al. 2016, ApJ, 820, 42 [Google Scholar]
- Kennicutt, R. C., & Evans, N. J. 2012, ARA&A, 50, 531 [Google Scholar]
- Kirby, E. N., Cohen, J. G., Guhathakurta, P., et al. 2013, ApJ, 779, 102 [Google Scholar]
- Kleiner, D., Serra, P., Maccagni, F. M., et al. 2023, A&A, 675, A108 [NASA ADS] [CrossRef] [EDP Sciences] [Google Scholar]
- Kleiner, D., Serra, P., Loni, A., et al. 2025, A&A, 704, A350 [NASA ADS] [CrossRef] [EDP Sciences] [Google Scholar]
- Kronberger, T., Kapferer, W., Ferrari, C., Unterguggenberger, S., & Schindler, S. 2008, A&A, 481, 337 [NASA ADS] [CrossRef] [EDP Sciences] [Google Scholar]
- Lee-Waddell, K., Serra, P., Koribalski, B., et al. 2018, MNRAS, 474, 1108 [Google Scholar]
- Loni, A., Serra, P., Kleiner, D., et al. 2021, A&A, 648, A31 [NASA ADS] [CrossRef] [EDP Sciences] [Google Scholar]
- Madden, S. C., Cormier, D., Hony, S., et al. 2020, A&A, 643, A141 [NASA ADS] [CrossRef] [EDP Sciences] [Google Scholar]
- Maragkoudakis, A., Peeters, E., & Ricca, A. 2020, MNRAS, 494, 642 [NASA ADS] [CrossRef] [Google Scholar]
- Maragkoudakis, A., Peeters, E., Ricca, A., & Boersma, C. 2023, MNRAS, 524, 3429 [Google Scholar]
- Mastropietro, M., De Rijcke, S., & Peletier, R. F. 2021, MNRAS, 504, 3387 [NASA ADS] [CrossRef] [Google Scholar]
- Mayer, L., Mastropietro, C., Wadsley, J., Stadel, J., & Moore, B. 2006, MNRAS, 369, 1021 [NASA ADS] [CrossRef] [Google Scholar]
- McQuinn, K. B. W., Skillman, E. D., Cannon, J. M., et al. 2009, ApJ, 695, 561 [Google Scholar]
- McQuinn, K. B. W., Skillman, E. D., Cannon, J. M., et al. 2010, ApJ, 724, 49 [NASA ADS] [CrossRef] [Google Scholar]
- Méndez-Abreu, J., Sánchez-Janssen, R., & Aguerri, J. A. L. 2011, in EAS Publications Series, 48 (eprint: [arXiv:1009.3221]: EDP), 305 [Google Scholar]
- Mieske, S., Hilker, M., Infante, L., & Mendes de Oliveira, C. 2007, A&A, 463, 503 [NASA ADS] [CrossRef] [EDP Sciences] [Google Scholar]
- Mistani, P. A., Sales, L. V., Pillepich, A., et al. 2016, MNRAS, 455, 2323 [NASA ADS] [CrossRef] [Google Scholar]
- Mora, M. D., Chanamé, J., & Puzia, T. H. 2015, AJ, 150, 93 [NASA ADS] [CrossRef] [Google Scholar]
- Moster, B. P., Naab, T., & White, S. D. M. 2013, MNRAS, 428, 3121 [Google Scholar]
- Muñoz, R. P., Eigenthaler, P., Puzia, T. H., et al. 2015, ApJ, 813, L15 [Google Scholar]
- Ogle, P., Boulanger, F., Guillard, P., et al. 2010, ApJ, 724, 1193 [NASA ADS] [CrossRef] [Google Scholar]
- Ordenes-Briceño, Y., Puzia, T. H., Eigenthaler, P., et al. 2018, ApJ, 860, 4 [CrossRef] [Google Scholar]
- Peñarrubia, J., Navarro, J. F., & McConnachie, A. W. 2008, ApJ, 673, 226 [Google Scholar]
- Peng, C. Y., Ho, L. C., Impey, C. D., & Rix, H.-W. 2002, AJ, 124, 266 [Google Scholar]
- Peng, C. Y., Ho, L. C., Impey, C. D., & Rix, H.-W. 2010, AJ, 139, 2097 [Google Scholar]
- Pietrinferni, A., Cassisi, S., Salaris, M., & Castelli, F. 2004, ApJ, 612, 168 [Google Scholar]
- Poggianti, B. M., Fasano, G., Omizzolo, A., et al. 2016, AJ, 151, 78 [Google Scholar]
- Poggianti, B. M., Moretti, A., Gullieuszik, M., et al. 2017, ApJ, 844, 48 [Google Scholar]
- Poggianti, B. M., Vulcani, B., Tomicic, N., et al. 2025, The MUSE View of Ram Pressure Stripped Galaxies in Clusters: The GASP Sample [Google Scholar]
- Postma, J. E., & Leahy, D. 2017, PASP, 129, 115002 [Google Scholar]
- Poulain, M., Smith, R., Duc, P.-A., et al. 2025, Nature, 640, 902 [Google Scholar]
- Raj, M. A., Iodice, E., Napolitano, N. R., et al. 2019, A&A, 628, A4 [NASA ADS] [CrossRef] [EDP Sciences] [Google Scholar]
- Rampazzo, R., Mazzei, P., Marino, A., et al. 2022, A&A, 664, A192 [NASA ADS] [CrossRef] [EDP Sciences] [Google Scholar]
- Read, J. I., Iorio, G., Agertz, O., & Fraternali, F. 2017, MNRAS, 467, 2019 [NASA ADS] [Google Scholar]
- Reiprich, T. H., Veronica, A., Pacaud, F., et al. 2025, A&A, 703, A9 [NASA ADS] [CrossRef] [EDP Sciences] [Google Scholar]
- Roediger, E., & Brüggen, M. 2006, MNRAS, 369, 567 [NASA ADS] [CrossRef] [Google Scholar]
- Roediger, E., Brüggen, M., & Hoeft, M. 2006, MNRAS, 371, 609 [NASA ADS] [CrossRef] [Google Scholar]
- Romero-Gómez, J., Peletier, R. F., Aguerri, J. A. L., et al. 2023, MNRAS, 522, 130 [CrossRef] [Google Scholar]
- Romero-Gómez, J., Peletier, R. F., Aguerri, J. A. L., & Smith, R. 2024, A&A, 689, A40 [NASA ADS] [CrossRef] [EDP Sciences] [Google Scholar]
- Roussel, H., Helou, G., Hollenbach, D. J., et al. 2007, ApJ, 669, 959 [NASA ADS] [CrossRef] [Google Scholar]
- Roychowdhury, S., Chengalur, J. N., Karachentsev, I. D., & Kaisina, E. I. 2013, MNRAS, 436, L104 [CrossRef] [Google Scholar]
- Sánchez-Janssen, R., Méndez-Abreu, J., & Aguerri, J. A. L. 2010, MNRAS, 406, L65 [NASA ADS] [Google Scholar]
- Schlafly, E. F., & Finkbeiner, D. P. 2011, ApJ, 737, 103 [Google Scholar]
- Schuberth, Y., Richtler, T., Hilker, M., et al. 2010, A&A, 513, A52 [NASA ADS] [CrossRef] [EDP Sciences] [Google Scholar]
- Sellwood, J. A., & Masters, K. L. 2022, ARA&A, 60 [Google Scholar]
- Serra, P., Maccagni, F. M., Kleiner, D., et al. 2023, A&A, 673, A146 [NASA ADS] [CrossRef] [EDP Sciences] [Google Scholar]
- Serra, P., Oosterloo, T. A., Kamphuis, P., et al. 2024, A&A, 690, A4 [NASA ADS] [CrossRef] [EDP Sciences] [Google Scholar]
- Sextl, E., Kudritzki, R.-P., Burkert, A., et al. 2024, ApJ, 960, 83 [Google Scholar]
- Sextl, E., Kudritzki, R.-P., Bresolin, F., et al. 2025, The TYPHOON Stellar Population Synthesis Survey. II. Pushing Full Spectral Fitting to the Limit in the Nearby Grand Design Barred Spiral M83 [Google Scholar]
- Sivanandam, S., Rieke, M. J., & Rieke, G. H. 2014, ApJ, 796, 89 [NASA ADS] [CrossRef] [Google Scholar]
- Smith, J. D. T., Armus, L., Dale, D. A., et al. 2007a, PASP, 119, 1133 [NASA ADS] [CrossRef] [Google Scholar]
- Smith, J. D. T., Draine, B. T., Dale, D. A., et al. 2007b, ApJ, 656, 770 [Google Scholar]
- Smith, R., Sánchez-Janssen, R., Fellhauer, M., et al. 2013, MNRAS, 429, 1066 [NASA ADS] [CrossRef] [Google Scholar]
- Soto, K. T., Lilly, S. J., Bacon, R., Richard, J., & Conseil, S. 2016, MNRAS, 458, 3210 [Google Scholar]
- Starkenburg, T. K., Helmi, A., & Sales, L. V. 2016, A&A, 587, A24 [NASA ADS] [CrossRef] [EDP Sciences] [Google Scholar]
- Steinhauser, D., Schindler, S., & Springel, V. 2016, A&A, 591, A51 [NASA ADS] [CrossRef] [EDP Sciences] [Google Scholar]
- Stierwalt, S., Besla, G., Patton, D., et al. 2015, ApJ, 805, 2 [NASA ADS] [CrossRef] [Google Scholar]
- Tandon, S. N., Subramaniam, A., Girish, V., et al. 2017, AJ, 154, 128 [NASA ADS] [CrossRef] [Google Scholar]
- Tandon, S. N., Postma, J., Joseph, P., et al. 2020, AJ, 159, 158 [Google Scholar]
- Tarantino, E. J., Roman-Duval, J., Sandstrom, K. M., et al. 2025, JWST Captures Growth of Aromatic Hydrocarbon Dust Particles in the Extremely Metal-poor Galaxy Sextans A [Google Scholar]
- Tonry, J. L., Dressler, A., Blakeslee, J. P., et al. 2001, ApJ, 546, 681 [Google Scholar]
- Vazdekis, A., Koleva, M., Ricciardelli, E., Röck, B., & Falcón-Barroso, J. 2016, MNRAS, 463, 3409 [Google Scholar]
- Venhola, A., Peletier, R., Laurikainen, E., et al. 2018, A&A, 620, A165 [NASA ADS] [CrossRef] [EDP Sciences] [Google Scholar]
- Wang, K., Peng, E. W., Liu, C., et al. 2023, Nature, 623, 296 [NASA ADS] [CrossRef] [Google Scholar]
- Weilbacher, P. M., Palsa, R., Streicher, O., et al. 2020, A&A, 641, A28 [NASA ADS] [CrossRef] [EDP Sciences] [Google Scholar]
- Westfall, K. B., Cappellari, M., Bershady, M. A., et al. 2019, AJ, 158, 231 [Google Scholar]
- Zabel, N., Davis, T. A., Smith, M. W. L., et al. 2019, MNRAS, 483, 2251 [Google Scholar]
- Zeng, G., Wang, L., Gao, L., & Yang, H. 2024, MNRAS, 532, 2558 [Google Scholar]
- Zhu, J., Tonnesen, S., Bryan, G. L., & Putman, M. E. 2024, ApJ, 974, 142 [NASA ADS] [CrossRef] [Google Scholar]
Values from the Voronoi solutions using the LMC-like attenuation law as described in Section 2.2.
Mean reddening: ⟨E(B–V)*⟩≃0.17; ⟨E(B–V)gas⟩≃0.04.
Appendix A MUSE mosaic reduction details
We reduced the MUSE observations of NGC 1427A with the ESO pipeline (v3.13.8; Weilbacher et al. 2020), complemented by custom steps optimized for extended, low-surface-brightness emission. The workflow is implemented in a dedicated PYTHON wrapper around esorex to ensure consistent processing across runs. Data were organized by field (F1–F4) and reduced through basic calibration, astrometric alignment, sky modeling/subtraction (field-dependent), quality control, and final coaddition onto a common WCS.
Raw frames were ingested into a custom organizer that grouped data by field (F1–F4), matched each exposure to its calibrations, and generated set-of-frames (SOF) files. For each exposure, we recorded pointing, UTC start time, exposure time, frame type (target or offset sky), and observing block (OB). We also computed basic observing-context diagnostics (lunar phase, separation from bright Solar System objects, background illumination) to flag exposures susceptible to strong sky gradients. None of the OBs were affected by nearby bright sources. One OB in Field 3 displayed irregular sky behavior; three of its four exposures were rejected (Sect. A.2.2).
Calibrated products were generated with the standard recipes. muse_scibasic performed bias subtraction, flat-fielding, wavelength calibration, and geometric tracing, producing pixel tables for science and sky frames. We then ran an initial muse_scipost pass with sky subtraction disabled (-skymethod=none) and without astrometric alignment to obtain preliminary cubes and IMAGE_FOV whitelight maps for inspection. Several offset-sky frames and one target exposure exhibited significant drift due to tracking errors; the affected science exposure was excluded from the final mosaic.
A.1 Astrometric alignment
Astrometric registration used a calibrated HST/ACS image of NGC 1427A (program 9689, PI: Gregg) from MAST as the absolute reference. The ACS frame was PSF-matched to MUSE with a ![Mathematical equation: $\[0^{\prime\prime}_\cdot7\]$](/articles/aa/full_html/2026/08/aa59045-26/aa59045-26-eq12.png) FWHM Gaussian kernel, flux-scaled, and resampled to the MUSE spatial grid (
FWHM Gaussian kernel, flux-scaled, and resampled to the MUSE spatial grid (![Mathematical equation: $\[0^{\prime\prime}_\cdot2\]$](/articles/aa/full_html/2026/08/aa59045-26/aa59045-26-eq13.png) pix−1). The result was written in IMAGE_FOV format for direct use with esorex.
pix−1). The result was written in IMAGE_FOV format for direct use with esorex.
We ran muse_exp_align on all science exposures to measure residual offsets relative to this reference. All but two exposures aligned within ![Mathematical equation: $\[\mathrm{\simeq}0^{\prime\prime}_\cdot2\]$](/articles/aa/full_html/2026/08/aa59045-26/aa59045-26-eq14.png) ; one Field 4 exposure was affected by guiding drift, and one Field 3 exposure with a large initial offset was corrected manually.
; one Field 4 exposure was affected by guiding drift, and one Field 3 exposure with a large initial offset was corrected manually.
We then defined a common OUTPUT_WCS covering the full four-field mosaic and the nominal wavelength range (4700–9350 Å). Using this OUTPUT_WCS and the derived OFFSET_LIST, we reran muse_scipost for each exposure (still with -skymethod=none). Whitelight maps from these resampled cubes were compared to the PSF-matched ACS reference to verify field-to-field consistency.
A.2 Sky subtraction
Sky subtraction required three strategies. Fields 2 and 3 have dedicated offset-sky exposures; Field 4 contains sufficient blank sky for in-field modeling; Field 1 is filled by galaxy emission and has no offset frames. The adopted procedures are summarized below.
A.2.1 Field 4: in-field sky modeling
Field 4 includes ~40% blank sky, so the sky background was derived from the science frames. A sky mask was built by PSF-matching and resampling an HST/ACS detection image to the MUSE grid and thresholding to mask detectable galaxy emission. For each exposure we ran muse_scipost with -skymethod=model -skymodel_fraction=0.70 -skymodel_ignore=0.08 -save=cube, skymodel. Residual sky features were mitigated with ZAP (Soto et al. 2016).
Field 4 has three 967 s exposures; one was rejected due to guiding drift. The final cube shows a reliable continuum and diffuse Hα emission in the outskirts, despite a bright sky and mild large-scale gradients above ~8900 Å.
A.2.2 Fields 2 and 3: offset-sky subtraction
Fields 2 and 3 include offset-sky exposures acquired adjacent in time. Source masks for the offset frames were built from deep NGFS u′g′i′ mosaics (Muñoz et al. 2015; Eigenthaler et al. 2018) and propagated to each offset exposure after applying the measured per-exposure shifts/drifts. For each OB we ran muse_create_sky on the masked offset exposure (-fraction=0.95 -ignore=0.05) to derive sky-continuum and sky-line tables; one science exposure without a paired offset used sky tables interpolated from adjacent OBs.
Per science exposure, a target mask was constructed from the PSF-matched/resampled HST detection image (Sect. A.2.1) to isolate regions minimally affected by galaxy emission. Because NGC 1427A occupies most of the FoV, we retained only the faintest ≃20% of spaxels as the sky mask. Science exposures were reduced with muse_scipost -skymethod=model -save=cube, skymodel using the corresponding offset-derived sky tables, and residuals were removed with ZAP (Soto et al. 2016) using an external SVD basis built from the offset cubes.
Residuals were assessed by averaging the faintest 5–10 % of spaxels per exposure; these should be consistent with zero within the noise. Three Field 3 frames (OB03) showed strong, rapidly varying residuals across much of the bandpass and were discarded. The behavior is inconsistent with Moon/planet proximity and is likely due to transient terrestrial light.
A.2.3 Field 1: anchored sky model
Field 1 is fully filled by galaxy emission and lacks offset frames, so we anchored its sky model to a mosaic of the reduced Fields 2 and 3 (F23), which overlap Field 1.
Preparatory steps. (i) Velocity window: from a coadd of minimally processed cubes (F1–F4) we measured the Hα span 1960–2120 km s−1. (ii) Trimmed SKY_LINES: we removed sky lines within ±80 km s−1 of the galaxy-shifted Hβ, [O III], Hα, [N II], and [S II] transitions to avoid fitting sky lines to the galaxy emission. (iii) Flux cross-check: independent F2 and F3 coadds (sky- and ZAP-cleaned) agree within ≲9% over 4700–9350 Å in their overlap. (iv) F23 mosaic: we built an F23 reference cube on the global OUTPUT_WCS.
Per-exposure workflow. Each of the 21 Field 1 science frames was processed as follows (alignment products as in Sect. A.1): (i) build a target sky mask from the PSF-matched/resampled HST detection image, retaining the faintest ~20% of spaxels; (ii) run muse_scipost with the trimmed SKY_LINES and SKY_CONTINUUM=0 (line-only subtraction); (iii) derive a continuum model anchored to F23 by subtracting the F23 mosaic within the overlap, selecting the faintest spaxels in the overlap∩mask (typically ~5% of the field), and median-combining their spectra; (iv) rerun muse_scipost with the resulting SKY_CONTINUUM; (v) remove residuals with ZAP, using an external-sky cube (DATACUBE_FINAL–F23) to build the SVD basis.
 |
Fig. A.1 MUSE mosaic data-quality summary. Top row (common WCS; north up, east left): white-light image (4700–9300 Å; red ellipses denote masked out foreground and background sources), exposure map (Nfrm), and continuum S/N per spaxel (5300–5500 Å). Bottom: integrated spectrum over spaxels with Nfrm > 2. Gray bands mark spectral windows masked due to strong sky residuals; ticks indicate masked sky lines (red), nebular lines (blue), and prominent stellar absorption features (wine). |
The coadd of all Field 1 exposures matches the F2 and F3 coadds within the overlap area within ≲6%, yielding a uniform flux scale across the final mosaic.
A.3 Exposure combination
We produced two mosaics on the common OUTPUT_WCS: (i) a ZAP-cleaned cube used for the science analysis, and (ii) a no-ZAP control for validation. Individual cubes were co-added with MPDAF (Bacon et al. 2016) using CubeList.combine with nmax=2, nclip=4.0, nstop=2, and var=propagate. Figure A.1 summarizes the mosaic quality.
Appendix B DAP configuration and definitions
Table B.1 summarizes the configuration referenced in Sect. 2.2. We report only the parameters needed for reproducibility. The E-MILES templates are convolved to the wavelength-dependent MUSE LSF prior to fitting following E22. We adopt an LMC-like total-to-selective ratio RV = 3.41 (Gordon et al. 2003) throughout, and use the same k(λ) prescription in the stellar- and gas-phase corrections.
Because NGC 1427A is a dwarf galaxy, we use E-MILES template subsets that extend farther into the metal-poor regime than the grids adopted in E22. Maintaining the same logic, we use two grids, one coarse and one fine, tailored to the two main stellar-continuum steps. For the stellar-kinematics fit, we use a compact grid of 40 SSPs (8 ages × 5 metallicities), with ages t = {0.15, 0.30, 0.60, 1.00, 2.00, 3.75, 7.00, 13.5} Gyr and metallicities [Z/H] = {−2.27, −1.26, −0.35, +0.06, +0.26}. For the stellar-population fit, we use a denser grid of 117 SSPs (13 ages × 9 metallicities), with ages t = {0.03, 0.05, 0.08, 0.15, 0.25, 0.40, 0.60, 1.0, 1.75, 3.0, 5.0, 8.5, 13.5} Gyr and metallicities [Z/H] = {−2.27, −1.79, −1.49, −1.26, −0.96, −0.66, −0.35, +0.06, +0.26}. We omit the most metal-rich E-MILES node, [Z/H] = +0.40, because it is flagged by the model safe-range criteria and is not expected to be relevant for the bulk of the stellar mass in NGC 1427A. Such metallicities may still be relevant for compact, efficiently enriched stellar complexes (e.g., Fahrion et al. 2026).
B.1 Nebular reddening and Hα-based SFRs
Nebular reddening is estimated from the Balmer decrement under case-B recombination, adopting (Hα/Hβ)int = 2.86 and a Calzetti-type attenuation curve (C00) evaluated with our adopted RV = 3.41:
![Mathematical equation: $\[E(B\mathrm{-}V)_{\mathrm{gas}}=\frac{2.5}{k\left(\lambda_{\mathrm{H} \beta}\right)-k\left(\lambda_{\mathrm{H} \alpha}\right)} \log _{10}\left[\frac{(\mathrm{H} \alpha / \mathrm{H} \beta)_{\mathrm{obs}}}{(\mathrm{H} \alpha / \mathrm{H} \beta)_{\mathrm{int}}}\right].\]$](/articles/aa/full_html/2026/08/aa59045-26/aa59045-26-eq15.png) (B.1)
(B.1)
The extinction-corrected Hα luminosity is
![Mathematical equation: $\[L_{\mathrm{H} \alpha}=4 \pi D^2 ~F_{\mathrm{H} \alpha, \text {obs }} 10^{0.4 k\left(\lambda_{\mathrm{H} \alpha}\right) ~E(B-V)_{\mathrm{gas}}},\]$](/articles/aa/full_html/2026/08/aa59045-26/aa59045-26-eq16.png)
where D is the adopted distance to NGC 1427A (D = 17 ± 2.5 Mpc). We convert to SFR using Kennicutt & Evans (2012) (see also Chomiuk & Povich 2011):
![Mathematical equation: $\[\mathrm{SFR}_{\mathrm{H} \alpha}\left[M_{\odot} ~\mathrm{yr}^{-1}\right]=\left(5.5 \times 10^{-42}\right) L_{\mathrm{H} \alpha}\left[\mathrm{erg} \mathrm{~s}^{-1}\right].\]$](/articles/aa/full_html/2026/08/aa59045-26/aa59045-26-eq17.png)
Core TARDIS/PPXF configuration adopted in this work.
Uncertainties propagate the line-flux errors and the reddening term; maps are additionally masked where either Hα or Hβ fails the detection criterion above.
B.2 Stellar-population summary maps and region-integrated PDFs, SFHs, and metallicity distribution functions
Per-bin stellar-population summary maps. We construct the stellar-population maps from the non-negative pPXF template weights, averaged over the Monte Carlo (MC) ensemble, similar to E22. Let i index Voronoi bins, j index SSP templates on the native library grid, and r index MC realizations. For each (i, r), the fit returns a weight wirj for template j. Using the template-intrinsic present-day stellar mass ![Mathematical equation: $\[M_{j}^{*}\]$](/articles/aa/full_html/2026/08/aa59045-26/aa59045-26-eq18.png) , logarithmic age
, logarithmic age
![Mathematical equation: $\[\mathcal{A}_j \equiv \log _{10}\left(\text {age}_j / \mathrm{yr}\right),\]$](/articles/aa/full_html/2026/08/aa59045-26/aa59045-26-eq19.png)
and metallicity
![Mathematical equation: $\[\mathcal{Z}_j \equiv[\mathrm{Z} / \mathrm{H}]_j,\]$](/articles/aa/full_html/2026/08/aa59045-26/aa59045-26-eq20.png)
we define the present-day stellar mass contributed by template j in bin i and realization r as
![Mathematical equation: $\[m_{i r j}=w_{i r j} ~M_j^*.\]$](/articles/aa/full_html/2026/08/aa59045-26/aa59045-26-eq21.png)
We then average over MC realizations,
![Mathematical equation: $\[\bar{m}_{i j}=\frac{1}{N_{\mathrm{MC}}} \sum_{r=1}^{N_{\mathrm{MC}}} m_{i r j}.\]$](/articles/aa/full_html/2026/08/aa59045-26/aa59045-26-eq22.png)
Let Ai be the projected area of Voronoi bin i in kpc2. The stellar mass surface density map is
![Mathematical equation: $\[\Sigma_{*, i}=\frac{1}{A_i} \sum_j \bar{m}_{i j}.\]$](/articles/aa/full_html/2026/08/aa59045-26/aa59045-26-eq23.png)
The mass-weighted mean logarithmic age and metallicity maps are
![Mathematical equation: $\[\langle\mathcal{A}\rangle_{M, i}=\frac{\sum_j \bar{m}_{i j} \mathcal{A}_j}{\sum_j \bar{m}_{i j}}, \quad\langle\mathcal{Z}\rangle_{M, i}=\frac{\sum_j \bar{m}_{i j} \mathcal{Z}_j}{\sum_j \bar{m}_{i j}}.\]$](/articles/aa/full_html/2026/08/aa59045-26/aa59045-26-eq24.png)
For light-weighted quantities, we convert each template mass into light using the template mass-to-light ratio ![Mathematical equation: $\[\Upsilon_{j} \equiv M_{j}^{*} / L_{V, j}\]$](/articles/aa/full_html/2026/08/aa59045-26/aa59045-26-eq25.png) ,
,
![Mathematical equation: $\[\bar{\ell}_{i j}=\frac{1}{N_{\mathrm{MC}}} \sum_{r=1}^{N_{\mathrm{MC}}} \frac{m_{i r j}}{\Upsilon_j},\]$](/articles/aa/full_html/2026/08/aa59045-26/aa59045-26-eq26.png)
and replace ![Mathematical equation: $\[\bar{m}_{i j}\]$](/articles/aa/full_html/2026/08/aa59045-26/aa59045-26-eq27.png) by
by ![Mathematical equation: $\[\bar{\ell}_{i j}\]$](/articles/aa/full_html/2026/08/aa59045-26/aa59045-26-eq28.png) in the expressions above. All maplevel stellar-population summaries are computed from the MC-averaged quantities rather than from a single best-fit solution.
in the expressions above. All maplevel stellar-population summaries are computed from the MC-averaged quantities rather than from a single best-fit solution.
These per-bin quantities are used both to construct the spatial maps discussed in Sect. 3.3 and to derive region-integrated stellar-population summaries. Using the MC-averaged present-day stellar mass contributions ![Mathematical equation: $\[\bar{m}_{i j}\]$](/articles/aa/full_html/2026/08/aa59045-26/aa59045-26-eq29.png) defined above, we combine the contributions from all Voronoi bins within a selected region and normalize them to the SSP library grid in age and metallicity. For a given region, defined by a binary selection mask bi, the region-integrated template mass is
defined above, we combine the contributions from all Voronoi bins within a selected region and normalize them to the SSP library grid in age and metallicity. For a given region, defined by a binary selection mask bi, the region-integrated template mass is
![Mathematical equation: $\[\bar{m}_j^{\mathrm{reg}}=\sum_i b_i ~\bar{m}_{i j},\]$](/articles/aa/full_html/2026/08/aa59045-26/aa59045-26-eq30.png) (B.2)
(B.2)
and the region-integrated, mass-weighted PDF is
![Mathematical equation: $\[\mathrm{PDF}_j^{\mathrm{reg}} \equiv \frac{\bar{m}_j^{\mathrm{reg}}}{\sum_k \bar{m}_k^{\mathrm{reg}}}.\]$](/articles/aa/full_html/2026/08/aa59045-26/aa59045-26-eq31.png) (B.3)
(B.3)
By construction, ![Mathematical equation: $\[\sum_{j} ~\mathrm{PDF}_{j}^{\text {reg }}=1\]$](/articles/aa/full_html/2026/08/aa59045-26/aa59045-26-eq32.png) , so
, so ![Mathematical equation: $\[\mathrm{PDF}_{j}^{\text {reg}}\]$](/articles/aa/full_html/2026/08/aa59045-26/aa59045-26-eq33.png) represents the fraction of the region’s present-day stellar mass assigned to SSP template j.
represents the fraction of the region’s present-day stellar mass assigned to SSP template j.
Each metallicity distribution function was obtained by marginalizing PDFreg over age and scaling by the region stellar mass; it is therefore expressed in present-day stellar mass. The SFH was obtained by (i) converting present-day stellar mass in each template to an initially formed mass using the SSP library living-mass fraction, (ii) marginalizing over metallicity, and (iii) dividing by the linear time-bin width to yield SFR(t).
Appendix C Ancillary data products and calibrations
C.1 AstroSat/UVIT far-UV imaging
NGC 1427A was observed with AstroSat/UVIT in the F148W filter (mean wavelength λmean = 1481 Å, bandwidth Δλ ≃ 500 Å) in two epochs: 30 Nov 2022 (26883.80 s) and 28 Jan 2023 (37004.35 s), for a total exposure time of 63888.15 s. Level-1 data were corrected for drift, flat-field, and distortion (see Postma & Leahy 2017), and combined into the final science mosaic; 824.44 s from 28 Jan 2023 were discarded due to large distortions. The final image has pixel scale 0.4167″ pix−1 and PSF FWHM ≃1.5″, and the astrometry was refined against Gaia DR3 to ≃0.4″ accuracy. Photometric calibration follows the mission prescriptions for F148W (Tandon et al. 2017, 2020), reporting AB magnitudes.
We measured integrated UVIT photometry in three apertures defined on the NGFS optical imaging: (i) a circular aperture of radius 15″ centered on the “northern clump”, (ii) a “main body” aperture defined by the μ = μ0 + 2.0 isophote, and (iii) a “full galaxy” aperture out to μ = μ0 + 4.5 to include low-surface-brightness outskirts while mitigating contamination from neighboring sources. The background was measured in an annulus between 140″ and 200″.
We converted FUV luminosity densities to SFRs using a continuous-star-formation calibration appropriate for ≳100 Myr timescales (Kennicutt & Evans 2012; see Rampazzo et al. 2022):
![Mathematical equation: $\[\mathrm{SFR}_{\mathrm{FUV}}=K_\nu ~L_\nu(\mathrm{FUV}),\]$](/articles/aa/full_html/2026/08/aa59045-26/aa59045-26-eq34.png) (C.1)
(C.1)
with Kν = 9.04 × 10⁻²⁹ M⊙ yr−1 (erg s−1 Hz−1)−1. We obtain Lν from the extinction-corrected Fλ evaluated at λmean using the standard Fν = (λ2/c) Fλ relation and Lν = 4πD2Fν.
For attenuation corrections, we applied a Milky Way foreground reddening of E(B–V)MW = 0.01 (Schlafly & Finkbeiner 2011) and an internal color excess tied to the nebular Balmer-decrement estimate (Sect. 2.2; Appendix B.1; Fig. 8). For integrated values we adopt a uniform E(B–V)int = 0.04 ± 0.02 representative of the spatially averaged nebular reddening. Bandpass-weighted attenuation coefficients are computed across the F148W transmission using the (C89) relation with RV = 3.1 for the Milky Way term and a Calzetti-type curve with RV = 3.41 (C00) for the internal term, yielding ![Mathematical equation: $\[\left\langle k_{\mathrm{FUV}}^{\mathrm{MW}}\right\rangle=9.05\]$](/articles/aa/full_html/2026/08/aa59045-26/aa59045-26-eq35.png) and ⟨kFUV⟩ = 10.03 (mag per unit E(B–V)).
and ⟨kFUV⟩ = 10.03 (mag per unit E(B–V)).
The observed aperture-integrated FUV photometry is mAB = 18.319 ± 0.011 for the northern clump (r = 15″), mAB = 15.696 ± 0.010 for the main body (μ = μ0 + 2.0), and mAB = 15.457 ± 0.010 for the full galaxy aperture (μ = μ0 + 4.5). After applying the attenuation corrections above and using Eq. (C.1), we obtain SFRFUV = (8 ± 3) × 10−3 M⊙ yr−1 for the northern clump, SFRFUV = (94 ± 3.3) × 10−3 M⊙ yr−1 for the main body, and SFRFUV = (117 ± 0.41) × 10−3 M⊙ yr−1 for the full galaxy aperture. The quoted uncertainties propagate the photometric calibration, the adopted attenuation terms (Milky Way plus internal), and the distance uncertainty.
C.2 Optical imaging
HST imaging. NGC 1427A has public HST imaging with ACS in broad optical filters (F475W, F625W, F775W, F850LP) and the narrow-band F660N (Hα), as well as WFPC2/F336W in the near-UV. In this work, we use these data as an ancillary high-resolution reference to refine the astrometric alignment of the MUSE mosaic and to verify the location and compactness of bright H II regions (Sect. 2.1; Appendix A). We rely on the calibrated level-3 products available via MAST and refer the reader to the instrument documentation and to Mora et al. (2015) for analyses of the young stellar complexes.
 |
Fig. C.1 Top: NGFS u′g′i′ composite of FCC229 and a zoomed-in view of the nucleus, highlighting the offset between the nuclear star cluster (circle) and the Sérsic center (cross). Bottom: GALFIT model and residuals for the same region. |
NGFS wide-field imaging and neighboring dwarfs. Wide-field optical context is provided by NGFS u′g′i′ imaging (Muñoz et al. 2015; Eigenthaler et al. 2018). The NGFS data reveal several very low-surface-brightness dwarfs in projection near NGC 1427A (Fig. 1); in the main text, we restrict ourselves to their qualitative use as potential perturbers in projection. Among these systems, FCC 229 is of particular interest because it hosts a compact nucleus whose centroid appears offset from the galaxy light distribution (Fig. C.1).
Structural fit of FCC 229. To quantify the apparent nuclear offset, we fit FCC 229 with GALFIT (Peng et al. 2002, 2010) on the NGFS u′g′i′ images. In g′ and i′ we model the galaxy with a Sérsic component plus a central unresolved component (PSF) to represent the nuclear star cluster, while in u′ we adopt a single Sérsic model given the lower S/N and weaker nucleus contrast. The fitted NSC has mi′ = 23.5 mag and is displaced by ≃1″ from the best-fitting Sérsic center (Fig. C.1). This offset is significant compared to the ≃1.1–1.3″ seeing in the g′ and i′ images. Within the uncertainties, the NSC color is consistent with the integrated galaxy light. We use this offset only as a qualitative consistency check; nuclear offsets of this scale are not uncommon in nucleated dwarfs (e.g., Binggeli et al. 2000) and are not by themselves diagnostic of an interaction. The implications are discussed in Sect. 4.
C.3 Infrared data: Spitzer and Herschel
We used archival Spitzer IRAC imaging (3.6, 4.5, and 8.0 μm) and Spitzer IRS spectral mapping together with Herschel PACS and SPIRE maps and aperture photometry from HeFoCS (Sivanandam et al. 2014; Fuller et al. 2014). We did not re-reduce the basic calibrated data. Our processing was limited to registration, PSF matching, aperture definition, and spectral extraction for the IRS cubes.
IRAC imaging (PAHs and stellar continuum). To isolate the dust-dominated 8 μm component, we subtract the stellar continuum contribution using the prescription of Helou et al. (2004), using the 3.6 μm image. Given the warm dust temperatures inferred from the IRS-based analysis below, the warm dust continuum falls steeply toward wavelengths ≲10 μm, so the continuum-subtracted 8 μm image primarily traces PAH-bearing dust with little contamination from the warm dust continuum. For multiwavelength comparisons, the IRAC 8 μm, UVIT FUV, and MUSE Hα images are registered to the MUSE astrometric frame and PSF-matched to a common 2″ FWHM Gaussian, set by the IRAC 8 μm resolution (see Fig. 2).
IRS mapping and warm-dust morphology. We retrieved the IRS pipeline products from IRSA and built spectral cubes using CUBISM (Smith et al. 2007a), including background subtraction, bad pixel masking, and cube reconstruction. From the IRS long-low (19.5–38 μm) mapping we constructed a white-light image to trace warm dust and compare it to optical isophotes and to the MUSE nebular emission. To build an IR SED, we combine IRS spectra extracted within optical apertures (μ = μ0, μ0 + 1, and μ0 + 2) with the integrated Herschel photometry (see Fig. C.2). Emission-line regions in the IRS spectra are masked for continuum-based SED fitting. For a full analysis of the MIR lines, refer to Sivanandam et al. (2014).
Herschel photometry and two-component modified-blackbody fit. We adopt the aperture photometry reported by Fuller et al. (2014); their optical-sized aperture is comparable in scale to our μ = μ0 + 1 isophote. Combining those fluxes with the IRS long-low continuum yields a global mid- to far-IR SED. We fit the SED with a two-component modified blackbody with fixed emissivity index β = 2, obtaining characteristic dust temperatures of Tcold = 15.9 ± 2.6 K and Twarm = 59 ± 3 K, and corresponding dust masses Md,cold = (4.0 ± 2.5) × 106 M⊙ and Md,warm = (4.2 ± 2.2) × 102 M⊙. The quoted uncertainties include the fit covariance and the distance uncertainty. The μ0 + 2 IRS extraction contains roughly twice the 20–38 μm flux of the μ0 + 1 extraction, implying that optical-sized apertures can underestimate the total dust emission; consequently, the total dust mass may plausibly be larger by up to a factor of approximately two if the cold component is similarly extended.
C.4 Radio and millimeter observations
Neutral atomic gas: MeerKAT H I. We use H I data products from the MeerKAT Fornax Survey (Serra et al. 2023; Kleiner et al. 2023) and the dedicated analysis presented by Serra et al. (2024). These observations trace the 21 cm line with high surface-brightness sensitivity and an angular resolution of ~6" (corresponding to ~0.5 kpc at our adopted distance). In this work, we make use of the publicly released H Iproducts (total intensity and velocity-field maps) to provide the large-scale neutral-gas morphology and kinematic context for comparison with the MUSE stellar and ionized-gas diagnostics (Sect. 4). We refer the reader to the above references for observational setup and data reduction details.
 |
Fig. C.2 Mid- to far-IR morphology and SED of NGC 1427A. Top left: IRS LL1 white-light map, tracing warm dust; optical isophotes at μ = μ0, μ0+1, and μ0+2 mag arcsec−2 are overlaid. The warm dust is extended and asymmetric, with emission in the main body, the northern clump, and the bridge region, and there is an enhancement toward the southwest. Top right: Herschel/SPIRE 250 μm image from HeFoCS (Fuller et al. 2014); the photometric aperture used in that work is shown and is comparable in scale to our μ0+1 isophote. Bottom: Infrared SED combining IRS spectra extracted within the three optical isophotes (colors as in the top-left panel) and the integrated Herschel photometry (black circles). A two-component modified blackbody fit with β = 2 yields Twarm = 59 ± 3 K and Tcold = 15.9 ± 2.6 K (masses in Appendix C.3). |
Molecular gas: ALMA CO upper limits. Constraints on the cold molecular phase are taken from ALMA CO(1–0) observations reported by Zabel et al. (2019) as part of the ALMA Fornax Cluster Survey. NGC 1427A was observed in Band 3 at 115 GHz, with a primary beam of ~55" FWHM centered on the galaxy, covering the central stellar body. No CO(1–0) emission is detected. For non-detections, Zabel et al. (2019) assume a Gaussian line profile with FWHM 50 km s−1 to derive 3σ upper limits on the integrated CO flux.
The CO limits are converted to H2 masses using a metallicity-dependent CO–to–H2 conversion factor following Accurso et al. (2017), combined with a stellar-mass-based metallicity estimate and an assumed offset from the SFMS of ΔMS = 0. These assumptions are consistent with the stellar population and star-formation properties derived in this work (Sects. 3.3 and 3.5). For NGC 1427A, Zabel et al. (2019) report log10(MH2/M⊙) < 7.42 at 19.95 Mpc, which rescales to log10(MH2/M⊙) < 7.28 at the distance adopted here. The dependence of this constraint on the adopted αCO in the low-metallicity regime is revisited in Sect. 4.2.3. A faint 3 mm continuum source is detected at the optical position of the galaxy; given the available data, this emission could be associated with compact star formation (see the Hα and 8 μm emission in Fig. 2) or with a background source.
Appendix D Kinematic position-angle estimates from velocity maps
To characterize the orientation of the stellar, ionized-gas, and neutral-gas kinematics in a homogeneous way, we estimate the dominant large-scale velocity gradient directly from the projected velocity maps. This is intended as a simple first-order characterization of the kinematic orientation, not as a substitute for a full kinematic model.
We define an ad hoc elliptical aperture (see Fig. D.1) enclosing the main stellar body of NGC 1427A, guided by the stellar surface-density map and applied identically to the stellar, Hα, and H I velocity fields. Within this aperture, we estimate the projected velocity gradient by fitting a 2D least-squares plane in local sky coordinates and define the kinematic major-axis position angle, PAkin, as the direction of that gradient, measured east of north. The corresponding rotation axis is perpendicular.
For all three tracers, we derive a formal covariance-based uncertainty, σcov, from the fitted plane. For the stellar and Hα velocity maps, we also propagate the available per-pixel velocity uncertainties via Monte Carlo realizations. In each realization, the velocities are perturbed according to their formal uncertainties, and the kinematic position angle is remeasured. We adopt N = 500 realizations and define σMC from the resulting distribution of PAkin. For these two tracers, we report a total uncertainty
![Mathematical equation: $\[\sigma_{\mathrm{tot}}=\sqrt{\sigma_{\mathrm{cov}}^2+\sigma_{\mathrm{MC}}^2}.\]$](/articles/aa/full_html/2026/08/aa59045-26/aa59045-26-eq36.png)
For the H I moment-1 map, no equivalent per-pixel velocity-error map is available in the present data products, so we report only the covariance-based uncertainty. For a more rigorous treatment of the H I kinematics, see Serra et al. (2024). Our result is in agreement.
Applying this procedure within the adopted aperture yields kinematic major-axis position angles of 63.6° ± 1.4° for the stellar component, 91.4° ± 0.5° for Hα, and 102.0° ± 1.8° for H I. The corresponding rotation axes are therefore at −26.4°, 1.4°, and 12.0°, respectively. These values confirm that the stellar kinematics are significantly misaligned with respect to both gas phases (by ~30°), while the Hα and H I kinematics remain more nearly aligned with each other. As shown in the zero-velocity curves from Fig. 4, there is warping in the PAkin of all distributions, most notably for H I. This is discussed in detail in Serra et al. (2024).
 |
Fig. D.1 Velocity-based estimate of the kinematic position angle of NGC 1427A. The panels show the stellar velocity field (top left), stellar surface-density map (top right), Hα velocity field (bottom left), and H I velocity field (bottom right), all displayed over the same sky region. The cyan ellipse marks the common aperture adopted for the fit. The green line indicates the fitted kinematic major axis, and the white dashed line shows the axis of rotation. |
All Tables
Expected E(B–V) values based on the FIR in the main body under idealized geometries.
All Figures
|
Fig. 1 NGFS DECam i′g′u′ (RGB) view of NGC 1427A. North is up, east is left; the arrow marks the direction to the Fornax cluster center. The MUSE mosaic footprint is shown in transparent red. White and black curves trace u′+g′+i′ isophotes at different surface-brightness levels (see legend). The dashed white circle marks the “northern clump” (Lee-Waddell et al. 2018); labeled red ellipses mark nearby dwarf candidates discussed in the text and listed in Table 2. |
| In the text | |
|
Fig. 2 Three-color composite highlighting distinct star formation and interstellar medium (ISM) tracers in NGC 1427A: IRAC 8 μm (red; stellar-continuum subtracted), MUSE Hα (green), and UVIT FUV (blue). All images are PSF-matched to a common 2″ FWHM Gaussian. In the main body, 8 μm emission envelopes Hα knots as expected for dusty H II regions; the northern clump shows clear 8 μm emission, with faint bridge-like 8 μm connecting to the main body. By contrast, several high-surface-brightness Hα clouds at the leading edge (toward the Fornax cluster center) exhibit little or no 8 μm, indicating ionized gas with weak co-spatial aromatic and small-grain emission. We also note extended FUV emission to the northeast with weak Hα counterparts, consistent with ~50–100 Myr populations after ionizing stars have faded. See Section 2 and Appendix C for details. |
| In the text | |
|
Fig. 3 NGFS u′g′i′ RGB image of NGC 1427A with MeerKAT H I column-density contours (6″ beam) overlaid in white. Contours are drawn at several column densities, tracing the concentration of H I, the gaseous disk, and the southwest tail around the stellar body. |
| In the text | |
|
Fig. 4 Multiphase overview of NGC 1427A. Each column shows the same tracer; each row shows a different property. The maps for MUSE-based emission lines show only measurements with S/N >10 (i.e., relative flux error <10%). For visualization, the ionized-gas velocity and dispersion maps are hybrid: spaxel-level values where S/N > 10, Voronoi-bin values elsewhere. Row 1 – surface brightness: NGFS u′g′i′ composite; MeerKAT H I column density (6" beam); and MUSE maps of Hα, [S II] λλ6716, 6731, and [O III] λλ4959, 5007 flux. Row 2 – line-of-sight velocity: stellar pPXF velocity, H I moment–1, and hybrid ionized–gas velocity maps (spaxel-level where S/N > 10, Voronoi-bin values elsewhere). All five panels share the color bar on the right. In all but the last panel, the systemic-velocity contour (v = 2035 km s−1) is highlighted within the μ0 + 2 isophote to guide the eye to the approximate zero-velocity line. Row 3-velocity dispersion: stellar, H I, Hα, [S II], and [O III] dispersions with individual color bars below each panel. Overlaid on each frame are the contours for spatial reference. These isophotes were calculated over the NGFS u′ + g′ + i′ image. From the brightest isophote with surface brightness μ0, the others show μ0 + 1, μ0 + 2, and μ0 + 4.5, with no spatial smoothing. A 1 kpc bar is shown in the top-left corner of every panel (distance adopted: 17 Mpc). |
| In the text | |
|
Fig. 5 Violin plot of the line-of-sight velocity residuals of individual components with respect to the systemic radial velocity: Δv = v − 2035 km s−1, where 2035 km s−1 is our adopted systemic velocity. From top to bottom: Residuals in [O III] (high-ionization), [S II] (low-ionization), Hα (Balmer emission), H I, and the stellar component, measured inside the μ0 + 2.0 isophote. Each violin shows the kernel-density estimate (vertical width ∝ probability), while the gray line marks the median, the black line indicates the mean, and the dashed vertical line highlights Δv = 0. Distributions were computed from the velocity maps in Fig. 4. |
| In the text | |
|
Fig. 6 From left to right, we show the stellar mass surface density (Σ*) averaged across MC realizations, the mass-weighted metallicity (⟨𝒵⟩M), and the mass-weighted age (⟨𝒜⟩M). Only bins with continuum S/N > 30 are shown, close to the target of 35. |
| In the text | |
|
Fig. 7 Region-integrated stellar age–metallicity distributions and their 1D projections. Each column corresponds to a spatial region (whole galaxy, main body, northern clump). The heatmap shows PDFreg on the native SSP (log t,[Z/H]) grid, defined as the region-summed PPXF template masses normalized to unity (i.e., the fraction of the region’s present-day stellar mass assigned to each template; Appendix B.2). Top panels: star-formation histories derived by converting the mass-weighted distribution to formed mass using the SSP living-mass fraction, marginalizing over metallicity and dividing by the linear time-bin width to yield SFR(t). Side panels: metallicity distribution functions obtained by marginalizing over age and scaling by the region’s present-day stellar mass. |
| In the text | |
|
Fig. 8 Dust and gas context. Top left: MeerKAT H I column density (6″ beam). Top right: stellar E(B–V)* from stellar continuum fit (Appendix B.1). Bottom left: nebular E(B–V)gas from the Balmer decrement, masking bins with ΔE(B–V)gas > 0.1 mag. Both E(B–V) maps share the same color scale. Bottom right: normalized histograms inside the μ0+1 isophote (blue: stars; red: gas); vertical lines mark the mean (dashed) and median (dotted). Contours show NGFS isophotes; a 1 kpc bar is shown in each map. |
| In the text | |
|
Fig. 9 Extinction-corrected Hα SFR surface density. The ΣSFR was computed per Voronoi bin using the Balmer-decrement-corrected Hα luminosity (Appendix B.1). Bins failing the S/N criteria (≲10) or uncertainty cuts are masked (white). |
| In the text | |
|
Fig. 10 Illustration of the likely evolutionary path described in this work. |
| In the text | |
|
Fig. 11 (a) Resolved SFMS kernel-density estimate (KDE): dust-corrected Hα-based ΣSFR versus Σ⋆ for Voronoi bins. Solid and dashed lines show the best-fit resolved SFMS and ±1σ envelope from Cano-Díaz et al. (2016). (b) Integrated SFMS for the whole galaxy, main body, and northern clump compared to the local SFMS (Cano-Díaz et al. 2016). Filled circles: Hα-based SFRs (Appendix B); open circles: FUV-based SFRs (Appendix C.1). Triangles show the pPXF-inferred mean SFR in the youngest SFH bin (30 Myr template, which integrates over the past ~40 Myr). |
| In the text | |
|
Fig. 12 Stellar mass-stellar metallicity plane. Blue line and band: SDSS stellar mass-metallicity relation from Gallazzi et al. (2005). Gray dotted line: dwarf–galaxy relation from Kirby et al. (2013), converted to total metallicity and stellar mass as discussed in the text. Colored symbols: NGC 1427A measurements in three apertures (gold = whole galaxy; green = main body; purple = northern clump). Filled circles show pPXF mass-weighted metallicities ⟨[Z/H]⟩MW; open circles show light-weighted values ⟨[Z/H]⟩LW, with vertical connectors. |
| In the text | |
|
Fig. A.1 MUSE mosaic data-quality summary. Top row (common WCS; north up, east left): white-light image (4700–9300 Å; red ellipses denote masked out foreground and background sources), exposure map (Nfrm), and continuum S/N per spaxel (5300–5500 Å). Bottom: integrated spectrum over spaxels with Nfrm > 2. Gray bands mark spectral windows masked due to strong sky residuals; ticks indicate masked sky lines (red), nebular lines (blue), and prominent stellar absorption features (wine). |
| In the text | |
|
Fig. C.1 Top: NGFS u′g′i′ composite of FCC229 and a zoomed-in view of the nucleus, highlighting the offset between the nuclear star cluster (circle) and the Sérsic center (cross). Bottom: GALFIT model and residuals for the same region. |
| In the text | |
|
Fig. C.2 Mid- to far-IR morphology and SED of NGC 1427A. Top left: IRS LL1 white-light map, tracing warm dust; optical isophotes at μ = μ0, μ0+1, and μ0+2 mag arcsec−2 are overlaid. The warm dust is extended and asymmetric, with emission in the main body, the northern clump, and the bridge region, and there is an enhancement toward the southwest. Top right: Herschel/SPIRE 250 μm image from HeFoCS (Fuller et al. 2014); the photometric aperture used in that work is shown and is comparable in scale to our μ0+1 isophote. Bottom: Infrared SED combining IRS spectra extracted within the three optical isophotes (colors as in the top-left panel) and the integrated Herschel photometry (black circles). A two-component modified blackbody fit with β = 2 yields Twarm = 59 ± 3 K and Tcold = 15.9 ± 2.6 K (masses in Appendix C.3). |
| In the text | |
|
Fig. D.1 Velocity-based estimate of the kinematic position angle of NGC 1427A. The panels show the stellar velocity field (top left), stellar surface-density map (top right), Hα velocity field (bottom left), and H I velocity field (bottom right), all displayed over the same sky region. The cyan ellipse marks the common aperture adopted for the fit. The green line indicates the fitted kinematic major axis, and the white dashed line shows the axis of rotation. |
| In the text | |
Current usage metrics show cumulative count of Article Views (full-text article views including HTML views, PDF and ePub downloads, according to the available data) and Abstracts Views on Vision4Press platform.
Data correspond to usage on the plateform after 2015. The current usage metrics is available 48-96 hours after online publication and is updated daily on week days.
Initial download of the metrics may take a while.