


Fig. 4
Download original image
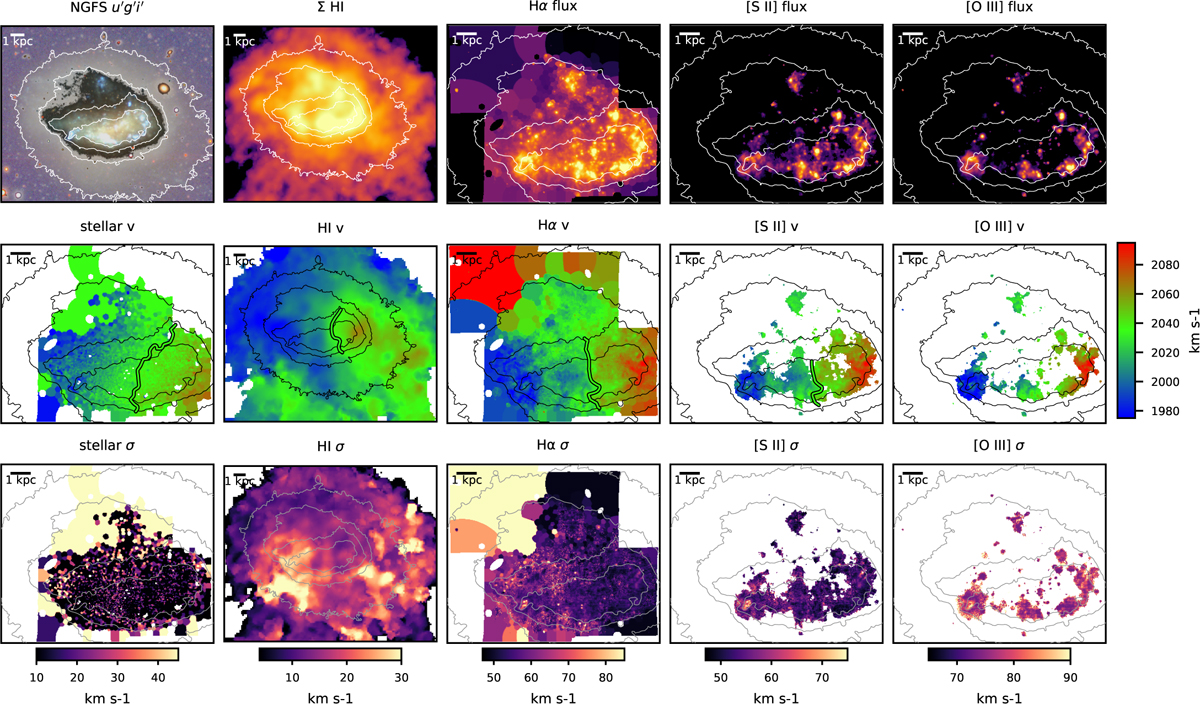
Multiphase overview of NGC 1427A. Each column shows the same tracer; each row shows a different property. The maps for MUSE-based emission lines show only measurements with S/N >10 (i.e., relative flux error <10%). For visualization, the ionized-gas velocity and dispersion maps are hybrid: spaxel-level values where S/N > 10, Voronoi-bin values elsewhere. Row 1 – surface brightness: NGFS u′g′i′ composite; MeerKAT H I column density (6" beam); and MUSE maps of Hα, [S II] λλ6716, 6731, and [O III] λλ4959, 5007 flux. Row 2 – line-of-sight velocity: stellar pPXF velocity, H I moment–1, and hybrid ionized–gas velocity maps (spaxel-level where S/N > 10, Voronoi-bin values elsewhere). All five panels share the color bar on the right. In all but the last panel, the systemic-velocity contour (v = 2035 km s−1) is highlighted within the μ0 + 2 isophote to guide the eye to the approximate zero-velocity line. Row 3-velocity dispersion: stellar, H I, Hα, [S II], and [O III] dispersions with individual color bars below each panel. Overlaid on each frame are the contours for spatial reference. These isophotes were calculated over the NGFS u′ + g′ + i′ image. From the brightest isophote with surface brightness μ0, the others show μ0 + 1, μ0 + 2, and μ0 + 4.5, with no spatial smoothing. A 1 kpc bar is shown in the top-left corner of every panel (distance adopted: 17 Mpc).
Current usage metrics show cumulative count of Article Views (full-text article views including HTML views, PDF and ePub downloads, according to the available data) and Abstracts Views on Vision4Press platform.
Data correspond to usage on the plateform after 2015. The current usage metrics is available 48-96 hours after online publication and is updated daily on week days.
Initial download of the metrics may take a while.