| Issue |
A&A
Volume 668, December 2022
|
|
|---|---|---|
| Article Number | A184 | |
| Number of page(s) | 20 | |
| Section | Extragalactic astronomy | |
| DOI | https://doi.org/10.1051/0004-6361/202243412 | |
| Published online | 20 December 2022 | |
NGC 3314a/b and NGC 3312: Ram pressure stripping in Hydra I cluster substructure
1
Instituto de Astrofísica de Andalucía (CSIC), Glorieta de la Astronomía s/n, 18008 Granada, Spain
e-mail: This email address is being protected from spambots. You need JavaScript enabled to view it.
2
ASTRON, the Netherlands Institute for Radio Astronomy, Postbus 2, 7990 AA Dwingeloo, The Netherlands
3
Kapteyn Astronomical Institute, University of Groningen, PO Box 800 9700 AV Groningen, The Netherlands
4
Department of Astronomy, University of Wisconsin-Madison, 475 N Charter St, Madison, WI 53706, USA
5
Research Center for Intelligent Computing Platforms, Zhejiang Laboratory, Kechuang Avenue, Hangzhou 311121, PR China
e-mail: This email address is being protected from spambots. You need JavaScript enabled to view it.
6
Department of Astronomy, University of Cape Town, Private Bag X3, 7701 Rondebosch, South Africa
7
Purple Mountain Observatory and Key Laboratory of Radio Astronomy, Chinese Academy of Sciences, 10 Yuanhua Road, Qixia District, Nanjing 210033, PR China
8
Département de Physique, Université de Montréal, Complexe des Sciences MIL, 1375 Avenue Thérèse-Lavoie-Roux, H2V 0B3 Montréal, QC, Canada
9
Laboratoire de Physique et de Chimie de l’Environnement, Observatoire d’Astrophysique de l’Université Ouaga I Pr Joseph Ki-Zerbo (ODAUO), BP 7021 Ouaga 03, Burkina Faso
10
Inter-University Institute for Data Intensive Astronomy (IDIA), University of Cape Town, Rondebosch, Cape Town 7701, South Africa
11
Western Sydney University, Locked Bag 1797, Penrith South DC, NSW 1797, Australia
Received:
24
February
2022
Accepted:
1
September
2022
Abstract
Cluster substructure and ram pressure stripping in individual galaxies are among the primary pieces of evidence for the ongoing growth of galaxy clusters as they accrete galaxies and groups from their surroundings. We present a multiwavelength study of the center of the Hydra I galaxy cluster, including exquisite new MeerKAT H I and DECam Hα imaging which reveal conclusive evidence for ram pressure stripping in NGC 3312, NGC 3314a, and NGC 3314b through compressed H I contours, well-defined H I tails, and ongoing star formation in the stripped gas. In particular, we quantify the stripped material in NGC 3312, and NGC 3314a, which makes up between 8% and 35% of the gas still in the disk, is forming stars at ∼0.5 M⊙ yr−1, and extends ∼30−60 kpc from the main disk. The estimated stellar mass in the tails is an order of magnitude less than the H I mass. A fourth “ring” galaxy at the same velocity does not show signs of ram pressure in H I. In addition, we used the H I and stellar morphologies, combined with a Beta model of the hot intracluster medium, to constrain the real distances of the galaxies to the cluster center, and we used the chance alignment of NGC 3314b behind NGC 3314a to break the degeneracy between whether the galaxies are in front or in back of the cluster. The drag seen in the H I tails supports our preferred scenario that NGC 3312 and NGC 3314a are moving toward us as part of a foreground substructure which has already passed its pericenter and is on “out fall” from the cluster. The high surviving H I content of the galaxies may suggest that the substructure or intragroup medium can protect them from the harshest effects of ram pressure, or that the galaxies are in fact on more tangential orbits.
Key words: galaxies: clusters: individual: Hydra I Cluster / galaxies: clusters: intracluster medium / galaxies: evolution / galaxies: ISM / galaxies: star formation
© The Authors 2022
 Open Access article, published by EDP Sciences, under the terms of the Creative Commons Attribution License (https://creativecommons.org/licenses/by/4.0), which permits unrestricted use, distribution, and reproduction in any medium, provided the original work is properly cited.
This article is published in open access under the Subscribe-to-Open model. This email address is being protected from spambots. You need JavaScript enabled to view it. to support open access publication.
1. Introduction
Galaxy transformation happens rapidly at the outskirts of clusters. Newly arrived galaxies fall into clusters on predominantly radial orbits (Colless & Dunn 1996; Ghigna et al. 1998; Vollmer et al. 2001b; Biviano & Katgert 2004; Mamon et al. 2019) and experience a variety of hydrodynamical and gravitational mechanisms that disrupt their equilibrium (Cowie & Songaila 1977; Larson et al. 1980; Nulsen 1982; Valluri 1993; Moore et al. 1996), driving changes in their morphology and composition (Moore et al. 1998; McIntosh et al. 2004; Boselli & Gavazzi 2006; Moran et al. 2007). The most visually striking among these mechanisms is ram pressure stripping (RPS) in which the interstellar medium (ISM) of a galaxy is impacted and removed by its interaction with and motion through a hot intracluster medium (ICM; Gunn & Gott 1972).
The impact of ram pressure on galaxy disks was first recognized in optical images of cluster member galaxies: some late-type galaxies could be seen with asymmetric dust lanes – having been swept away from the leading edge of the galaxy – and trailing condensations of star formation (e.g., Gallagher 1978 in NGC 3312; Kenney & Koopmann 1999 and sources therein). However, tidal interactions could not be ruled out as being responsible for these features.
The neutral atomic hydrogen (H I) component of galaxies has been critical to confirming episodes of RPS, showing for example how the edges of the kinematically cold gas disk can be clearly displaced from the stellar disk in a sort of bow shock as galaxies move through the ICM (Kenney et al. 2004; Crowl et al. 2005). Resolved surveys of nearby clusters have shown there is a large-scale anticorrelation between the orientation and location of extended H I tails, swept-back disks, and truncated disks compared to the X-ray emitting ICM within clusters (Chung et al. 2007, 2009). RPS can explain the well-known H I deficiency of galaxies in the center of clusters (Giovanelli & Haynes 1985; Haynes & Giovanelli 1986; Bravo-Alfaro et al. 2000; Solanes et al. 2001; Chung et al. 2009; Hess et al. 2015; Loni et al. 2021), and reveals the sequence of evolution as the multiphase gaseous component is removed from galaxies by the ICM wind (Cayatte et al. 1994; Tonnesen & Bryan 2009). These observations have been widely shown to be consistent with increasingly sophisticated simulations (Abadi et al. 1999; Brüggen & De Lucia 2008; Kapferer et al. 2009; Yun et al. 2019; Lee et al. 2020).
Due to the sensitivity of H I to its environment (Jones et al. 2020), the relatively short lifetime for H I in the ICM, and the fact that H I detected galaxies tend to reside on the outskirts of clusters (Bravo-Alfaro et al. 2000; Chung et al. 2009; Hess et al. 2015; Loni et al. 2021; Molnár et al. 2022), H I in cluster members is a signpost for recent accretion in the cluster environment. Combined with a measure of the cluster substructure (e.g. Dressler & Shectman 1988), H I may be valuable in estimating what fraction of recently accreted galaxies fell into clusters as individuals or as members of galaxy groups, and their degree of preprocessing (Jaffé et al. 2013, 2016; Hess & Wilcots 2013; Hess et al. 2015; Healy et al. 2021; Kleiner et al. 2021; Bakels et al. 2021). Substructures with multiwavelength coverage may also allow a reconstruction of the merger history of clusters (Colless & Dunn 1996; Hess et al. 2015).
Ongoing accretion in clusters has been observed in at least three major ways: (1) through evidence for ram pressure stripping which is most easily and dramatically identified in H I or Hα, (2) via cluster substructure identified through statistical tests or phase space diagrams (Hou et al. 2012; Hess et al. 2015; Jaffé et al. 2013, 2016; Sampaio et al. 2021), or (3) through the presence of X-ray substructure (e.g., Flores et al. 2000; Ferrari et al. 2006; Mann & Ebeling 2012). The Hydra galaxy cluster has largely avoided being identified strongly with any of these features.
Indeed, the Hydra I cluster (also known as Abell 1060) is unusual compared to well-known and well-studied nearby clusters such as Coma, Virgo, and Antlia. Hydra has been identified as relatively spiral-rich (Wirth & Gallagher 1980), with several large spirals seen in close projection to the cluster center. It is also unusually gas-rich, hosting a number of gas-rich dwarfs, and its central spiral galaxies are not particularly H I deficient (Richter & Huchtmeier 1983; McMahon et al. 1992; Duc et al. 1999; Wang et al. 2021). Despite this apparently young persona, Hydra has a dynamically relaxed X-ray halo centered on the cD galaxy, NGC 3311 (Fitchett & Merritt 1988; Tamura et al. 2000; Hayakawa et al. 2004; although see also Ventimiglia et al. 2011), and a fairly Gaussian distribution of cluster member velocities (Fitchett & Merritt 1988). Ventimiglia et al. (2011) and Arnaboldi et al. (2012) identify a collection of dwarf galaxies and planetary nebulae at 5000 km s−1 and tidal features around NGC 3311, which suggest a history of mergers within the core (see also recent studies of the dwarf and low surface brightness galaxy populations by La Marca et al. 2022a,b). However, the best case to support recent infall in Hydra, is that many studies find evidence for 2−3 galaxy groups or substructures projected along the line-of-sight to the cluster core (Fitchett & Merritt 1988; McMahon et al. 1992; Lima-Dias et al. 2021). Hydra thus presents an interesting and challenging environment to study galaxy cluster assembly which ties together ram pressure, cluster substructure, and the limitations of our observing capabilities to disentangle three dimensional structures.
The ram pressure felt by a galaxy moving through its environment is parameterized as a wind, whose strength depends on the density of the medium and the relative velocity of the galaxy through that medium:  . In the cluster environment, the typical ICM densities are low, but the orbital or infall velocity of the galaxies are high. Stripping occurs when the pressure from the ICM wind overcomes the local gravitational restoring force of the galaxy disk (Gunn & Gott 1972), at which point, gas is pushed out of the disk (for example through turbulent/viscous processes; Nulsen 1982). Although the maximum effect of RPS may be evident only after the peak of
  , depending on the strength of the ram pressure and the angle at which it impacts the disk (Jáchym et al. 2009; Roediger et al. 2015; Tonnesen 2019).
The signatures of ram pressure are seen in X-ray (Sun et al. 2006), optical (Poggianti et al. 2016; Roberts & Parker 2020), Hα (Kenney & Koopmann 1999; Sun et al. 2007; Fumagalli et al. 2014), dust (Cortese et al. 2010; Abramson & Kenney 2014; Kenney et al. 2015; Abramson et al. 2016), CO (Kenney et al. 1990; Vollmer et al. 2001a, 2008a), H I (Kenney et al. 2004; Oosterloo & van Gorkom 2005; Reynolds et al. 2021), radio continuum (Gavazzi et al. 1995; Chen et al. 2020; Roberts et al. 2021), polarized emission (Vollmer et al. 2008b), and combinations thereof (e.g., Crowl et al. 2005; Vollmer et al. 2009; Abramson et al. 2011; Ramatsoku et al. 2019; Longobardi et al. 2020; see also Boselli et al. 2022 for a review). H I is particularly valuable as a tracer of RPS, because interferometric observations resolve both the spatial and kinematic morphology of the gas in the process of being stripped. Similar analysis is becoming increasingly common in Hα using Fabry-Perot (Chemin et al. 2005) or integral field spectrographs (MUSE, Fumagalli et al. 2014; Poggianti et al. 2017; Sheen et al. 2017). The disrupted velocity fields, in addition to the morphology, provide information about not only the projected motion of the galaxy in the plane of the sky, but the relative motion of galaxy material along the line of sight.
The ultimate impact of ram pressure on the evolution of galaxies is complex: it both compresses the interstellar medium of the galaxy driving star formation in dense material; and heats and strips loosely bound material eroding the gas reservoir. The leading edge of galaxies experiencing RPS can be bluer than the trailing edge as dust is removed, and leaves linear dust filaments where the dust has been eroded by the wind around denser cores (Abramson et al. 2016). On the trailing edge of galaxies, new stars can form out of the stripped gas in “fireballs” (Kenney et al. 2014). The most extreme examples are known as “jellyfish” galaxies (e.g., Owers et al. 2012; Ebeling et al. 2014; McPartland et al. 2016; Poggianti et al. 2019). Star formation in both the compressed gas on the leading edge and in trailing gas can also be reproduced in simulations (Bekki & Couch 2003; Kronberger et al. 2008; Lee et al. 2020). Whether this sequence leads first to a star formation enhancement (Roberts & Parker 2020) before the galaxies are ultimately quenched – from the outside in Koopmann et al. (2006) – is unclear (Vollmer et al. 2012). However, by combining H I, various measures of star formation in the stripped gas, and statistical studies, one can estimate the timescales over which stripping is occurring (e.g., Cortese et al. 2021).
It is perhaps worth mentioning that our understanding of ram pressure discussed above is for galaxies falling into clusters as individuals, however many galaxies fall in as groups (McGee et al. 2009; Hess et al. 2015). Falling into a cluster as a member of a group may significantly modify the details of how a galaxy experiences ram pressure: for example, a galaxy may experience preprocessing in the group environment (Bahé et al. 2013; Vijayaraghavan & Ricker 2013), or they may experience less RPS as a result being shielding from the ICM by the bulk motion of the group and the intragroup medium (IGM) through the cluster. Present-day simulations may be able to provide some insight. On the observing side, correlating infalling groups with the bulk motions of substructure in clusters will only be possible with the next generation of X-ray telescopes (Ettori et al. 2013).
The presence of RPS in the Hydra cluster has been a subject of uncertainty for the last four and a half decades. In particular, NGC 3312 and NGC 3314a/b are three spiral galaxies, seen in close projection to the core of Hydra. Gallagher (1978) suggested NGC 3312 as a stripping candidate based on asymmetric optical morphology alone, showing sharp dust lanes on the east side of the galaxy and trailing clumps of blue stars (“condensations”) off the disk to the southwest. Its disk is seen at a steep angle while Hα data show HII regions asymmetrically extended on the “downwind” side, and likely out of its plane (see also Ho et al. 2011). NGC 3314a is a face-on galaxy, at the same recessional velocity as NGC 3312, which has a trail of stellar material extending to the southwest (most recently described by Iodice et al. 2021). NGC 3314a is backlit by the highly inclined NGC 3314b (Richter et al. 1982; Schweizer & Thonnard 1985; Keel & White 2001) which is also a Hydra cluster member. The two are separated by about 1850 km s−1.
H I observations of NGC 3312 and NGC 3314a with the Very Large Array suggested disturbed gas in the outskirts of the disks, but the interpretation favored that these galaxies were perhaps undergoing tidal interactions in the foreground group, rather than ram pressure stripping (McMahon et al. 1992). This is because X-ray data showed that if the galaxies were well within the Hydra cluster, RPS should have stripped the gas down to column densities of 6 × 1020 cm−2, well above the detection threshold of the H I observations. Instead, it was suggested that NGC 3312, NGC 3314a, and a gas-rich ring galaxy, LEDA 753342 (first noted by Wirth & Gallagher 1980) may be part of a foreground cluster substructure: NGC 3312 and NGC 3314a have almost the same systemic velocity, and tidal interactions could be responsible for their disturbed outer H I morphology. Recent studies as part of WALLABY (Koribalski et al. 2020) early science operations, have quantified the amount of strippable gas in NGC 3312 (Wang et al. 2021), or argue based on the galaxy’s position close to the center in phase space that it is most likely undergoing ram pressure stripping (Reynolds et al. 2021), but the H I morphology of the ASKAP maps are still inconclusive.
More recently, Iodice et al. (2021) described the stellar streams in NGC 3312 and NGC 3314a in deep VLT Survey Telescope (VST) broadband images, as part of the VST Early-type Galaxy Survey (VEGAS). They report the detection of an ultra diffuse galaxy, UDG 32, in the stellar tail of NGC 3314a and discuss the possibility of its formation due to RPS. If confirmed to be at the distance of NGC 3314a, UDG 32 would be the first such object to be attributed to a ram pressure origin.
Meanwhile, substructure in galaxy clusters is a natural consequence of hierarchical structure formation (Press & Schechter 1974; McGee et al. 2009; Fakhouri et al. 2010), and significant substructure in groups or clusters is believed to be correlated with relatively young systems that have recently merged or accreted bound collections of galaxies to make a larger halo (Hou et al. 2012). Cluster substructure can be apparent in X-ray observations (e.g., Briel et al. 1992; Schuecker et al. 2001; Zhang et al. 2009), or detected using statistical methods to measure the spatial and velocity deviations from the parent halo (e.g., Dressler & Shectman 1988; Colless & Dunn 1996; Hou et al. 2012). In the cluster environment, kinematically identified substructures have been correlated with an enhancement in the number of H I detections (Hess et al. 2015; Jaffé et al. 2013, 2016).
The degree of substructure within the Hydra I Cluster is uncertain and difficult to quantify. For example, Baier & Oleak (1983) suggested an enhancement in the galaxy number density to the south of the cluster center, but it lacks the signatures of substructure that are often identified with statistical tests within 45′ of the cluster core (Stein 1997; Lima-Dias et al. 2021). Lima-Dias et al. (2021) only identify substructure in this particular manner near the virial radius of the cluster. The X-ray halo is smooth and symmetric about the cD galaxy NGC 3311 suggesting there have been no major mergers in the last few gigayears (Tamura et al. 2000). It is considered to be the archetype of a relaxed system (Yamasaki et al. 2002). Finally, a histogram of the cluster velocities out to the virial radius suggest it is close to Gaussian (Fitchett & Merritt 1988). On face value, this is difficult to reconcile with the relatively gas-rich nature of the cluster.
The explanation for Hydra which may unite these observations was already suggested by Fitchett & Merritt (1988) who found that, considering the velocity distribution of galaxies only within 40′ of the cluster core, Hydra appears to break up into 2−3 velocity substructures along the line of sight (see also Bird 1995). Valluri et al. (in prep.) assess the history of substructure studies in Hydra and use a mixture modeling algorithm (McLachlan & Basford 1988) which favors three structures along the line of sight. They also show that Hydra galaxies at low velocity lie in a group which is systematically less H I deficient than the main Hydra cluster, strengthening the argument that they belong to a foreground group and are not a highly blue-shifted cluster moving through the cluster center. Substructure along the line of sight would account for the under-luminous nature of Hydra for its mass on the LX − σ relation (Fitchett & Merritt 1988).
In this paper we present new deep H I, Hα, and optical broadband observations of the Hydra cluster. The H I observations were taken with the MeerKAT Radio Telescope (Jonas & MeerKAT Team 2016) during the first period of 4K Open Time. These observations represent the deepest and highest spatial resolution H I images of the Hydra I Cluster to date. We show conclusively that NGC 3312 and NGC 3314a are experiencing RPS. We also present the first resolved H I detection of NGC 3314b which is in an even more advanced state of RPS due to its truncated H I disk. We complement the H I imaging with new broad- and Hα narrow-band DECam imaging and archival multiwavelength data from X-rays to infrared to estimate the total extent and amount of gas and stars in the stripped material. Finally, based on these exquisite data sets, we discuss the location of these galaxies within Hydra, in the context of Hydra substructure, and attempt to constrain the galaxy orbits and evolutionary history.
Throughout the paper we assume a ΛCDM cosmology with Ωm = 0.27, ΩΛ = 0.73, and H0 = 70 km s−1 Mpc−1. In addition, we assume a distance of 58.6 Mpc to the Hydra cluster center based on Tully (2015) which uses a combination of cosmic flow models and measured distances. This is consistent with the broad range of other estimates from the literature, which have trended with time toward larger distances (e.g., Fitchett & Merritt 1988; McMahon et al. 1992; Kourkchi & Tully 2017 1, Lima-Dias et al. 2021). Fundamental plane measurements for 11 E/S0 Hydra cluster galaxies give a redshift-independent distance of 56.6 ± 4 Mpc (Jorgensen et al. 1996). While a pure luminosity distance of D = 59 Mpc, taking into account bulk motions relative to the 3K CMB, was adopted by Reynolds et al. (2021) and is consistent with that reported in the NASA Extragalactic Database (NED)2. Thus, our assumed value of 58.6 Mpc is consistent with the best recent estimates. All distances discussed above are the original measurements scaled to our preferred cosmology.
The paper is organized as follows. In Sect. 2 we describe the radio and optical observations and data reduction, and processing of archival data. In Sect. 3 we present our results and describe them in the context of ram pressure stripping simulations. In Sect. 4 we discuss our results in the context of the cluster as a whole and what they mean for cluster substructure, cluster assembly, and cluster driven galaxy evolution. In Sect. 5 we summarize our conclusions.
2. Data
2.1. H I observations
The 1.4 GHz spectral line data were observed as part of a MeerKAT-64 4K Open Time project to mosaic the Hydra cluster (SCI-20190418-CC-01; PI: C. Carignan). The observations consisted of a 13 pointing mosaic that was observed in two eight hour intervals on 5 July and 13 July 2019 using the SKARAB correlator in 4K mode with full polarization. The MeerKAT L-band receivers cover a frequency range from approximately 900−1670 MHz. In 4K mode, the data are divided into 4096 channels with a channel width of 208.9 kHz which equates to roughly 44 km s−1 at z = 0 (see Jonas & MeerKAT Team 2016 for a full description of the MeerKAT system).
To maintain consistent UV coverage across the mosaic, we cycled between pointings, interspersed with regular visits to the gain calibrator. We observed six mosaic pointing for three minutes each, followed by the gain calibrator for two minutes (J1051−2023), and then the remaining seven pointings before another visit to the gain calibrator. This cycle was repeated 10 times in each eight hour period for a total of 60 min on source per mosaic pointing. The mosaic pointings were arranged in a hexagonal grid overlapping by  for nearly uniform sensitivity (Condon et al. 1998), where ΘFWHM is the primary beam width which we assumed to be 54.8′. The bandpass calibrators (PKS 0408−65) was visited once for 8 min at either the beginning or middle of the observation.
The data of each 8 h observation were reduced individually using the CARACal pipeline (Józsa et al. 2020a,b) on the ilifu computer cluster hosted by the Inter-University Institute for Data Intensive Astronomy (IDIA3). For the H I data cube, only the horizontal (HH) and vertical (VV) polarizations of the subband 1370−1418 MHz (509−11 030 km s−1) covering the Hydra I cluster velocity were reduced at the full frequency resolution (209 kHz, 44 km s−1 at z = 0). The CARACal pipeline performs the data reduction by making use of STIMELA, a radio interferometry scripting framework based on container technologies and Python (Offringa et al. 2010), to run many open-source radio interferometry software packages, such as Cubical, CASA, WSClean and Montage, etc. Generally, we flagged the radio frequency interference (RFI), did cross-calibration, self-calibration, and continuum subtraction, created the H I cubes with CARACal pipeline for each mosaic pointing. Before the cross-calibration, the data were flagged for geometric shadowing by nearby dishes. Possible RFI in the calibrator data was flagged using tricolor with the builtin strategy of “calibrator_soft_flagging.ymal”. While AOflagger was used to flag the possible RFI in the target data with the builtin strategy of “firstpass_Q.rfis”, which only inspects the Stokes Q amplitudes of the visibilities. Cross-calibration was done with CASA in the standard way and all solutions were then applied to the target field. The calibrated visibilities were imaged with WSClean and self-calibration was done with CubiCal for three times. Before imaging the HI spectral line, the continuum model visibilities were subtracted from the field visibilities, then continuum was fitted and subtracted with 3 orders of polynomials from the individual real and imaginary visibility spectra with CASA mstransform task. The Doppler-tracking correction is included in the run of CASA mstransform at the same time. The pure H I spectral line cube is created with WSClean.
The data were combined in the image plane, by smoothing each pointing for both days to the smallest common beam and then mosaicking. The final image has a spatial resolution of 11.8″ × 18.0″ and rms noise of 0.13 mJy beam−1 channel−1, or a 1σ H I column density sensitivity of NHI = 3.0 × 1019 cm−2 channel−1. In addition, we made a second version of the mosaic by smoothing the data to 40″ resolution which resulted in a cube with 0.31 mJy beam−1 channel−1, or an H I column density of NHI = 9.4 × 1018 cm−2 channel−1. The 40″ cube may have picked up up to ∼10% more diffuse mass around the galaxies, but the resolution is too poor to separate gas in the galaxies from gas that is stripped, so in this work we only present results from the high spatial resolution cube.
We conducted spectral line source finding using the well tested Source Finding Application (SoFiA-2; Westmeier et al. 2021). SoFiA-2 generates masks around each detected source, from which are derived moment maps and source properties. For this paper we only consider the H I detections within 15′ of the cluster center. The four sources presented here are H I bright and so the characterization of the sources is not very sensitive to the exact input parameters to SoFiA-2. A detailed description of the source finding will be presented in a future paper on the full MeerKAT Hydra cluster mosaic. See also Appendix A for additional discussion of the H I masses calculated for each object.
2.2. Optical broad- and narrow-band imaging
The optical data for the Hydra cluster were obtained with the Dark Energy Camera installed on the CTIO Blanco 4 m telescope (DECam; Flaugher et al. 2015) over 3 nights on DECam (2021-04-09 to 2021-04-11; project 2021A-0117; PI: R. Kotulla), covering the entire cluster in 6 bands (u, g, r, i, z, and N662: a narrow-band Hα filter). Observations were dithered to fill in gaps between detectors to yield a complete sky coverage without holes, with individual and cumulative exposure times as follows: u-band: 38 × 300 s; g: 19 × 180; r: 19 × 180; i: 38 × 180; z: 19 × 120 s; N662: 20 × 600 s. Observations in r and N662 were interleaved to minimize image depth and quality differences and yield a better narrow-band continuum subtraction. Data reduction for all DECam data was performed using the obs_subaru package in the LSST science pipeline4, which performs overscan and bias subtraction, flat-fielding, astrometric calibration relative to GAIA as reference, and photometric calibration relative to photometry obtained from PanSTARRS. For the background subtraction we adapted the algorithm developed initially for Hyper Suprime-Cam for use with DECam: data from multiple fields obtained as part of our observing campaign were first normalized and then combined to generate a sky-template across the full focal plane. In a second step, this global sky template was then intensity scaled to each individual frame and subtracted off. Compared to the standard detector-by-detector sky estimation this approach yields slightly larger small-scale background residuals, but – critically important for this project – does preserve extended galaxy structures that otherwise are modeled as part of the background and removed from the images. Table 1 summarizes image resolutions and limiting surface brightnesses for all UV, optical, and near-IR datasets used here.
Summary of image resolution and photometric depth for the UV, optical, and near-IR datasets.
To calculate the continuum-subtracted Hα images we scale both N662 and r-band images to the same instrumental zeropoint, and in a first step subtract the narrow-band image from the broad-band image, accounting for the different filter widths, to obtain a line-free image. Using this line-free image we then subtract the underlying continuum from the narrow-band data to finally yield the pure nebular emission map of the entire region. As the narrowband and r-band filters have different filter widths and are not centered on the same central wavelength, there remains a small, systematic trend of the required scaling factor on the optical color of the region. Based on results from stellar population modeling using GALEV (Kotulla et al. 2009) we estimate that ignoring this trend adds uncertainties in the narrow-band flux of < ∼ 10% for typical galaxy colors (g − r in the range between 0.2 mag to 0.7 mag). Other sources of uncertainties in the narrow-band are small-scale photometric uncertainties due to pixel-noise (equivalent to 6.5 × 10⁻⁴ M⊙ yr−1 kpc−2) and large-scale background variations due to galactic cirrus and scattered star-light around bright stars (equivalent to ∼10−3 M⊙ yr−1 kpc−2, measured on a spatial scale of ∼1 arcmin). For all galaxies at the heart of this study this latter large-scale variation is the dominating factor in the measured uncertainty for derived star formation rates. The resulting data, focused on the central part of Hydra, is shown as a multiband color composite in Fig. 1.
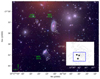 |
Fig. 1. Three galaxies in the foreground group are detected in HI: the ring galaxy (top left), NGC 3312 (top right), NGC 3314a (center bottom). The contours show that NGC 3312 and NGC 3314a are moving across the front of the cluster. H I contours (gray lines) are plotted at (1.2, 2.4, 4.8, 9.6) × 1020 cm−2 which corresponds to (4, 8, 16, 32) times the rms in a single 44 km s−1 channel. H I contours for NGC 3314b are excluded for clarity (Fig. 2). This false color image has been made from a composite of all optical DECam data, including Hα. The small inset plot in the bottom right shows X-ray contours based on ROSAT All-Sky Survey data (Voges et al. 1999). The position of our three galaxies of interest is shown with the black stars. The blue box shows the size and location of the field presented in the large panel. In both panels north is up and east is left, parallel to the figure axes. |
2.3. Infrared imaging
We retrieved archival 3.6 μm Spitzer Space Telescope (Werner et al. 2004), Infrared Array Camera (IRAC; Fazio et al. 2004) imaging for NGC 3312 and NGC 3314a/b, which we use to calculate the stellar mass surface density, Σ*, of the galaxies. The native units of the calibrated images are in units of Jy steradian−1 which we convert to M⊙ kpc−2 assuming a mass-to-light ratio of 0.47 (McGaugh & Schombert 2014). In the case of NGC 3314 we also have a stellar surface density map derived from stellar population fits (see Sect. 3.1.3) to our optical data detailed above that provides an excellent confirmation (scatter < 0.2 dex) to our results derived from the Spitzer infrared data. The data quality is summarized in Table 1.
The 3.6 μm Spitzer maps are then used to infer the Σ* where ram pressure stripping is occurring (see Sect. 3.1). The H I contours where we infer the hot ICM is interacting with the cold ISM span a range of values. Therefore, we use maps of binned Σ* to estimate the approximate stellar mass surface density where ram pressure is occurring and include the bin widths in the error budget. These maps are presented in Appendix B.
For comparison across our multiwavelength data we also report the global measurements of the stellar mass and star formation rates from the WISE Extended Source Catalogue (WXSC; Jarrett et al. 2013, 2019) which include the scaling relations of Cluver et al. (2014, 2017). The WXSC was specifically created to characterize resolved galaxies using specially constructed native resolution stacked mosaics derived from the classic WISE mission (Wright et al. 2010) and the ongoing NEOWISE mission (Mainzer et al. 2011) imaging products. The star formation rate and stellar mass of each galaxy reported in Tables 2 and 3, respectively.
Star formation rates for the stripped material and total star formation rates over the entire galaxy.
Galaxy properties and ram pressure parameters.
2.4. UV imaging
We retrieved archival GALEX (Martin et al. 2005; Morrissey et al. 2007) near- and far-ultraviolet (NUV/FUV) imaging from the GALEX Science Archive, covering all three systems of interest here. The Hydra region was observed as part of the GALEX All-Sky Imaging Survey, with short exposure times of only 210s in each NUV and FUV, resulting in relatively shallow data with a comparably low image resolution of ∼5 arcsec. Nevertheless, it provides sufficient image depth to detect even low-level star formation within the stripped material as discussed in Sect. 3.2.2. The data quality is again summarized in Table 1 while UV derived star formation rates are in Table 2.
3. Results
Figure 1 provides an overview of the gas rich galaxies southeast of the Hydra cluster core. NGC 3311, the central cD galaxy of the cluster is on the top right edge of a false-color u, g, r, i, z, Hα DECam image. H I detected galaxies NGC 3312, NGC 3314a, and LEDA 753342 are shown with their H I contours. In addition, we also detect NGC 3314b in H I (Fig. 2), the close to edge-on spiral galaxy seen in nearly perfect projection behind NGC 3314a. The detected X-ray halo of Hydra, shown in the inset, is centered on NGC 3311 and extends symmetrically to a radius beyond NGC 3314a/b (Fitchett & Merritt 1988; Hayakawa et al. 2004).
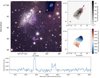 |
Fig. 2. H I morphology and kinematics of NGC 3314b. Left: DECam false color image with H I total intensity contours at (1.2, 2.4, 4.8, 9.6) × 1020 cm−2 which corresponds to (4, 8, 16, 32) times the rms in a single 44 km s−1 channel. North is up and east is left, parallel to the figure axes. MeerKAT beam is the ellipse in the top right. Top right: H I total intensity gray scale. Red dashed and orange dot-dashed lines indicate the direction of motion or wind through the ICM as implied by the steep H I contours and the H I tail, respectively. Purple arrow indicates direction to center of the Hydra cluster (NGC 3311). Middle right: H I intensity-weighted velocity map. Bottom: integrated H I profile. NGC 3314b is at ∼4700 km s−1; the emission below ∼3000 km s−1 is H I associated with NGC 3314a in the foreground (see Fig. 3). |
The H I and optical imaging show some of our key results: (1) NGC 3314a is a classic “jellyfish” galaxy with bright star forming regions coincident with an extended H I tail; (2) NGC 3312 has a sharply swept-back disk with the H I disk edges now trailing behind the galaxy as it moves through the cluster; (3) the ring galaxy, LEDA 753342, is not obviously experiencing ram pressure; and (4) NGC 3314b has already lost a significant amount of its H I gas through its interaction with the ICM. As the deepest H I observations to date, with excellent spatial resolution, combined with deep optical imaging, we report the conclusive observation of active ram pressure stripping in NGC 3312, NGC 3314a, and NGC 3314b. The first two galaxies show not only gas loss through truncated H I disks and extended H I tails (Fig. 3), but active star formation in Hα streams and clumps in and around the stripped gas. NGC 3314b reveals a late-type galaxy at a more advanced stage of RPS.
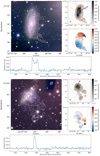 |
Fig. 3. H I morphology and kinematics: top set of images is NGC 3312; bottom is NGC 3314a. Left: DECam false color with H I contours at (1.2, 2.4, 4.8, 9.6) × 1020 cm−2 which corresponds to (4, 8, 16, 32) times the rms in a single 44 km s−1 channel. North is up and east is left, parallel to the figure axes. MeerKAT beam is the ellipse in the top right. Top right: H I total intensity gray scale. Red dashed and orange dot-dashed lines indicate the direction of motion or wind through the ICM as implied by the steep H I contours and the H I tail, respectively. Purple arrow indicates direction to center of the Hydra cluster. Middle right: H I intensity-weighted velocity map. Bottom: integrated H I profile. The ultra diffuse galaxy, UDG 32, recently reported by Iodice et al. (2021) is visible to the lower right of NGC 3314a, outside the H I contours. |
The alignment of NGC 3314a and NGC 3314b is critical to interpreting the relative location of the galaxies in Hydra and their motion through the cluster. NGC 3314a is in the foreground at lower systemic velocity. NGC 3312 and LEDA 753342 share roughly the same velocity as NGC 3314a. At some 1850 km s−1 higher velocity, NGC 3314b is both behind NGC 3314a – as evidenced by the foreground dust lanes of NGC 3314a in optical imaging (Keel & White 2001) – and at higher redshift. This is unusual because it is expected that foreground galaxies falling into the cluster should be red-shifted with respect to the cluster velocity, and background galaxies should be blue-shifted: the opposite to what we see here. The H I systemic velocity of NGC 3314b agrees with previous identifications of the Hα in long slit spectra (W. Keel, priv. comm.).
At projected distances of 110−220 kpc, all four of these galaxies are peculiar for their H I-richness seen in close projection to the center of the Hydra cluster. By comparison, the closest H I-detected galaxy to the cluster center in Virgo – a similar mass cluster – is NGC 4388 (log(MHI/M⊙)=8.56; Oosterloo & van Gorkom 2005) which sits at 370 kpc and hosts a severely truncated H I disk (Yoon et al. 2017). The closest H I detection in the relatively lower mass Fornax Cluster is NGC 1427A (log(MHI/M⊙)=8.32), which sits at a projected distance of ∼280 kpc from the center while the second closest H I detection is more than twice as far from the cluster center (Loni et al. 2021). Further, the H I morphologies of the four H I detections in Hydra, the orientation of their H I and Hα tails – in two cases perpendicular to the direction to the cluster center – and their velocities relative to the cluster center tell a more complex story than the simple radial accretion of H I-rich objects which has been revealed to date in other clusters (e.g., Virgo, Chung et al. 2009; Coma, Solanes et al. 2001; Molnár et al. 2022; and Antlia, Hess et al. 2015).
In the following subsections we discuss in detail the H I and optical morphologies that are the result of ram pressure stripping as well as the inferred direction of motion with respect to the cluster, and we compare these to simulations. We also quantify the amount of stripped material that is detected and the star formation that is occurring in the stripped material. Table 3 lists the measured and derived properties of the H I detected galaxies and Table 2 lists the total star formation in the galaxies and estimated star formation in the stripped material.
3.1. Ram pressure stripping in action
The interstellar medium of galaxies can be stripped by the hot intracluster medium if the pressure of moving through the medium is greater than the gravitational restoring force of the galaxy (Gunn & Gott 1972; see also Köppen et al. 2018):
 (1)
(1)
where ρICM is the density of the ICM, vICM is the wind velocity of the galaxy relative to the ICM, G is the gravitational constant, Σ* is the stellar mass surface density, Σg is the gas surface density. To be more precise 2πGΣ* should be generalized to represent the gravitational potential of the galaxy, including the contribution of dark matter halo, however the above formulation allows for easy comparison with measurable baryonic quantities.
In particular, the ram pressure condition from Gunn & Gott (1972) is for a galaxy experiencing a wind face-on (wind angle of 0°). NGC 3312, NGC 3314a, and NGC 3314b all appear to be inclined to some degree with respect to the ICM wind. A number of authors have attempted to generalize the formula and found through simulations that there is no apparent correlation between inclination angle with respect to the ICM wind and total mass loss, except for the largest angle values (> 60°; Vollmer et al. 2001b; Roediger & Brüggen 2006; Jáchym et al. 2009). Roediger & Brüggen (2006) also point out that the tails are not always aligned with the direction of motion: their orientation can also be dependent on the column density at which they are measured and the observed inclination angle of the galaxy. What happens to the stripped material likely depends on a combination of factors so that some fraction of the gas may be heated and lost to the ICM; some fraction may be in gravitationally bound clumps which can be stabilized or collapse to form stars; and some gas may not escape the galaxy at all, but fall back onto the disk (Vollmer et al. 2001b). In NGC 3312, NGC 3314a, and NGC 3314b we see evidence for all three of these scenarios occurring.
3.1.1. H I morphology
Comparison with simulations can help infer a more accurate estimate of the direction of motion. In the top right of Figs. 2 and 3 we show the projected direction of motion that is implied for the galaxies by (1) where the steepest H I contours encounter the highest stellar mass surface density of the disk (red dashed line) and (2) the angle of the H I tails with respect to the major axis of the disk (orange dot-dashed line). In general, these agree within a projected ∼30° of each other. We also include the vector between the galaxy center and the center of Hydra (NGC 3311; purple arrow). Strikingly, for NGC 3312 and NGC 3314a, this vector is nearly perpendicular to the implied direction of motion, in contrast to the simple picture of infalling galaxies on radial orbits. Below, we compare the H I morphologies to simulations of ram pressure at different wind angles from Roediger & Brüggen (2006; see also figures from simulations in Vollmer et al. 2001b; Roediger et al. 2006; Roediger & Brüggen 2008).
NGC 3312: appears to be experiencing a relatively low wind angle (nearly face-on). The central H I disk appears largely unimpacted by the ram pressure, with the inner disk having a relatively flat H I distribution at 1021 cm−2, while the galaxy outskirts are swept back (Fig. 3). The H I tail off the southern edge of the galaxy is longer than the northern edge. Compared to the top panels of Fig. 5 in Roediger & Brüggen (2006, 2008), this would suggest that the wind angle is ∼30° from face-on. This is also consistent with the sharpest dust lanes appearing on the north side of the galaxy. The simulations also suggest that NGC 3312 has only been under the influence of ram pressure for a few 100 Myr, however, the galaxy is also massive: its uncorrected H I line width spans almost 600 km s−1. Thus it may able to hold onto gas at its center despite pressure from the ICM.
NGC 3314a: appears to have a large wind angle (close to 90°) which is seen nearly face-on in the plane of the sky, akin to the central column of Fig. 6 in Roediger & Brüggen (2006). Nearly the entire disk appears to be impacted by the ram pressure. Compared to NGC 3312 and despite the confusing background galaxy, this is almost certainly a relatively low mass spiral.
NGC 3314b: also appears to have a large wind angle, but is viewed close to edge-on in the plane of the sky, akin to the left column of Fig. 6 in Roediger & Brüggen (2006; or middle panel of Fig. 2 in Jáchym et al. 2009). However, we propose it is observed at much later times or is experiencing higher ram pressure than displayed in the hydrodynamic simulation: the galaxy has essentially no H I tail, although the H I contours are compressed on the western side of the galaxy, and the H I disk appears to flare slightly on the east side of the galaxy.
LEDA 753342: based on the H I, this galaxy is either just beginning to experience ram pressure, or does not appear to at all (Fig. 4). The galaxy is optically faint, and relatively narrow in H I and thus expected to be very low mass. Its optical appearance, which could be a result of tidal interactions, has yet to be explained as there are no obvious interacting neighbors. The H I is symmetrically distributed while the optical has a ring- or arrow-like (pointing down) morphology.
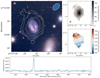 |
Fig. 4. H I morphology and kinematics of LEDA 753342. Left: DECam false color image with H I total intensity contours at (1.2, 2.4, 4.8, 9.6) × 1020 cm−2 which corresponds to (4, 8, 16, 32) times the rms in a single 44 km s−1 channel. North is up and east is left, parallel to the figure axes. MeerKAT beam is the ellipse in the top right. Top right: H I total intensity gray scale. Middle right: H I intensity-weighted velocity map. Bottom: integrated H I profile. |
3.1.2. H I velocity maps
The intensity-weighted velocity (moment 1) maps provide information on the gas motions along the line of sight. Since stripped gas most likely originated in the rotating thin or thick disk of the galaxies, motion which deviates from rotation can tell us about how the galaxy is moving along the line of sight, or how drag from the ICM may be impacting the stripped gas (Haan & Braun 2014).
NGC 3312: the H I disk appears to follow normal galaxy rotation, and the velocity of stripped gas is clearly imprinted with this rotation: the northern tail is redshifted compared to the systemic velocity of the galaxy and the southern tail is blue-shifted compared to the systemic velocity. However, if we compare the velocity of gas in the tails relative to the velocities in the disk from which the gas appears to originate (draw a straight line along the length of the tail to where they intersect the main disk), the gas in both tails is at higher velocities relative to the disk. If the stripped gas is experiencing drag from interaction with the ICM, this would imply NGC 3312 is moving toward us in its orbit.
NGC 3314a: this velocity field is complex and the galaxy is viewed close to face-on. We propose that the major axis is aligned just east of north: the gas on the top and leading edge of the galaxy is generally redshifted with respect to the systemic velocity, while the gas coincident with the southwest part of the stellar disk is blue-shifted. The two H I tails differ in their velocity structure. The western tail increases in redshift with distance from the disk and contains the highest redshifted gas. The eastern tail is less blue-shifted than the most blue-shifted gas in the disk. We suggest that the gas in the tails originated in different parts of the galaxy and, if they are experiencing drag, the velocities are also consistent with the galaxy moving toward us with respect to the cluster. Another possibility may be that the complex tail kinematics indicate gas is falling back onto the galaxy after it has been stripped (J. Kenney, priv. comm.), although simulations suggest this may take a few 100 Myr before a steady state with backflow can be reached (Roediger et al. 2015; Tonnesen 2019).
NGC 3314b: the H I kinematics appear generally consistent with a rotating disk viewed close to edge-on. However, on the northeast side of the galaxy, there is blue-shifted gas that appears to have been swept back by ram pressure because the velocity contours are bent counter-clockwise. This would be consistent with an ICM wind felt from the northeast as suggested by the H I contours of the total intensity map (Fig. 2).
Despite the above discussion, we caution that the MeerKAT data were observed at low velocity resolution, ∼44 km s−1, compared to the typical H I velocity dispersion in late-type galaxy disks of ∼10 km s−1. Detailed modeling of the ram pressure in these galaxies would benefit from future high resolution imaging with MeerKAT in 32K mode.
3.1.3. Star formation and stellar properties
In deep optical data, both NGC 3312 and NGC 3314a show obvious signs of ongoing ram-pressure stripping, in the form of clumpy filaments extending outwards toward the southwest from the main body of the galaxy (Figs. 3 and 6).
In addition to the filaments, NGC 3312 presents morphologically as a largely undisturbed spiral galaxy in the optical with one peculiarity: the northeastern edge (i.e., the side opposite the filaments) is noticeably bluer than the southwestern side, with only weak spiral features visible in any optical or infrared bands, and no apparent dust lanes (see the color-map in the middle panel of Fig. 5). The trailing, southwestern side shows more typical features with discernible dust lanes and spiral arms. At the boundary between the blue and dust-free outer northeastern parts and the more dusty central parts, as well as near the front of the spiral arms toward the north, we observe a number of bright star formation sites luminous in both narrow-band Hα and GALEX near- and far-UV (Martin et al. 2005; Morrissey et al. 2007).
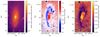 |
Fig. 5. Results from the spatially resolved SED fitting for NGC 3312. Left panel: stellar mass surface density. Middle panel: observed g − i color index. Right panel: inferred internal dust reddening E(B − V). Not shown are the stellar population age map, showing consistently old ages throughout the entire face of the galaxy, with the exception of several very young regions coinciding with sites of active star formation where the youngest stellar population outshines the underlying, older generations. |
To determine the underlying cause for the bluer colors in the NW part of the galaxy – both a younger stellar population as well as reduced dust content would be plausible explanations – we performed a spatially resolved spectral energy distribution (SED) fitting. After extracting the relevant areas from the full mosaic data, we binned the data 2 × 2 to a pixel-size of 0.66 arcsec to improve signal-to-noise and extracted five-band SEDs for each pixel. For comparison we generated a synthetic stellar population model using GALEV (Kotulla et al. 2009), assuming a star formation history with constant star formation rate (SFR), solar metallicity, and a Salpeter (1955) initial mass function. Foreground dust reddening was based on Schlafly & Finkbeiner (2011) and taken from NED to convert the observed reddening into band-pass specific extinctions using the empirical calibrations from Yuan et al. (2013). Free parameters during the fit were the galaxy age, stellar mass, and dust extinction (assuming a Calzetti et al. 2000 extinction law). This yielded, for each pixel, a corresponding stellar population age, stellar mass, and dust content.
The results of this modeling are shown in Fig. 5; not shown are the stellar population age, which were nearly constant near the maximum allowed age of 13.6 Gyr. The only exceptions were several very young regions that coincide with the location of sites of intense star formation activity mentioned above. As expected, the stellar mass distribution is largely smooth and centrally concentrated. One key finding is the distribution of dust extinction; the bluer regions on the NE side of the galaxy have significantly lower dust contents than the central and SW parts of the galaxy. In the context of ram-pressure stripping this suggests that the interaction with the ICM on the wind-facing side of the galaxy either removed or destroyed most, if not all dust in this area, exposing the intrinsic, unobscured stellar populations (Crowl et al. 2005; Abramson et al. 2011). This lack of dusty, cold gas and the associated lack of star formation activity then also explains the absence of obvious spiral structure in this region. Finally, we note that the stellar mass surface density shows no signs of tidal interactions on either the north or south side of NGC 3312, in agreement with deep imaging in both the optical and mid-IR from Spitzer.
3.2. Quantifying the stripped material
NGC 3312 and NGC 3314a are mostly likely still early in their interaction with the cluster ICM and so while gas has been removed, we suppose that most of the stripped material is still in the form of H I in the tail, or has collapsed to form stars. In the following subsections we quantify the amount of stripped material in both H I and ongoing star formation to make an order of magnitude quantification of the fate of the stripped H I.
3.2.1. Stripped H I
In order to estimate the amount of H I that has been stripped from its original location in the galaxy disk, we used a combination of the H I contours and binned stellar mass surface density from Spitzer IRAC images (Fig. B.1). We assumed that the majority of the gas seen in projection outside the stellar disk is stripped. Therefore, we excluded H I that is coincident with the stellar disk above a stellar mass surface density of 0.25 M⊙ kpc−2, and H I that appears still connected to the stellar disk and with column densities greater than 2.4 × 1020 cm−2. This is the same contour level at which we estimate the impact of ram pressure at the leading edge of the galaxy disks in Sect. 4. In particular, the H I criteria allows us to account for gas that is still in the face-on disk of NGC 3314a but, being dominated by young stars and dust, the stellar component is not bright in the infrared.
For NGC 3312, we estimate 5.0 × 10⁸ M⊙ or 8 ± 1% of the measured gas mas is in the stripped component. The H I on the southwest edge of the galaxy, which also features star forming streams, extends to about 30 kpc from the disk, as measured from perpendicular to the kinematic major axis.
For NGC 3314a, we estimate 1.1 × 10⁹ M⊙ or 38 ± 4% of the measured gas mass. The southernmost part of the H I tail extends to about 40 kpc from the optical galaxy center.
For NGC 3314b, the H I disk is truncated with respect to optical disk, and in fact it would seem that any H I tail that previously existed has been destroyed through its ongoing interaction with the cluster – whether by heating from the ICM or multiple encounters with other galaxies.
3.2.2. Star formation in stripped material
To estimate star formation rates in the stripped material we visually defined regions encompassing most to all of the detectable emission outside the main body of the galaxy in either UV or continuum-subtracted Hα. The regions are shown as contours in Fig. 6, overlaid on a color-composite made from imaging in NUV, optical, and narrowband Hα. We only included regions that likely belong to the tails based on location, shape, and brightness, omitting more distant regions of Hα emission where this association would have been less certain. (Defining regions algorithmically, for example based on a specific surface brightness limit, would have resulted in unphysically complex and fragmented regions, or encompassed large chunks of empty sky that only adds noise with little to no incremental signal.) In the case of NGC 3312 the star forming material is more diffuse, so the selected region is larger to include as much of the low-surface brightness emission as possible; several foreground stars, shown as crossed-out boxes, are excluded from the region. In NGC 3314a we observe a more clumpy distribution and thus could select significant emission in a number of brighter clumps. We note that for both galaxies there is likely additional diffuse UV and Hα emission outside these regions, so our quoted luminosities and derived star formation rates for these regions only present lower limits to the true values. However, given the comparably larger uncertainties in discriminating between tail and disk star formation, we believe they represent the best possible approximations given the data at hand.
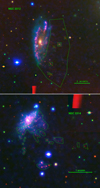 |
Fig. 6. Color-composite images combining observations in GALEX near-UV (blue channel), DECam r-band (green channel), and continuum subtracted Hα (red channel) of NGC 3312 (top panel) and NGC 3314 (bottom panel). Each panel also shows the regions used to estimate the current star formation rate in the stripped material. The tail region of NGC 3312 is contaminated by several foreground stars; these have been excluded (see crossed-out patches for masked areas) before integrating the total Hα luminosity of the region. |
To integrate the observed fluxes across all bandpasses – continuum-subtracted Hα, NUV, and FUV – we add up the flux in all enclosed pixels, excluding the areas of the foreground stars in NGC 3312. To account for background contamination and to estimate uncertainties, we placed the identical aperture on a large number of random positions throughout the image. The median brightness across these random apertures, after excluding outliers, was then subtracted as background from the integrated fluxes in our science apertures. The scatter of these random apertures is taken to represent the inherent measurement uncertainties. All intrinsic measurements were then converted first to physical fluxes and subsequently to luminosities, corrected for dust extinction (see description for the optical SED fitting above). They are listed in Table 2. Overall we find a reasonable agreement between results from the different bandpasses for the outlying areas; measurements in the Near-UV are most sensitive to dust-corrections, and a small overestimation of the foreground extinction can account for the larger SFRs derived from the NUV. Integrated values for NGC 3312 and NGC 3314 as a whole agree less well, largely due to the unknown correction for dust internal to each galaxy. As such the quoted values for the total FUV, NUV, and Hα represent lower limits to the actual star formation rate.
4. Discussion
Multiple authors have suggested that NGC 3312, NGC 3314a, and LEDA 753342 may belong to either foreground cluster substructure, or a foreground interacting galaxy group which is seen in projection along the line of sight (Kurtz et al. 1985; Fitchett & Merritt 1988; McMahon et al. 1992; Valluri et al., in prep.). As a foundation for our discussion, Fig. 7 shows the velocity distribution of galaxies with known redshift within in the Hydra cluster from the 6dF Galaxy Survey Data Release 3 (6dFGS; Jones et al. 2009). We indicate the velocities of our four H I detections, as well as the giant cD elliptical at the core, NGC 3311. We also show the velocity distribution of galaxies within 40′ of the cluster center. Fitchett & Merritt (1988) presented a similar plot to demonstrate evidence for the presence substructure along the line-of-sight. Specifically, they suggested 2−3 substructures in the velocity distribution at ≤3100 km s−1 (foreground), > 3100 km s−1 (cluster center), and peaking at ∼4400 km s−1 (background). While our presentation of the 6dFGS data contains 45% more galaxies within 40″ than the original Fitchett & Merritt (1988) histogram, the suggestion of a velocity component centered around 2850 km s−1 is still evident – as well as a relatively flat distribution at higher velocities.
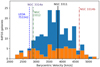 |
Fig. 7. Hydra cluster galaxy velocities from 6dFGS (Jones et al. 2009). Blue histogram includes all galaxies within ∼3° (∼2 rvir) of the cluster center. Orange histogram includes galaxies within 40″ of the cluster center. NGC 3311 is the nominal cluster center. NGC 3312, NGC 3314a, and LEDA 753342 appear to belong to substructure at lower systemic velocity along the line of sight. NGC 3314b is substantially redshifted with respect to the cluster center. |
While NGC 3312, NGC 3314a, and LEDA 753342 lie within the apparent velocity dispersion of the Hydra cluster, a pure redshift distance would place them at 46 Mpc as compared to the 58.6 Mpc cluster distance. Given the strong ram pressure experienced by NGC 3314a and NGC 3312, and the lack of an X-ray substructure at that location which could be attributed to the foreground group (implying a hot local IGM responsible for the stripping), we find the 12 Mpc distance from Hydra implied by the objects’ redshift to be at odds with the typical 1.4 Mpc virial radius of the cluster within which galaxies experience strong ram pressure. Our multiwavelength data, and in particular the H I morphology, allows us to put new quantitative constraints on the position and orbits of the galaxies that were not possible before, allowing us to locate the position of potential cluster substructure.
4.1. Constraining real galaxy distances to the cluster center
The strength of the ram pressure force felt by a galaxy is dependent in part on the density of the medium through which it moves. The dominant X-ray emission mechanism in clusters is thermal bremsstrahlung and is generally modeled as an isothermal gas in hydrostatic equilibrium. From this Beta model one can calculate the ICM density as a function of cluster radius (Cavaliere & Fusco-Femiano 1976, 1978; Sarazin 1988):
![Mathematical equation: $$ \begin{aligned} \rho (r) = \rho _0 \left[1+\left(\frac{r}{r_{\rm c}}\right)^2\right]^{3\beta /2} \end{aligned} $$](/articles/aa/full_html/2022/12/aa43412-22/aa43412-22-eq5.gif) (2)
(2)
where ρ0 is the central density of the cluster; r is distance from the cluster center; rc is the core radius of the cluster ICM; and β is the power law index.
McMahon et al. (1992) modeled the Einstein IPC X-ray surface brightness using a geometric deprojection to estimate the ICM density of 2.6 × 10⁻³ cm−3 at the projected location of NGC 3312. Using this value and the fact that their lowest H I contour, at NHI = 6 × 1020 cm−2, did not clearly show evidence for ram pressure stripping, they argued that the galaxy must be in the foreground of the main Hydra cluster core. Recently Wang et al. (2021) also showed that at the projected position in the cluster, NGC 3312 should be stripped over the entire disk.
We now re-examine this calculation in the context of our deeper H I data. We combine the ram pressure stripping condition (Eq. (1)) with a Beta model of the ICM (Eq. (2)) based on the diffuse X-ray emission to estimate the ICM density as a function of radius and constrain the location of each galaxy within a shell around the cluster (Fig. 8).
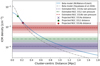 |
Fig. 8. Beta models of the Hydra cluster intracluster medium versus estimates of ram pressure experienced by each galaxy. The lines provide the best estimate for each galaxy. The shaded areas show an estimated uncertainty for the contributions of dark matter, the wind angle, velocity through the ICM, and errors in stellar mass surface density. These uncertainties have been added in quadrature and are displayed as the vertical bars to the right of the plot. See text for details. |
We consider two different Beta models based on different X-ray observations. In the first instance, we adopt the same central density as McMahon et al. (1992) of ρ0 = 5.0 × 10⁻³ cm−3 and assume a value of β = 0.67 and r500 = 823 kpc estimated from ROSAT observations (Eckert et al. 2011; r500 = 0.19 rc). In the second instance, we use the same model adopted by Reynolds et al. (2021) to model ram pressure stripping in ESO 501−G075 at the outskirts of Hydra. In this case, ρ0 = 1.1 × 10⁻² cm−3, β = 0.69, and rc = 90.9 kpc based on XMM-Newton data from Hayakawa et al. (2006). The difference between these two ICM models can be seen in Fig. 8. The two models predict roughly the same values for ICM density at the projected distances of NGC 3312 and NGC 3314a/b, however they vary by roughly 20% at larger radii.
The ram pressure condition in Eq. (1) can then be rearranged to directly compare the observed H I and optical galaxy properties with the modeled ICM density:
 (3)
(3)
Our assumed values for each term are presented in Table 3. We estimate the velocity of the galaxy with respect to the ICM from the velocity dispersion of the cluster,  , where σv = 440 km s−1 for the Hydra cluster core (McMahon et al. 1992), or σv = 690 km s−1 which includes all galaxies along the line of sight (Lima-Dias et al. 2021). We note that for each galaxy, these vICM values are consistent with the line-of-sight difference in redshift between the galaxy and NGC 3311.
For the gas surface density, Σg, we take the second lowest H I contour in Figs. 2 and 3. This column density is consistent with where the contours on the leading edge of the galaxies are steeply rising and where, on the tailing edge, the H I morphology just shows signs of gas dragged out the disks by ram pressure.
Finally, we estimate the stellar mass surface density, by taking binned values of Σ*, and identifying where our chosen H I contour intrudes on the stellar disk (Fig. B.1). This is obviously imperfect for NGC 3314a/b. Based on the examination, of Figs. 3 and B.1, we believe that the Σ* at which the steepest H I contours for NGC 3314a are observed lie roughly above the inclined disk of NGC 3314b, and therefore assume they are mostly contributed to by the (fainter) face-on NGC 3314a spiral. However, NGC 3314b could be contributing a third of the stellar mass at that radius which we include in our error budget in below. The Σ* at which the steepest H I contours for NGC 3314b are more clearly observed to lie outside the brightest part of the NGC 3314a and are estimated to be dominated by the relatively edge-on NGC 3314b disk. By using Spitzer IRAC imaging, we assume that the calculation of Σ* is not greatly impacted by dust attenuation (typical dust extinctions in spiral galaxies have been found to be AV ∼ 0.6 mag (Masters et al. 2010), corresponding to a AIRAC ∼ 0.03 mag using the scaling factors from Yuan et al. 2013), and therefore our estimates are, at worst, an over-estimate due to the superposition of the galaxies.
Figure 8 shows the Beta model versus the restoring force within NGC 3312, NGC 3314a, and NGC 3314b at the point where gas is estimated to now being stripped. Where the Beta model and the estimated ram pressure density intersect represents a best estimate of the galaxies’ current distance from the cluster. In fact, there is significant uncertainty, which we attempt to capture in the plot. At least four factors contribute to change the ram pressure estimate in different ways. First, gas and stars are not the only component of galaxies, and dark matter may also exhibit some gravitational restoring force. This will be more important for low mass, low surface brightness galaxies (NGC 3314a) than for high mass and/or high surface brightness galaxies (NGC 3312, NGC 3314b). More mass in the disk will increase the necessary ICM density, suggesting the galaxies are closer to the cluster core. We include 50%, 30%, and 30% uncertainty for NGC 3314a to NGC 3314b, and NGC 3312, respectively, in general agreement with the broad distribution of the baryonic-to-dark matter mass fraction estimated by Martinsson et al. (2013, see their Fig. 14) for disk-like galaxies.
Second, galaxies experiencing an edge-on wind may require a greater force to remove the gas, also effectively increasing the required ICM density in this plot. This may be important in NGC 3314a and NGC 3314b, which are experiencing a more edge-on ICM wind (likely > 60°). The impact of inclination is highlighy uncertain. We choose to estimate a 30% uncertainty, consistent with the case of medium ram pressure in Roediger & Brüggen (2006).
Third, our vICM estimates may still be underestimates since, in all cases, they are approximately equal to the δv between the galaxy and NGC 3311, allowing no budget for velocity in the plane of the sky. If the galaxies are moving faster than we estimate, they require a lower ICM density to remove the gas, implying the galaxies are further from the cluster center. We include a factor of  , equivalent to a ∼40% uncertainty for all galaxies, to account for additional motion in the plane of the sky.
Finally, in the case of NGC 3314a and NGC 3314b we may be overestimating the stellar mass surface density due to their overlap (and if for example dark matter is unimportant in these disks). With less mass in their disks, they require less ICM density to be impacted at the same level by ram pressure. We include a 33% (as stated above) and 20% uncertainty in the overestimate of the Σ* for these two galaxies, respectively.
In Fig. 8 we show the contribution of these factors by plotting them in shaded bands around our ram pressure “best estimate”. Finally, we add them in quadrature to give a sense of the full error budget. Of course, these are not formal errors, but are meant to be indicative of the unknowns. The uncertainties may change the cluster-centric distance estimates by ±15% for NGC 3312; ±30% for NGC 3314a; and  for NGC 3314b, assuming the Beta model described by Hayakawa et al. (2006), or more if the Beta model is shallower (McMahon et al. 1992; Eckert et al. 2011).
Nonetheless, our current best estimate is that NGC 3314b sits at ∼300 kpc from the cluster center. NGC 3314a must be in the foreground, and we estimate it is ∼800 kpc from the cluster center. NGC 3312 is estimated to be at ∼550 kpc from the cluster center; the question is whether it is in the foreground or background. NGC 3312 and NGC 3314a share essentially the same systemic velocity, are experiencing an ICM wind from similar directions, and appear to belong to the same velocity substructure group along the line of sight (Fig. 7). We propose that the favored scenario is that NGC 3312, NGC 3314a, and a handful of other galaxies belong to coherently moving substructure in the foreground of the cluster, moving toward us. As discussed later this implies they have passed the cluster pericenter and survived with significant amounts of H I.
4.2. Timescales for stripping
To estimate a lower limit to the timescale for the stripping duration, we can use the maximum extent of the stellar material and the velocity of the galaxy relative to the cluster ICM. Consistent with our earlier assumptions of  , we estimate a relative velocity of ∼1100 km s−1 for NGC 3312 and NGC 3314a through the cluster. In a conservative scenario we can expect that the stripped gas is instantly slowed down to ICM rest velocity as it is stripped out of the galaxy (in reality, as shown by simulations, at least some of the gas follows the main body in a slipstream and thus at a reduced relative velocity; Roediger et al. 2015). Based on our deep narrow-band imaging, we find faint SFR activity in the tail of NGC 3312 out to a relative distance of 36 kpc (2.1 arcmin; assuming distance of 58.6 Mpc) and potentially out to 66 kpc. For NGC 3314a, we find similar extents, with detections out to distances of 37 kpc and maybe as far 59 kpc. We note that these distances, derived from optical data, extend beyond the outermost contours in the H I data where the low column densities are likely due to gas being dispersed and/or being used up in star formation. With these distances and relative velocities we derive a conservative estimate to the duration of the stripping event of 32−59 Myr for NGC 3312 and 33−53 Myr for NGC 3314a.
These timescales are lower limits to the real duration; older star formation at larger distances are no longer detectable, and we have made no corrections due to projection angles, or gas not instantly coming to a full stop with respect to the ICM, which could easily add factors of several to the estimate. In addition, we could be overestimating vICM which would also imply a longer timescale over which the material had been stripped (see also our discussion of tangential orbits in Sect. 4.3). Estimates for ram pressure timescales from simulations are of order a few 100 Myr (Schulz & Struck 2001; Roediger & Hensler 2005), or longer when a varying ICM, radiative cooling, or magnetic fields are taken into account (Tonnesen 2019).
Comparing these timescales with the current SFR obtained earlier (see Table 2), we estimate a total stellar mass on the order of 1−48 × 107 M⊙ in the stripped material in each of the two galaxies. This is significantly lower than the total mass estimate derived from H I, which is on the order of a few times 108 M⊙. However, if we account for typical star formation efficiencies on the order of a less than 1 to a few percent (Evans et al. 2009; Murray 2011) both the estimates for total H I mass, current SFR, and total new stellar mass agree with each other. Our estimate for the amount of stripped mass is also consistent with recent simulations of galaxies under similar vICM, ρICM conditions (Lee et al. 2020).
4.3. Final thoughts: Galaxies on outfall, tangential orbits, past interactions, and formation of UDGs
With H I and Hα tails nearly perpendicular to the cluster-centric direction, and highly blue-shifted velocities with respect to the cluster systemic velocity, NGC 3312 and NGC 3314a must be past their first pericentric passage of the cluster and effectively on outfall. This implies they have also already experienced their strongest maximum pressure and it will only get weaker, until they hit apocenter of their orbits and infall again.
The general wisdom on how gas loss occurs in clusters is mixed. On the one hand, simulations or analytical arguments have been made that infalling galaxies are mostly stripped of gas by the time they reach the center of the cluster (e.g., Brüggen & De Lucia 2008). In this context, how NGC 3312 and NGC 3314a could have passed pericenter and still be so gas-rich is not clear. Whether NGC 3314b is still on first infall or outfall, its H I content has also survived to reach significantly close to the cluster center. On the other hand, more recent analysis suggests that galaxies can survive pericentric passage with some of their H I reservoir intact if they are massive enough (M* ≳ 109.5 M⊙; Cortese et al. 2021). Vollmer (2009) describe a stripping model in Virgo in which galaxies can still have an H I reservoir 200 Myr after experiencing peak ram pressure. It may also be that the bulk motion of the galaxy group substructure IGM through the cluster can protect the galaxies from the harshest effects of RPS, resulting in higher H I masses after their pericenter passage. If LEDA 753342 sits in the leeside of the infalling group, that may explain why it does not show signs of RPS.
In the absence of detailed modeling (see Conclusions), we also consider whether NGC 3312 and/or NGC 3314a could be on more tangential orbits with respect to the cluster to explain the orientation of their H I tails. Other instances of large H I tails suggesting tangential orbits have been seen: for example, NGC 4388 crossing in front of M86 in Virgo (Oosterloo & van Gorkom 2005). In the case of tangential orbits, most of the galaxies’ velocity would be in the plane of the sky. The estimated circular velocity would be  km s−1, where Mcluster ≡ M500 ∼ 0.9 × 10¹⁴ is the mass of the cluster within the approximate orbit of the galaxies (r500 ∼ 700 kpc; Zhao et al. 2013; Piffaretti et al. 2011), and r = 550−800 kpc is the cluster-centric distance (Fig. 8). This velocity is consistent with that estimated in Sect. 4.1, so that the possibility of the ram pressure morphologies in NGC 3312 and NGC 3314a being due to tangential motion is within our uncertainties. We note that jellyfish galaxies are estimated to have large impact parameters (> 400 kpc; McPartland et al. 2016), consistent with more tangential orbits, and consistent with the cluster-centric distances we have derived in Sect. 4.1.
Tidal interactions could also have an impact on the gas disks in clusters. McMahon et al. (1992) suggested that NGC 3312 and NGC 3314a may have interacted in the past as a result of their proximity in projection. At our assumed distance, the two galaxies have a projected separation of 128 kpc. In galaxies which are suspected to be experiencing tidal interactions, this may stir-up the disk and loosen the gas, making it easier for them to be stripped by ram pressure (Vollmer 2003; Chung et al. 2007; Sorgho et al. 2017). If their gas is more loosely bound, they may also be further way from the cluster center than has been inferred from purely the ram pressure criterion. We do not detect any signs from ongoing and/or recent interactions in the stellar bodies of these galaxies, based on both visual inspection and isophote analysis, at least down to our surface brightness limit of ∼27 mag arcsec−2 in the r-band or 26.5 mag arcsec−2 in g, in agreement with findings by Iodice et al. (2021). We especially caution that what appears to be tidal debris near the northern edge of NGC 3312 is an artifact of its disturbed spiral structure; a more close analysis of its isophotes reveals a smooth outer profile with no offset from the center of its inner disk, making tidal interactions with either NGC 3314 or any of its nearby (at least in projection) companions very unlikely. Furthermore, we also do not detect any tidal disturbances in its H I morphology. Nevertheless, it has also been shown in simulations that the bridge between interacting galaxies in a cluster environment can be destroyed by the ICM wind, while the ram pressure stripped tails remain (Kapferer et al. 2008). Thus, we cannot completely rule out the possibility of multiple environmental effects including tidal interactions.
We also consider the option that NGC 3312 and NGC 3314a belong to a large foreground group unassociated with Hydra, and that the ram pressure they are experiencing is not due to the cluster ICM but to a hot intragroup medium of the halo to which the galaxies would then belong. This could explain their significantly lower recessional velocity relative to the cluster systemic velocity if the redshift is dominated by Hubble flow rather than movement through the cluster potential well. Evidence to support this possibility includes the Tully–Fisher distance for NGC 3312 which suggests it should be at 53−55 Mpc (Theureau et al. 2007; Tully et al. 2016)5, 3−5 Mpc in front of Hydra. This possibility would imply the presence of an intragroup medium at the level of few ×10−4 cm−3 that is undetected in X-rays (Freeland & Wilcots 2011). It would make NGC 3312 and NGC 3314a the first example of massive galaxies exhibiting ram pressure in a group halo that is not also detected in X-rays. However, to our knowledge, the only non-dwarf, ram-pressure-stripped candidates identified so far have only been detected in groups with X-rays counterparts (Freeland et al. 2010; Murugeshan et al. 2021).
Finally, we return to the recent consideration of Iodice et al. (2021) as to whether or not UDG 32 could have formed as a result of ram pressure stripping in NGC 3314a. Unfortunately our data does not offer any confirmation of this scenario. UDG 32 is not detected in Hα within our narrowband observations, and it is not detected anywhere in our H I cube which spans recessional velocities of roughly 500−8100 km s−1. Most of the stellar material we detect is compact and bright in Hα. UDG 32 by comparison is more diffuse and somewhat redder. Nonetheless, Iodice et al. (2021) point out that it still has similar colors to regions in the stripped tail, and since UDG 32 is beyond the extent of the H I detected to date, we cannot rule out that it is made of stars formed out of stripped material for which the H I has dropped below currently detected levels. Deeper 32K H I observations with MeerKAT that are currently under investigation may shed greater light on this issue.
5. Conclusions
In this paper we have analyzed the H I morphologies and star forming properties of NGC 3312, NGC 3314a, NGC 3314b, and LEDA 753342, with a particular emphasis on the stripped material. We have presented the deepest and highest resolution H I imaging to date combined with very deep broad and narrow-band optical images of the core of the Hydra cluster to show conclusively that NGC 3312 and NGC 3314a are experiencing ram pressure stripping, which is removing H I and resulting in star formation in the stripped material of order 0.5 M⊙ yr−1. These galaxies have distinct H I and Hα tails extending a projected 30−40 kpc and 40−60 kpc from the disk. We also resolve NGC 3314b for the first time and show that it is in an advanced state of RPS, with no evidence for an H I (or star forming) tail. Finally, LEDA 753342, an unusual ring galaxy, may be just starting to feel the impact of the cluster environment.
The amount of material in the ram pressure stripped tails is dominated by the H I component, which makes up 8 to 35% (0.5−1 × 10⁹ M⊙) of the total detected gas mass in NGC 3312 and NGC 3314a, respectively. The estimated stellar material in the tails, from order of magnitude arguments, is of order 0.1−5 × 10⁸ M⊙ by comparison. We argue that this is consistent with estimated star formation efficiencies, as well as with a number of simulations.
We use the exceptional multiwavelength, spectroscopic, and kinematic data, with the serendipitous alignment of NGC 3314a and NGC 3314b to estimate the real distances from the cluster core of all galaxies obviously experiencing ram pressure. In particular, the favored scenario is that NGC 3312 and NGC 3314a are moving toward us – based on the drag seen in the H I tails – as part of a foreground substructure that has past its pericenter with a significant amount of the gas still intact. Given the strength of the ram pressure felt by NGC 3312 and NGC 3314a, the similar velocity of LEDA 753342 and its spatial proximity is likely a coincidence, rather than the three galaxies belonging to the same cluster substructure or being at the same distance. However, future X-ray observations, combined with simulations, are needed to say for certain whether bulk motions of substructure within the cluster could protect LEDA 753342 from the harshest effects of RPS. Finally, NGC 3314b is likely on a highly radial orbit and is in a significantly more advanced ram pressure state. Despite the relatively strong constraints we can place on the location of these galaxies, there are number of uncertainties in our calculations. We propose that future studies which combine higher spectral resolution observations of the galaxies already obtained with MeerKAT, and detailed hydrodynamic simulations may provide greater insight into the galaxy orbits and the physical conditions they are experiencing within the cluster.
The Hydra cluster has been studied before in H I with the Very Large Array (McMahon et al. 1992), and most recently with ASKAP as part of WALLABY Early Science (Wang et al. 2021; Reynolds et al. 2022). The results presented here show the game-changing capability of the MeerKAT telescope to H I studies in the nearby Universe, even at relatively low spectral resolution.
The high redshift cutoff for Kourkchi & Tully (2017) is 3500 km s−1 so this particular distance estimate for Hydra is strongly biased due to excluding more than half of the cluster in the calculation (Fig. 7).
These authors use a h = 0.57 and h = 0.75, respectively. We have scaled the distance to h = 0.7.
Acknowledgments
We thank the anonymous referee whose comments helped improve the quality of this paper. K.M.H. would like to thank Enrichetta Iodice, Paolo Serra, and William Keel for useful discussion, and Amidou Sorgho for the GBT beam comparison. We also thank Eric Peng and Thomas Puzia for their generous permission to use their N662 narrowband filter for our DECam observations. R.K. is also thankful to Kathy Vivas and the staff of CTIO for their help and support while preparing and executing the DECam observations, and for the LSST helpdesk staff for assistance while adapting the LSST pipeline for use with DECam data. K.M.H. acknowledges financial support from the State Agency for Research of the Spanish Ministry of Science, Innovation and Universities through the “Center of Excellence Severo Ochoa” awarded to the Instituto de Astrofísica de Andalucía (SEV-2017-0709) from the coordination of the participation in SKA-SPAIN, funded by the Ministry of Science and innovation (MICIN) and grant RTI2018-096228-B-C31 (MCIU/AEI/FEDER,UE). R.K. gratefully acknowledges partial funding support from the National Aeronautics and Space Administration under project 80NSSC18K1498, and from the National Science Foundation under grants No. 1852136 and 2150222. H.C. is supported by Key Research Project of Zhejiang Lab. (No. 2021PE0AC03); the South African Department of Science and Innovation and the National Research Foundation through SARChI’s South African SKA Fellowship within the SARAO Research Chair held by RC Kraan-Korteweg. J.S.G. thanks the University of Wisconsin College of Letters and Science for partial support of this work. The MeerKAT telescope is operated by the South African Radio Astronomy Observatory, which is a facility of the National Research Foundation, an agency of the Department of Science and Innovation. Part of the data published here have been reduced using the CARACal pipeline, partially supported by ERC Starting grant number 679629 “FORNAX”, MAECI Grant Number ZA18GR02, DST-NRF Grant Number 113121 as part of the ISARP Joint Research Scheme, and BMBF project 05A17PC2 for D-MeerKAT, and partially supported by the South African Research Chairs Initiative of the Department of Science and Technology and National Research Foundation. Information about CARACal can be obtained online under the URL: https://caracal.readthedocs.io/en/latest. This work made use of the CARTA (Cube Analysis and Rendering Tool for Astronomy) software (DOI: https://doi.org/10.5281/zenodo.3377984 – https://cartavis.github.io). We acknowledge the use of the Ilifu cloud computing facility – www.ilifu.ac.za, a partnership between the University of Cape Town, the University of the Western Cape, the University of Stellenbosch, Sol Plaatje University, the Cape Peninsula University of Technology and the South African Radio Astronomy Observatory. The Ilifu facility is supported by contributions from the Inter-University Institute for Data Intensive Astronomy (IDIA – a partnership between the University of Cape Town, the University of Pretoria, the University of the Western Cape and the South African Radio astronomy Observatory), the Computational Biology division at UCT and the Data Intensive Research Initiative of South Africa (DIRISA).
References
- Abadi, M. G., Moore, B., & Bower, R. G. 1999, MNRAS, 308, 947 [Google Scholar]
- Abramson, A., & Kenney, J. D. P. 2014, AJ, 147, 63 [Google Scholar]
- Abramson, A., Kenney, J. D. P., Crowl, H. H., et al. 2011, AJ, 141, 164 [Google Scholar]
- Abramson, A., Kenney, J., Crowl, H., & Tal, T. 2016, AJ, 152, 32 [Google Scholar]
- Arnaboldi, M., Ventimiglia, G., Iodice, E., Gerhard, O., & Coccato, L. 2012, A&A, 545, A37 [NASA ADS] [CrossRef] [EDP Sciences] [Google Scholar]
- Bahé, Y. M., McCarthy, I. G., Balogh, M. L., & Font, A. S. 2013, MNRAS, 430, 3017 [Google Scholar]
- Baier, F. W., & Oleak, H. 1983, Astron. Nachr., 304, 277 [NASA ADS] [CrossRef] [Google Scholar]
- Bakels, L., Ludlow, A. D., & Power, C. 2021, MNRAS, 501, 5948 [NASA ADS] [CrossRef] [Google Scholar]
- Bekki, K., & Couch, W. J. 2003, ApJ, 596, L13 [NASA ADS] [CrossRef] [Google Scholar]
- Bird, C. M. 1995, ApJ, 445, L81 [NASA ADS] [CrossRef] [Google Scholar]
- Biviano, A., & Katgert, P. 2004, A&A, 424, 779 [NASA ADS] [CrossRef] [EDP Sciences] [Google Scholar]
- Boselli, A., & Gavazzi, G. 2006, PASP, 118, 517 [Google Scholar]
- Boselli, A., Fossati, M., & Sun, M. 2022, A&ARv, 30, 3 [NASA ADS] [CrossRef] [Google Scholar]
- Bravo-Alfaro, H., Cayatte, V., van Gorkom, J. H., & Balkowski, C. 2000, AJ, 119, 580 [Google Scholar]
- Briel, U. G., Henry, J. P., & Boehringer, H. 1992, A&A, 259, L31 [NASA ADS] [Google Scholar]
- Brüggen, M., & De Lucia, G. 2008, MNRAS, 383, 1336 [Google Scholar]
- Calzetti, D., Armus, L., Bohlin, R. C., et al. 2000, ApJ, 533, 682 [NASA ADS] [CrossRef] [Google Scholar]
- Cavaliere, A., & Fusco-Femiano, R. 1976, A&A, 500, 95 [NASA ADS] [Google Scholar]
- Cavaliere, A., & Fusco-Femiano, R. 1978, A&A, 70, 677 [NASA ADS] [Google Scholar]
- Cayatte, V., Kotanyi, C., Balkowski, C., & van Gorkom, J. H. 1994, AJ, 107, 1003 [Google Scholar]
- Chemin, L., Cayatte, V., Balkowski, C., et al. 2005, A&A, 436, 469 [NASA ADS] [CrossRef] [EDP Sciences] [Google Scholar]
- Chen, H., Sun, M., Yagi, M., et al. 2020, MNRAS, 496, 4654 [CrossRef] [Google Scholar]
- Chung, A., van Gorkom, J. H., Kenney, J. D. P., & Vollmer, B. 2007, ApJ, 659, L115 [Google Scholar]
- Chung, A., van Gorkom, J. H., Kenney, J. D. P., Crowl, H., & Vollmer, B. 2009, AJ, 138, 1741 [Google Scholar]
- Cluver, M. E., Jarrett, T. H., Hopkins, A. M., et al. 2014, ApJ, 782, 90 [Google Scholar]
- Cluver, M. E., Jarrett, T. H., Dale, D. A., et al. 2017, ApJ, 850, 68 [Google Scholar]
- Colless, M., & Dunn, A. M. 1996, ApJ, 458, 435 [Google Scholar]
- Condon, J. J., Cotton, W. D., Greisen, E. W., et al. 1998, AJ, 115, 1693 [Google Scholar]
- Cortese, L., Davies, J. I., Pohlen, M., et al. 2010, A&A, 518, L49 [NASA ADS] [CrossRef] [EDP Sciences] [Google Scholar]
- Cortese, L., Catinella, B., & Smith, R. 2021, PASA, 38, e035 [NASA ADS] [CrossRef] [Google Scholar]
- Courtois, H. M., Tully, R. B., Fisher, J. R., et al. 2009, AJ, 138, 1938 [Google Scholar]
- Cowie, L. L., & Songaila, A. 1977, Nature, 266, 501 [Google Scholar]
- Crowl, H. H., Kenney, J. D. P., van Gorkom, J. H., & Vollmer, B. 2005, AJ, 130, 65 [Google Scholar]
- Dressler, A., & Shectman, S. A. 1988, AJ, 95, 985 [Google Scholar]
- Duc, P. A., Papaderos, P., Balkowski, C., et al. 1999, A&AS, 136, 539 [NASA ADS] [CrossRef] [EDP Sciences] [Google Scholar]
- Ebeling, H., Stephenson, L. N., & Edge, A. C. 2014, ApJ, 781, L40 [Google Scholar]
- Eckert, D., Molendi, S., & Paltani, S. 2011, A&A, 526, A79 [NASA ADS] [CrossRef] [EDP Sciences] [Google Scholar]
- Ettori, S., Pratt, G. W., de Plaa, J., et al. 2013, arXiv e-prints [arXiv:1306.2322] [Google Scholar]
- Evans, N. J., II, Dunham, M. M., Jørgensen, J. K., et al. 2009, ApJS, 181, 321 [Google Scholar]
- Fakhouri, O., Ma, C.-P., & Boylan-Kolchin, M. 2010, MNRAS, 406, 2267 [Google Scholar]
- Fazio, G. G., Hora, J. L., Allen, L. E., et al. 2004, ApJS, 154, 10 [Google Scholar]
- Ferrari, C., Arnaud, M., Ettori, S., Maurogordato, S., & Rho, J. 2006, A&A, 446, 417 [NASA ADS] [CrossRef] [EDP Sciences] [Google Scholar]
- Fitchett, M., & Merritt, D. 1988, ApJ, 335, 18 [NASA ADS] [CrossRef] [Google Scholar]
- Flaugher, B., Diehl, H. T., Honscheid, K., et al. 2015, AJ, 150, 150 [Google Scholar]
- Flores, R. A., Quintana, H., & Way, M. J. 2000, ApJ, 532, 206 [NASA ADS] [CrossRef] [Google Scholar]
- Freeland, E., & Wilcots, E. 2011, ApJ, 738, 145 [NASA ADS] [CrossRef] [Google Scholar]
- Freeland, E., Sengupta, C., & Croston, J. H. 2010, MNRAS, 409, 1518 [NASA ADS] [CrossRef] [Google Scholar]
- Fumagalli, M., Fossati, M., Hau, G. K. T., et al. 2014, MNRAS, 445, 4335 [Google Scholar]
- Gallagher, J. S. 1978, ApJ, 223, 386 [NASA ADS] [CrossRef] [Google Scholar]
- Gavazzi, G., Contursi, A., Carrasco, L., et al. 1995, A&A, 304, 325 [NASA ADS] [Google Scholar]
- Ghigna, S., Moore, B., Governato, F., et al. 1998, MNRAS, 300, 146 [NASA ADS] [CrossRef] [Google Scholar]
- Giovanelli, R., & Haynes, M. P. 1985, ApJ, 292, 404 [CrossRef] [Google Scholar]
- Gunn, J. E., & Gott, J. R., III 1972, ApJ, 176, 1 [Google Scholar]
- Haan, S., & Braun, R. 2014, MNRAS, 443, 186 [Google Scholar]
- Hayakawa, A., Furusho, T., Yamasaki, N. Y., Ishida, M., & Ohashi, T. 2004, PASJ, 56, 743 [NASA ADS] [Google Scholar]
- Hayakawa, A., Hoshino, A., Ishida, M., et al. 2006, PASJ, 58, 695 [NASA ADS] [Google Scholar]
- Haynes, M. P., & Giovanelli, R. 1986, ApJ, 306, 466 [Google Scholar]
- Healy, J., Blyth, S. L., Verheijen, M. A. W., et al. 2021, A&A, 650, A76 [NASA ADS] [CrossRef] [EDP Sciences] [Google Scholar]
- Hess, K. M., & Wilcots, E. M. 2013, AJ, 146, 124 [Google Scholar]
- Hess, K. M., Jarrett, T. H., Carignan, C., Passmoor, S. S., & Goedhart, S. 2015, MNRAS, 452, 1617 [Google Scholar]
- Ho, L. C., Li, Z.-Y., Barth, A. J., Seigar, M. S., & Peng, C. Y. 2011, ApJS, 197, 21 [Google Scholar]
- Hou, A., Parker, L. C., Wilman, D. J., et al. 2012, MNRAS, 421, 3594 [Google Scholar]
- Iodice, E., La Marca, A., Hilker, M., et al. 2021, A&A, 652, L11 [NASA ADS] [CrossRef] [EDP Sciences] [Google Scholar]
- Jáchym, P., Köppen, J., Palouš, J., & Combes, F. 2009, A&A, 500, 693 [NASA ADS] [CrossRef] [EDP Sciences] [Google Scholar]
- Jaffé, Y. L., Poggianti, B. M., Verheijen, M. A. W., Deshev, B. Z., & van Gorkom, J. H. 2013, MNRAS, 431, 2111 [Google Scholar]
- Jaffé, Y. L., Verheijen, M. A. W., Haines, C. P., et al. 2016, MNRAS, 461, 1202 [Google Scholar]
- Jarrett, T. H., Masci, F., Tsai, C. W., et al. 2013, AJ, 145, 6 [Google Scholar]
- Jarrett, T. H., Cluver, M. E., Brown, M. J. I., et al. 2019, ApJS, 245, 25 [Google Scholar]
- Jonas, J., & MeerKAT Team 2016, MeerKAT Science: On the Pathway to the SKA, 1 [Google Scholar]
- Jones, D. H., Read, M. A., Saunders, W., et al. 2009, MNRAS, 399, 683 [Google Scholar]
- Jones, M. G., Hess, K. M., Adams, E. A. K., & Verdes-Montenegro, L. 2020, MNRAS, 494, 2090 [NASA ADS] [CrossRef] [Google Scholar]
- Jorgensen, I., Franx, M., & Kjaergaard, P. 1996, MNRAS, 280, 167 [Google Scholar]
- Józsa, G. I. G., White, S. V., Thorat, K., et al. 2020a, ASP Conf. Ser., 527, 635 [Google Scholar]
- Józsa, G. I. G., White, S. V., Thorat, K., et al. 2020b, Astrophysics Source Code Library [record ascl:2006.014] [Google Scholar]
- Kapferer, W., Kronberger, T., Ferrari, C., Riser, T., & Schindler, S. 2008, MNRAS, 389, 1405 [NASA ADS] [CrossRef] [Google Scholar]
- Kapferer, W., Sluka, C., Schindler, S., Ferrari, C., & Ziegler, B. 2009, A&A, 499, 87 [NASA ADS] [CrossRef] [EDP Sciences] [Google Scholar]
- Keel, W. C., & White, R. E., III 2001, AJ, 122, 1369 [NASA ADS] [CrossRef] [Google Scholar]
- Kenney, J. D. P., & Koopmann, R. A. 1999, AJ, 117, 181 [NASA ADS] [CrossRef] [Google Scholar]
- Kenney, J. D. P., Young, J. S., Hasegawa, T., & Nakai, N. 1990, ApJ, 353, 460 [NASA ADS] [CrossRef] [Google Scholar]
- Kenney, J. D. P., van Gorkom, J. H., & Vollmer, B. 2004, AJ, 127, 3361 [Google Scholar]
- Kenney, J. D. P., Geha, M., Jáchym, P., et al. 2014, ApJ, 780, 119 [Google Scholar]
- Kenney, J. D. P., Abramson, A., & Bravo-Alfaro, H. 2015, AJ, 150, 59 [Google Scholar]
- Kleiner, D., Serra, P., Maccagni, F. M., et al. 2021, A&A, 648, A32 [NASA ADS] [CrossRef] [EDP Sciences] [Google Scholar]
- Koopmann, R. A., Haynes, M. P., & Catinella, B. 2006, AJ, 131, 716 [NASA ADS] [CrossRef] [Google Scholar]
- Köppen, J., Jáchym, P., Taylor, R., & Palouš, J. 2018, MNRAS, 479, 4367 [CrossRef] [Google Scholar]
- Koribalski, B. S., Staveley-Smith, L., Westmeier, T., et al. 2020, Ap&SS, 365, 118 [Google Scholar]
- Kotulla, R., Fritze, U., Weilbacher, P., & Anders, P. 2009, MNRAS, 396, 462 [NASA ADS] [CrossRef] [Google Scholar]
- Kourkchi, E., & Tully, R. B. 2017, ApJ, 843, 16 [NASA ADS] [CrossRef] [Google Scholar]
- Kronberger, T., Kapferer, W., Ferrari, C., Unterguggenberger, S., & Schindler, S. 2008, A&A, 481, 337 [NASA ADS] [CrossRef] [EDP Sciences] [Google Scholar]
- Kurtz, M. J., Huchra, J. P., Beers, T. C., et al. 1985, AJ, 90, 1665 [NASA ADS] [CrossRef] [Google Scholar]
- La Marca, A., Iodice, E., Cantiello, M., et al. 2022a, A&A, 665, A105 [NASA ADS] [CrossRef] [EDP Sciences] [Google Scholar]
- La Marca, A., Peletier, R., Iodice, E., et al. 2022b, A&A, 659, A92 [NASA ADS] [CrossRef] [EDP Sciences] [Google Scholar]
- Larson, R. B., Tinsley, B. M., & Caldwell, C. N. 1980, ApJ, 237, 692 [Google Scholar]
- Lee, J., Kimm, T., Katz, H., et al. 2020, ApJ, 905, 31 [NASA ADS] [CrossRef] [Google Scholar]
- Lima-Dias, C., Monachesi, A., Torres-Flores, S., et al. 2021, MNRAS, 500, 1323 [Google Scholar]
- Longobardi, A., Boselli, A., Fossati, M., et al. 2020, A&A, 644, A161 [EDP Sciences] [Google Scholar]
- Loni, A., Serra, P., Kleiner, D., et al. 2021, A&A, 648, A31 [NASA ADS] [CrossRef] [EDP Sciences] [Google Scholar]
- Mainzer, A., Bauer, J., Grav, T., et al. 2011, ApJ, 731, 53 [Google Scholar]
- Mamon, G. A., Cava, A., Biviano, A., et al. 2019, A&A, 631, A131 [NASA ADS] [CrossRef] [EDP Sciences] [Google Scholar]
- Mann, A. W., & Ebeling, H. 2012, MNRAS, 420, 2120 [NASA ADS] [CrossRef] [Google Scholar]
- Martin, D. C., Fanson, J., Schiminovich, D., et al. 2005, ApJ, 619, L1 [Google Scholar]
- Martinsson, T. P. K., Verheijen, M. A. W., Westfall, K. B., et al. 2013, A&A, 557, A131 [NASA ADS] [CrossRef] [EDP Sciences] [Google Scholar]
- Masters, K. L., Nichol, R., Bamford, S., et al. 2010, MNRAS, 404, 792 [NASA ADS] [CrossRef] [Google Scholar]
- McGaugh, S. S., & Schombert, J. M. 2014, AJ, 148, 77 [Google Scholar]
- McGee, S. L., Balogh, M. L., Bower, R. G., Font, A. S., & McCarthy, I. G. 2009, MNRAS, 400, 937 [Google Scholar]
- McIntosh, D. H., Rix, H.-W., & Caldwell, N. 2004, ApJ, 610, 161 [NASA ADS] [CrossRef] [Google Scholar]
- McLachlan, G. J., & Basford, K. E. 1988, Mixture Models. Inference and Applications to Clustering (Statistics: Textbooks and Monographs) [Google Scholar]
- McMahon, P. M., van Gorkom, J. H., Richter, O. G., & Ferguson, H. C. 1992, AJ, 103, 399 [Google Scholar]
- McPartland, C., Ebeling, H., Roediger, E., & Blumenthal, K. 2016, MNRAS, 455, 2994 [Google Scholar]
- Molnár, D. C., Serra, P., van der Hulst, T., et al. 2022, A&A, 659, A94 [NASA ADS] [CrossRef] [EDP Sciences] [Google Scholar]
- Moore, B., Katz, N., Lake, G., Dressler, A., & Oemler, A. 1996, Nature, 379, 613 [Google Scholar]
- Moore, B., Lake, G., & Katz, N. 1998, ApJ, 495, 139 [Google Scholar]
- Moran, S. M., Ellis, R. S., Treu, T., et al. 2007, ApJ, 671, 1503 [Google Scholar]
- Morrissey, P., Conrow, T., Barlow, T. A., et al. 2007, ApJS, 173, 682 [Google Scholar]
- Murray, N. 2011, ApJ, 729, 133 [NASA ADS] [CrossRef] [Google Scholar]
- Murugeshan, C., Kilborn, V. A., For, B. Q., et al. 2021, MNRAS, 507, 2949 [NASA ADS] [CrossRef] [Google Scholar]
- Nulsen, P. E. J. 1982, MNRAS, 198, 1007 [Google Scholar]
- Offringa, A. R., de Bruyn, A. G., Biehl, M., et al. 2010, MNRAS, 405, 155 [NASA ADS] [Google Scholar]
- Oosterloo, T., & van Gorkom, J. 2005, A&A, 437, L19 [NASA ADS] [CrossRef] [EDP Sciences] [Google Scholar]
- Owers, M. S., Couch, W. J., Nulsen, P. E. J., & Randall, S. W. 2012, ApJ, 750, L23 [Google Scholar]
- Piffaretti, R., Arnaud, M., Pratt, G. W., Pointecouteau, E., & Melin, J. B. 2011, A&A, 534, A109 [NASA ADS] [CrossRef] [EDP Sciences] [Google Scholar]
- Poggianti, B. M., Fasano, G., Omizzolo, A., et al. 2016, AJ, 151, 78 [Google Scholar]
- Poggianti, B. M., Moretti, A., Gullieuszik, M., et al. 2017, ApJ, 844, 48 [Google Scholar]
- Poggianti, B. M., Gullieuszik, M., Tonnesen, S., et al. 2019, MNRAS, 482, 4466 [Google Scholar]
- Press, W. H., & Schechter, P. 1974, ApJ, 187, 425 [Google Scholar]
- Ramatsoku, M., Serra, P., Poggianti, B. M., et al. 2019, MNRAS, 487, 4580 [Google Scholar]
- Reynolds, T. N., Westmeier, T., Elagali, A., et al. 2021, MNRAS, 505, 1891 [NASA ADS] [CrossRef] [Google Scholar]
- Reynolds, T. N., Catinella, B., Cortese, L., et al. 2022, MNRAS, 510, 1716 [Google Scholar]
- Richter, O. G., & Huchtmeier, W. K. 1983, A&A, 125, 187 [NASA ADS] [Google Scholar]
- Richter, O. G., Materne, J., & Huchtmeier, W. K. 1982, A&A, 111, 193 [NASA ADS] [Google Scholar]
- Roberts, I. D., & Parker, L. C. 2020, MNRAS, 495, 554 [NASA ADS] [CrossRef] [Google Scholar]
- Roberts, I. D., van Weeren, R. J., McGee, S. L., et al. 2021, A&A, 650, A111 [NASA ADS] [CrossRef] [EDP Sciences] [Google Scholar]
- Roediger, E., & Brüggen, M. 2006, MNRAS, 369, 567 [NASA ADS] [CrossRef] [Google Scholar]
- Roediger, E., & Brüggen, M. 2008, MNRAS, 388, 465 [CrossRef] [Google Scholar]
- Roediger, E., & Hensler, G. 2005, A&A, 433, 875 [NASA ADS] [CrossRef] [EDP Sciences] [Google Scholar]
- Roediger, E., Brüggen, M., & Hoeft, M. 2006, MNRAS, 371, 609 [NASA ADS] [CrossRef] [Google Scholar]
- Roediger, E., Kraft, R. P., Nulsen, P. E. J., et al. 2015, ApJ, 806, 103 [NASA ADS] [CrossRef] [Google Scholar]
- Salpeter, E. E. 1955, ApJ, 121, 161 [Google Scholar]
- Sampaio, V. M., de Carvalho, R. R., Ferreras, I., et al. 2021, MNRAS, 503, 3065 [NASA ADS] [CrossRef] [Google Scholar]
- Sarazin, C. L. 1988, X-ray Emission from Clusters of Galaxies (Cambridge: Cambridge University Press) [Google Scholar]
- Schlafly, E. F., & Finkbeiner, D. P. 2011, ApJ, 737, 103 [Google Scholar]
- Schuecker, P., Böhringer, H., Reiprich, T. H., & Feretti, L. 2001, A&A, 378, 408 [NASA ADS] [CrossRef] [EDP Sciences] [Google Scholar]
- Schulz, S., & Struck, C. 2001, MNRAS, 328, 185 [NASA ADS] [CrossRef] [Google Scholar]
- Schweizer, F., & Thonnard, N. 1985, PASP, 97, 104 [NASA ADS] [CrossRef] [Google Scholar]
- Sheen, Y.-K., Smith, R., Jaffé, Y., et al. 2017, ApJ, 840, L7 [Google Scholar]
- Solanes, J. M., Manrique, A., García-Gómez, C., et al. 2001, ApJ, 548, 97 [Google Scholar]
- Sorgho, A., Hess, K., Carignan, C., & Oosterloo, T. A. 2017, MNRAS, 464, 530 [NASA ADS] [CrossRef] [Google Scholar]
- Stein, P. 1997, A&A, 317, 670 [NASA ADS] [Google Scholar]
- Sun, M., Jones, C., Forman, W., et al. 2006, ApJ, 637, L81 [Google Scholar]
- Sun, M., Donahue, M., & Voit, G. M. 2007, ApJ, 671, 190 [Google Scholar]
- Tamura, T., Makishima, K., Fukazawa, Y., Ikebe, Y., & Xu, H. 2000, ApJ, 535, 602 [NASA ADS] [CrossRef] [Google Scholar]
- Theureau, G., Hanski, M. O., Coudreau, N., Hallet, N., & Martin, J. M. 2007, A&A, 465, 71 [NASA ADS] [CrossRef] [EDP Sciences] [Google Scholar]
- Tonnesen, S. 2019, ApJ, 874, 161 [Google Scholar]
- Tonnesen, S., & Bryan, G. L. 2009, ApJ, 694, 789 [NASA ADS] [CrossRef] [Google Scholar]
- Tully, R. B. 2015, AJ, 149, 171 [NASA ADS] [CrossRef] [Google Scholar]
- Tully, R. B., Courtois, H. M., & Sorce, J. G. 2016, AJ, 152, 50 [Google Scholar]
- Valluri, M. 1993, ApJ, 408, 57 [NASA ADS] [CrossRef] [Google Scholar]
- Ventimiglia, G., Arnaboldi, M., & Gerhard, O. 2011, A&A, 528, A24 [NASA ADS] [CrossRef] [EDP Sciences] [Google Scholar]
- Vijayaraghavan, R., & Ricker, P. M. 2013, MNRAS, 435, 2713 [NASA ADS] [CrossRef] [Google Scholar]
- Voges, W., Aschenbach, B., Boller, T., et al. 1999, A&A, 349, 389 [NASA ADS] [Google Scholar]
- Vollmer, B. 2003, A&A, 398, 525 [NASA ADS] [CrossRef] [EDP Sciences] [Google Scholar]
- Vollmer, B. 2009, A&A, 502, 427 [NASA ADS] [CrossRef] [EDP Sciences] [Google Scholar]
- Vollmer, B., Braine, J., Balkowski, C., Cayatte, V., & Duschl, W. J. 2001a, A&A, 374, 824 [NASA ADS] [CrossRef] [EDP Sciences] [Google Scholar]
- Vollmer, B., Cayatte, V., Balkowski, C., & Duschl, W. J. 2001b, ApJ, 561, 708 [NASA ADS] [CrossRef] [Google Scholar]
- Vollmer, B., Braine, J., Pappalardo, C., & Hily-Blant, P. 2008a, A&A, 491, 455 [NASA ADS] [CrossRef] [EDP Sciences] [Google Scholar]
- Vollmer, B., Soida, M., Chung, A., et al. 2008b, A&A, 483, 89 [NASA ADS] [CrossRef] [EDP Sciences] [Google Scholar]
- Vollmer, B., Soida, M., Chung, A., et al. 2009, A&A, 496, 669 [NASA ADS] [CrossRef] [EDP Sciences] [Google Scholar]
- Vollmer, B., Wong, O. I., Braine, J., Chung, A., & Kenney, J. D. P. 2012, A&A, 543, A33 [NASA ADS] [CrossRef] [EDP Sciences] [Google Scholar]
- Wang, J., Staveley-Smith, L., Westmeier, T., et al. 2021, ApJ, 915, 70 [Google Scholar]
- Werner, M. W., Roellig, T. L., Low, F. J., et al. 2004, ApJS, 154, 1 [NASA ADS] [CrossRef] [Google Scholar]
- Westmeier, T., Kitaeff, S., Pallot, D., et al. 2021, MNRAS, 506, 3962 [NASA ADS] [CrossRef] [Google Scholar]
- Wirth, A., & Gallagher, J. S. 1980, ApJ, 242, 469 [NASA ADS] [CrossRef] [Google Scholar]
- Wright, E. L., Eisenhardt, P. R. M., Mainzer, A. K., et al. 2010, AJ, 140, 1868 [Google Scholar]
- Yamasaki, N. Y., Ohashi, T., & Furusho, T. 2002, ApJ, 578, 833 [NASA ADS] [CrossRef] [Google Scholar]
- Yoon, H., Chung, A., Smith, R., & Jaffé, Y. L. 2017, ApJ, 838, 81 [Google Scholar]
- Yuan, H. B., Liu, X. W., & Xiang, M. S. 2013, MNRAS, 430, 2188 [NASA ADS] [CrossRef] [Google Scholar]
- Yun, K., Pillepich, A., Zinger, E., et al. 2019, MNRAS, 483, 1042 [Google Scholar]
- Zhang, Y.-Y., Reiprich, T. H., Finoguenov, A., Hudson, D. S., & Sarazin, C. L. 2009, ApJ, 699, 1178 [NASA ADS] [CrossRef] [Google Scholar]
- Zhao, H.-H., Jia, S.-M., Chen, Y., et al. 2013, ApJ, 778, 124 [NASA ADS] [CrossRef] [Google Scholar]
Appendix A: HI mass check
Anecdotally, a number of observers have come across mismatched continuum or H I fluxes from MeerKAT as compared to other instruments. A rigorous discussion of our H I fluxes will be presented in a future paper on the full Hydra cluster mosaic. Here we provide a simple comparison between our H I fluxes and those found in the literature.
First, we scale the H I detected by McMahon et al. (1992) with the VLA from their assumed distance of 45 Mpc to 58.6 Mpc. After this, we find that we report 50% more gas in NGC 3312, 18% more gas in NGC 3314a, and 12% less gas in LEDA 753342. This is a wide range of values, so the difference cannot be a simple a flux offset between the reduced data. The VLA data includes the most compact array configurations, whose shortest baselines cover the largest scales of these galaxies so we also do not expect much gas to be ‘resolved out’. We expect some of the difference (∼10 to 20%) between our H I mass measurements of NGC 3312 and NGC 3314a simply comes from our deeper observations detecting H I in the ram pressure stripped tails that were not seen before. Considering LEDA 753342, the VLA observations have a resolution of order the size of the galaxy, therefore is it possible the galaxy is sitting on a positive noise peak which would bias the mass to a higher value. On the other hand, LEDA 753342 is well resolved by the MeerKAT observations and thus will not be susceptible to the same bias in such a strong way.
We are also able to compare with single-dish Green Bank Telescope (GBT) observations of NGC 3312 and NGC 3314a reported in Courtois et al. (2009). Unfortunately the line profile of NGC 3314a (NED) seems to be impacted by either RFI or confusion with an absorbing source in the GBT beam which will result in underestimate its H I mass. Nonetheless, without any other considerations or flux corrections for the shape of the GBT beam, we only report 14% more gas in MeerKAT as compared to the GBT observations, which would suggest these observations may actually be in good agreement. For NGC 3312, the GBT spectrum looks free of confusing sources. In this case, we primary beam correct our MeerKAT image with the GBT beam and find that we still report 25% more gas.
If the flux calibration of our observations are high, the column densities at which we evaluate the ram pressure criterium are also high. This would mean that the galaxies may be more distant from the cluster than is implied in Figure 8. The absolute H I mass measurement does not effect our estimate for the relative fraction of H I in the stripped tails of NGC 3312 and NGC 3314a.
Appendix B: Stellar mass surface density
Here we present the Spitzer IRAC images converted to units of stellar mass surface density. We use these maps for two purposes: (1) to estimate the Σ* at which ram pressure is most impacting the disk, and (2) to estimate where the H I is considered as “stripped” (see Section 3.2).
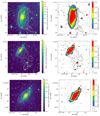 |
Fig. B.1. Spitzer IRAC images with H I contours of NGC 3312 (top), NGC 3314a (center), and NGC 3314b (bottom) in units of stellar mass surface density. The right image is the binned version of the left image (see Section 2.3). The gray lines indicate the direction of ram pressure as suggested by either how far the lowest H I contours penetrate into the stellar disk (dashed), or by the approximate orientation of the H I tail (dot-dashed). See Section 3.1, Figures 2, 3 for more details. |
All Tables
Summary of image resolution and photometric depth for the UV, optical, and near-IR datasets.
Star formation rates for the stripped material and total star formation rates over the entire galaxy.
All Figures
|
Fig. 1. Three galaxies in the foreground group are detected in HI: the ring galaxy (top left), NGC 3312 (top right), NGC 3314a (center bottom). The contours show that NGC 3312 and NGC 3314a are moving across the front of the cluster. H I contours (gray lines) are plotted at (1.2, 2.4, 4.8, 9.6) × 1020 cm−2 which corresponds to (4, 8, 16, 32) times the rms in a single 44 km s−1 channel. H I contours for NGC 3314b are excluded for clarity (Fig. 2). This false color image has been made from a composite of all optical DECam data, including Hα. The small inset plot in the bottom right shows X-ray contours based on ROSAT All-Sky Survey data (Voges et al. 1999). The position of our three galaxies of interest is shown with the black stars. The blue box shows the size and location of the field presented in the large panel. In both panels north is up and east is left, parallel to the figure axes. |
| In the text | |
|
Fig. 2. H I morphology and kinematics of NGC 3314b. Left: DECam false color image with H I total intensity contours at (1.2, 2.4, 4.8, 9.6) × 1020 cm−2 which corresponds to (4, 8, 16, 32) times the rms in a single 44 km s−1 channel. North is up and east is left, parallel to the figure axes. MeerKAT beam is the ellipse in the top right. Top right: H I total intensity gray scale. Red dashed and orange dot-dashed lines indicate the direction of motion or wind through the ICM as implied by the steep H I contours and the H I tail, respectively. Purple arrow indicates direction to center of the Hydra cluster (NGC 3311). Middle right: H I intensity-weighted velocity map. Bottom: integrated H I profile. NGC 3314b is at ∼4700 km s−1; the emission below ∼3000 km s−1 is H I associated with NGC 3314a in the foreground (see Fig. 3). |
| In the text | |
|
Fig. 3. H I morphology and kinematics: top set of images is NGC 3312; bottom is NGC 3314a. Left: DECam false color with H I contours at (1.2, 2.4, 4.8, 9.6) × 1020 cm−2 which corresponds to (4, 8, 16, 32) times the rms in a single 44 km s−1 channel. North is up and east is left, parallel to the figure axes. MeerKAT beam is the ellipse in the top right. Top right: H I total intensity gray scale. Red dashed and orange dot-dashed lines indicate the direction of motion or wind through the ICM as implied by the steep H I contours and the H I tail, respectively. Purple arrow indicates direction to center of the Hydra cluster. Middle right: H I intensity-weighted velocity map. Bottom: integrated H I profile. The ultra diffuse galaxy, UDG 32, recently reported by Iodice et al. (2021) is visible to the lower right of NGC 3314a, outside the H I contours. |
| In the text | |
|
Fig. 4. H I morphology and kinematics of LEDA 753342. Left: DECam false color image with H I total intensity contours at (1.2, 2.4, 4.8, 9.6) × 1020 cm−2 which corresponds to (4, 8, 16, 32) times the rms in a single 44 km s−1 channel. North is up and east is left, parallel to the figure axes. MeerKAT beam is the ellipse in the top right. Top right: H I total intensity gray scale. Middle right: H I intensity-weighted velocity map. Bottom: integrated H I profile. |
| In the text | |
|
Fig. 5. Results from the spatially resolved SED fitting for NGC 3312. Left panel: stellar mass surface density. Middle panel: observed g − i color index. Right panel: inferred internal dust reddening E(B − V). Not shown are the stellar population age map, showing consistently old ages throughout the entire face of the galaxy, with the exception of several very young regions coinciding with sites of active star formation where the youngest stellar population outshines the underlying, older generations. |
| In the text | |
|
Fig. 6. Color-composite images combining observations in GALEX near-UV (blue channel), DECam r-band (green channel), and continuum subtracted Hα (red channel) of NGC 3312 (top panel) and NGC 3314 (bottom panel). Each panel also shows the regions used to estimate the current star formation rate in the stripped material. The tail region of NGC 3312 is contaminated by several foreground stars; these have been excluded (see crossed-out patches for masked areas) before integrating the total Hα luminosity of the region. |
| In the text | |
|
Fig. 7. Hydra cluster galaxy velocities from 6dFGS (Jones et al. 2009). Blue histogram includes all galaxies within ∼3° (∼2 rvir) of the cluster center. Orange histogram includes galaxies within 40″ of the cluster center. NGC 3311 is the nominal cluster center. NGC 3312, NGC 3314a, and LEDA 753342 appear to belong to substructure at lower systemic velocity along the line of sight. NGC 3314b is substantially redshifted with respect to the cluster center. |
| In the text | |
|
Fig. 8. Beta models of the Hydra cluster intracluster medium versus estimates of ram pressure experienced by each galaxy. The lines provide the best estimate for each galaxy. The shaded areas show an estimated uncertainty for the contributions of dark matter, the wind angle, velocity through the ICM, and errors in stellar mass surface density. These uncertainties have been added in quadrature and are displayed as the vertical bars to the right of the plot. See text for details. |
| In the text | |
|
Fig. B.1. Spitzer IRAC images with H I contours of NGC 3312 (top), NGC 3314a (center), and NGC 3314b (bottom) in units of stellar mass surface density. The right image is the binned version of the left image (see Section 2.3). The gray lines indicate the direction of ram pressure as suggested by either how far the lowest H I contours penetrate into the stellar disk (dashed), or by the approximate orientation of the H I tail (dot-dashed). See Section 3.1, Figures 2, 3 for more details. |
| In the text | |
Current usage metrics show cumulative count of Article Views (full-text article views including HTML views, PDF and ePub downloads, according to the available data) and Abstracts Views on Vision4Press platform.
Data correspond to usage on the plateform after 2015. The current usage metrics is available 48-96 hours after online publication and is updated daily on week days.
Initial download of the metrics may take a while.