


Fig. 7
Download original image
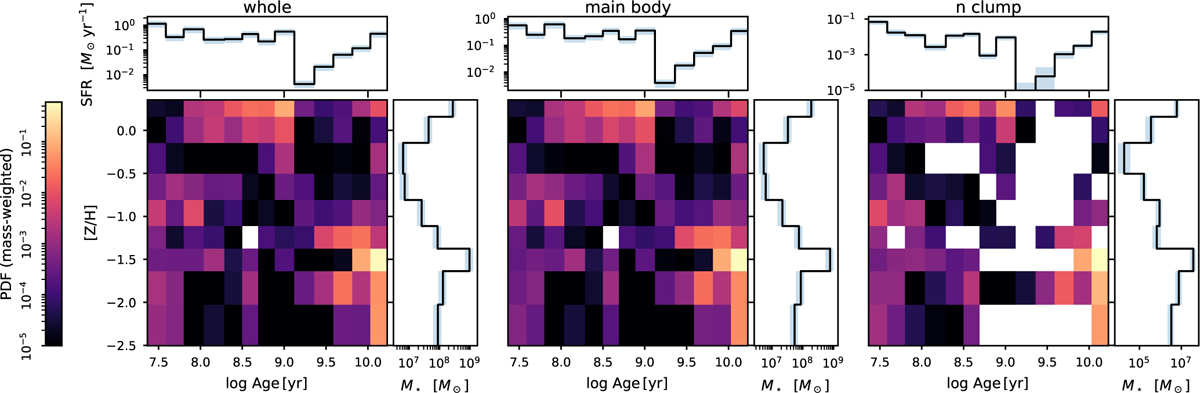
Region-integrated stellar age–metallicity distributions and their 1D projections. Each column corresponds to a spatial region (whole galaxy, main body, northern clump). The heatmap shows PDFreg on the native SSP (log t,[Z/H]) grid, defined as the region-summed PPXF template masses normalized to unity (i.e., the fraction of the region’s present-day stellar mass assigned to each template; Appendix B.2). Top panels: star-formation histories derived by converting the mass-weighted distribution to formed mass using the SSP living-mass fraction, marginalizing over metallicity and dividing by the linear time-bin width to yield SFR(t). Side panels: metallicity distribution functions obtained by marginalizing over age and scaling by the region’s present-day stellar mass.
Current usage metrics show cumulative count of Article Views (full-text article views including HTML views, PDF and ePub downloads, according to the available data) and Abstracts Views on Vision4Press platform.
Data correspond to usage on the plateform after 2015. The current usage metrics is available 48-96 hours after online publication and is updated daily on week days.
Initial download of the metrics may take a while.