


| Issue |
A&A
Volume 711, July 2026
|
|
|---|---|---|
| Article Number | L7 | |
| Number of page(s) | 8 | |
| Section | Letters to the Editor | |
| DOI | https://doi.org/10.1051/0004-6361/202660796 | |
| Published online | 16 July 2026 | |
Letter to the Editor
Probing outflow physics through CH3CN and CH3OH chemistry
1
INAF, Osservatorio Astrofisico di Arcetri, Largo E. Fermi 5, 50125 Firenze, Italy
2
Department of Physics and Astronomy, University of Victoria, PO Box 3055, STN CSC, Victoria, BC V8W 3P6, Canada
3
European Southern Observatory, Karl-Schwarzschild-Strasse 2, D-85748 Garching bei München, Germany
4
Leiden Observatory, Leiden University, PO Box 9513, 2300 RA, Leiden, The Netherlands
5
Max-Planck-Institut für Astronomie (MPIA), Königstuhl 17, 69117 Heidelberg, Germany
★ Corresponding author: This email address is being protected from spambots. You need JavaScript enabled to view it.
Received:
5
May
2026
Accepted:
23
June
2026
Abstract
Chemical correlations between molecules provide powerful diagnostics to probe the physical conditions of protostellar outflows. In particular, the relationship between methanol (CH3OH) and methyl cyanide (CH3CN) offers a promising tool to investigate the chemistry and irradiation environment of shocked gas. In this Letter, we use the CH3OH/CH3CN abundance ratio to constrain the physical properties of the outflow driven by the Class 0 protostar S68N using ALMA Band 3 and Band 6 observations. Assuming local thermodynamic equilibrium (LTE), we derived excitation temperatures of 50–60 K and column densities of 2–3 × 1013 cm−2 for CH3CN and 3–5 × 1015 cm−2 for CH3OH. The resulting CH3OH/CH3CN abundance ratio is nearly constant along the outflow, with values of ∼100–200, similar to those found in other protostellar environments. Using an up-to-date astrochemical model, we tested whether the gas-phase formation of CH3CN can account for the observed ratios. We found that they could only be reproduced under the assumption of enhanced cosmic-ray ionisation rates: ζCR up to ∼10−14 s−1. These results suggest that the CH3OH–CH3CN correlation can be used as a probe of the irradiation conditions in protostellar outflows. Further studies are required to explore the contribution of grain-surface formation of CH3CN that could lead to a lower ζCR, and to analyse a larger sample of sources.
Key words: astrochemistry / ISM: jets and outflows / ISM: molecules
© The Authors 2026
 Open Access article, published by EDP Sciences, under the terms of the Creative Commons Attribution License (https://creativecommons.org/licenses/by/4.0), which permits unrestricted use, distribution, and reproduction in any medium, provided the original work is properly cited.
This article is published in open access under the Subscribe to Open model. This email address is being protected from spambots. You need JavaScript enabled to view it. to support open access publication.
1. Introduction
Understanding the chemical composition of star- and planet-forming regions is essential to reconstructing the early stages stellar evolution and planetary system formation (Ceccarelli et al. 2023). Young protostars undergo intense accretion and mass ejection, launching collimated jets and outflows whose shocks release molecules from dust-grain mantles, enriching the surrounding gas (Bachiller 1996). These outflows provide ideal laboratories for investigating the interplay between physical processes and chemistry (Codella et al. 2017; De Simone et al. 2020). Observations of hot cores, hot corinos, and outer envelopes have revealed a correlation between methyl cyanide (CH3CN) and methanol (CH3OH), with a typical CH3OH/CH3CN ratio of ∼100 (Bergner et al. 2017; Belloche et al. 2020; Yang et al. 2021; Chahine et al. 2022; Nazari et al. 2022; van’t Hoff et al. 2024). Since CH3OH forms exclusively on dust grains (Watanabe & Kouchi 2002; Rimola et al. 2014), this correlation suggested a shared grain-surface origin. However, chemical models adopting revised reaction networks (Giani et al. 2023) have shown that CH3CN can also form in the gas phase: in hot corinos, thermally released methanol is destroyed by H3+, producing CH3+, a key precursor for CH3CN. In outflows, methanol is injected into the gas phase via sputtering (Flower et al. 2010), potentially linking its abundance to CH3CN. Interferometric surveys of both species are currently limited to the OMC2-FIR6c-a and L1157-B1 outflows (Benedettini et al. 2007; Codella et al. 2009; Bouvier et al. 2025). For FIR6c-a (Bouvier et al. 2025), the observed ratios (24–1000) require enhanced cosmic-ray ionisation rates (ζCR ∼ 10−14 s−1), consistent with a strongly irradiated environment (Ceccarelli et al. 2014; Fontani et al. 2017; Favre et al. 2018; Sabatini et al. 2023; Redaelli et al. 2025). However, the scarcity of sources and uncertainties prevent a robust assessment of whether the CH3OH–CH3CN link observed in hot corinos holds in shocks and if it can reliably constrain outflow physics.
In this Letter, we investigate the CH3OH/CH3CN ratio in the outflow of the Class 0 protostar S68N (d = 445 pc; Ortiz-León et al. 2017; Herczeg et al. 2019; Zucker et al. 2019, 2020), which is traced by several iCOMs (Tychoniec et al. 2019; Podio et al. 2021; Tychoniec & van Dishoeck 2021). Leveraging high-resolution ALMA observations and astrochemical modelling, we exploited the CH3OH/CH3CN ratio to constrain the physical and irradiation conditions along the S68N outflows.
2. Observations
We report ALMA observations (2017.1.1174.S; PI: E.F. van Dishoeck) of the S68N outflows, detailed in Tychoniec et al. (2019), Tychoniec & van Dishoeck (2021), van Gelder et al. (2020). We present observations of CH3OH 2−1, 1 − 10, 1 in band 6 and CH3CN 60 − 50, 61 − 51, 62 − 52 and 63 − 53 in band 3 (Table 1). We used the self-calibrated data to create primary-beam-corrected images, with synthesised beams of ∼3″ (∼1300 au) and ∼0.5″ (∼220 au), spectral resolution of ∼0.06 MHz (0.21 km s−1) and 0.12 MHz (0.15 km s−1), fields of view of 63″ and 28″, and maximum recoverable scale (MRS) of 16″ and 6″ in band 3 and band 6, respectively. We estimated the methanol filtering-out correction to be ≤20% H2CO from archival data (2013.1.00726.S; PI: C. Hull) available in two configurations with MRS of 5″ and 12″, which display a similar morphology to the CH3OH emission (Tychoniec & van Dishoeck 2021).
Spectroscopic parameters and line fit results over the whole emission (high + low components) of CH3CN and CH3OH.
3. Morphology and spectral analysis
Figure 1 displays the dust continuum emission of S68N overlaid with CH3CN and CH3OH emission in the outflow. The redshifted emission is integrated between +5 and +20 km s−1, while the blueshifted emission between –2 and 11 km s−1. The systemic velocity is +8.5 km s−1 (Lee et al. 2014). CH3CN and CH3OH exhibit a similar spatial distribution, with methanol being slightly more compact than methyl cyanide due to the lower spatial resolution. The line profiles are nearly identical, with no evidence of distinct velocity components between the two species (Fig. A.1), indicating that CH3CN and CH3OH are tracing the same gas.
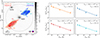 |
Fig. 1. S68N outflows and its analysis. Left panel: 2.7 mm continuum (greyscale) with overlaid redshifted and blueshifted emission of CH3CN 62 − 52 (salmon/cyan shaded contours) and CH3OH 2−1, 1 − 10, 1 (red and blue contours). Contours start at 2σ in steps of 1σ (σ = 60 and 50 mJy beam−1 km s−1 for CH3CN and CH3OH, respectively). Black circles label the analysed regions (R1, R2, B1, B2); stars mark protostellar positions. The dashed circle indicates the CH3OH primary beam and synthesised beams are shown at the bottom-right. Right panel: CH3CN rotation diagrams in the four labelled regions. Colour coding is the same as in the left panel. Derived column densities and rotational temperatures are reported. |
To analyse variations along the outflow, we extracted the spectra in four selected regions with a size of 2 3 and centred on the CH3CN emission peaks (Fig. 1). All lines exhibit asymmetric profiles, consisting of a main component close to the systemic velocity (∼6–9 km s−1) and a secondary component shifted up to ±7 km s−1 (Fig. A.1). Therefore, we adopted a multi-component Gaussian fitting procedure to derive the total line emission. In all regions, two of the CH3CN transitions (60 − 50 and 61 − 51) are blended. In these cases, we used the line widths and velocities derived from the two unblended transitions to constrain the fit and separate the contributions of the blended lines (Fig. 2). The fits of all lines are shown in Fig. A.2. The integrated intensities of the whole emission are reported in Table 1, while those of the low- and high-velocity components separated are reported in Table A.1. The column densities were derived assuming local thermodynamic equilibrium (LTE) and optically thin emission, following the formalism described in Mangum & Shirley (2015). Figure 1 shows the rotation diagram (RD) obtained for CH3CN. The temperatures derived from CH3CN were then used to estimate the CH3OH column densities, corrected for the filtering-out (see Sect. 2). The resulting temperatures and column densities are reported in Table 1. We also performed the RD analysis separately for the low- and high-velocity components (Table A.1) to verify the presence of significant variations in temperature and CH3OH/CH3CN ratios among the two components. No significant variations were found within the uncertainties; therefore, we adopted the temperatures and column densities from the total emission, which offers a higher S/N and more robust estimates. To verify the LTE conditions, we calculated the critical densities of the detected lines for CH3CN and CH3OH using the Einstein and collisional coefficients reported by Ben Khalifa et al. (2023), Rabli & Flower (2010) and the LAMDA database. We found ncrit ∼1-2 × 106 cm−3 for CH3CN and ncrit ∼7× 107 cm−3 for CH3OH at 50–60 K. To assess the validity of the LTE assumption, we performed a non-LTE analysis of CH3CN using a large velocity gradient (LVG) approach (see Appendix B for details). The results are fully consistent with those obtained from the rotational diagram analysis and indicate that the LTE approximation is appropriate: the derived gas densities are higher than ≳107, and all CH3CN transitions are optically thin. In contrast, an LVG analysis of methanol was not feasible because only a single transition was detected. Under the assumption that CH3CN and CH3OH trace the same gas component, the density derived from CH3CN is comparable to or higher than the critical density of methanol, suggesting that LTE conditions for CH3OH are at least marginally satisfied. Furthermore, at the LTE column density derived for methanol, the optical depth remains below unity.
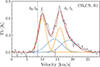 |
Fig. 2. Spectral fits of CH3CN 60–50 and 61–51 in R1 (all regions in Fig. A.2) Orange and blue curves represent the main peaks (at vsys ± 1 km s−1) and the redshifted (+3–4 km s−1 from vsys) components, respectively. Red curves show the total fit. Dashed vertical line marks the systemic velocity, +8.5 km s−1 (Lee et al. 2014). Purple ticks indicate transition frequencies from Table 1. |
We derived LTE CH3CN column densities ranging from 1.8 to 3.5 × 1013 cm−2, with gas temperatures between 44 and 68 K. For CH3OH, we derived column densities between 3.1 and 5.3 × 1015 cm−2 assuming the same temperature range of CH3CN. The CH3OH/CH3CN ratios calculated in the four positions range between 117 and 247, showing no significant variation with the distance from the protostar (Table 1). The derived ratios are in agreement with values found for hot corinos in previous studies (∼100; Belloche et al. 2020; Yang et al. 2021; van’t Hoff et al. 2024). The analysis of other shocked regions (L1157-B1 and OMC2-FIR6c-a; Codella et al. 2009; Bouvier et al. 2025) are not well constrained with values between 24 and 1000. Despite being qualitatively in agreement, the comparison does not offer any useful constraints.
To estimate the abundances of the species with respect to H2, we used the CO 2–1 line (230.5328 GHz, Eup = 17 K) to derive the column density of CO and, thus, that of H2, assuming the standard CO/H2 ratio (∼2×10⁻⁴; Lacy et al. 1994). In all regions (see spectra in Fig. A.1), the emission is strongly self-absorbed at systemic velocity. At high velocities, the CO line profiles differ from those of CH3OH and CH3CN in all regions, except R2 (v > 12 km s−1), making it difficult to isolate CO emission tracing the same gas component. In R2, however, the profile similarity allows a more reliable comparison. Thus, assuming the same temperature as CH3CN and taking into account the possibility that CO emission could be optically thick, we derived an H2 column density of ≥5×1020 cm−2. Using the CH3OH column density from the high-velocity component (Table A.1), we obtained a methanol abundance of ≤4×10⁻⁶.
4. CH3OH/CH3CN as a potential probe of protostellar conditions
Protostellar outflows are time-dependent structures and the chemistry they host reflects their dynamical evolution. To identify the timescales relevant for our astrochemical modelling, we estimated the dynamical ages of the outflow regions. We adopted the inclination (70°–80° with respect to the line of sight) and inclination-corrected velocities (∼20–50 km s−1) derived from 12CO observations by Aso et al. 2019, consistent with previous studies indicating that the outflow lies close to the plane of the sky (Podio et al. 2021; Le Gouellec et al. 2025). We computed the dynamical timescales as 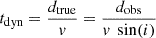 , where dobs is the projected distance on the plane of the sky, while i and v are the inclination angle and shock velocity, respectively. We obtained ages of 300–600 years for R2 and B1, and 500–1000 years for R1 and B2, referring to them in the following discussion.
To constrain the physical properties of the outflow, we modelled the CH3OH/CH3CN abundance ratio and compared it with the observed values in Table 1. We adopted a pure gas-phase post-shock astrochemical model in which CH3CN is formed in the gas phase through the reactions revised by Giani et al. (2023) and highlighted in Appendix C, while methanol is assumed to form on grain surfaces and injected into the gas phase following the passage of the shock. A detailed description of the model is reported in Appendix C. Figure 3 shows the evolution of the CH3OH/CH3CN ratio as a function of the injected methanol abundance for three different values of the cosmic-ray ionisation rate (ζCR) at different times after the shock passage (between 300 and 1000 yr). Given the uncertainties in the H2 abundance and, thus, in the methanol abundance (Sect. 3), we varied the CH3OH abundance between 10−8 and 7×10⁻⁶. The CH3OH/CH3CN ratio is highly sensitive to this parameter as CH3CN precursors can originate either from methanol itself or from other hydrocarbons (see Sect. C for details of the reactions). Since the gas density is not well constrained (nH2 > 107 cm−3, Le Gouellec et al. 2025 and Appendix B), we also explored models with different densities (from 106 to 108 cm−3). Within the explored parameter space, the observed CH3OH/CH3CN ratio at the age estimated for the outflow can be reproduced by this gas-phase model only by assuming enhanced values of ζCR, up to 10−14 s−1. This result holds even for methanol abundances more than two orders of magnitude below the value derived in Sect. 3. High ζCR values have also been inferred in other protostellar environments, such as the outflow regions of OMC-FIR4 and FIR6 (Ceccarelli et al. 2014; Fontani et al. 2017; Favre et al. 2018; Bouvier et al. 2025). Although such high values are not yet fully reproduced by cosmic-ray acceleration models (Padovani et al. 2016), previous studies have shown that local particle acceleration can occur in jet-driven shocks, leading to cosmic-ray fluxes significantly higher than the canonical value of 10−17 s−1 (Drury 1983; Kirk 1994). Observational evidence suggests that the shock in S68N reaches velocities above 30 km s−1 and that the region close to the protostar is strongly magnetised (B≤100 mG) (Le Gouellec et al. 2025), making such high ζCR values plausible.
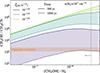 |
Fig. 3. Comparison of predicted and observed CH3OH/CH3CN abundance ratio versus CH3OH/H2 (see Fig. C.1 for other densities). Lines show model predictions at 300 (solid) and 1000 (dashed) yr after shock passage, with shaded areas representing intermediate times. Ratios are plotted for ζCR: 1 × 10⁻¹⁴ (green), 1 × 10⁻¹⁵ (cyan), and 1 × 10⁻¹⁶ (purple) s−1. The orange band show the observed ratio (see Table 1), while the vertical grey line marks the CH3OH abundance upper limit (Sect. 4). |
We note that the main assumption of our model is that CH3CN is primarily formed in the gas phase, with a negligible contribution from grain-surface chemistry. Reproducing the observed ratio with canonical ionisation rates would require an additional CH3CN reservoir that would be two to three orders of magnitude larger than that predicted by the gas-phase model. One possible explanation is that such a reservoir could arise from ice chemistry. Indeed, alternative formation pathways on dust grains have been proposed, such as the radical–radical reaction CH3 + CN (Hasegawa & Herbst 1993; Enrique-Romero & Lamberts 2025) or the hydrogenation of CCN (Garrod et al. 2022). To reproduce the observations through grain-surface chemistry alone, the abundance of CH3CN in the ice would need to be about a factor 100 lower than that of CH3OH, given the comparable sublimation temperatures of the two species (Kakkar et al. 2025). Ice-phase CH3CN remains poorly constrained observationally, with only a tentative detection reported by Nazari et al. (2024). If grain-surface formation of CH3CN were indeed shown to be efficient, the cosmic-ray ionisation rate inferred from our gas-phase model could be overestimated and the derived values would then be regarded as upper limits. A more robust assessment will require chemical models that explicitly include surface reactions, together with the most up-to-date reaction rate coefficients, particularly for CCN hydrogenation, which are currently being investigated (Enrique-Romero et al., in prep.).
In hot corinos, a ratio of CH3OH/CH3CN ∼100 can be reproduced by pure gas-phase chemistry on timescales of ∼104 yr without invoking enhanced cosmic-ray fields; however, this is not the case in protostellar outflows. The results of our model suggest that enhanced cosmic-ray ionisation rates are required to reproduce CH3OH/CH3CN ratios close to 100 at the typical ages of protostellar outflows (∼300–1000 yr) if only gas-phase chemistry is considered. At such short timescales, the CH3OH/CH3CN ratio is highly sensitive to variations in the physical conditions, making it a potentially powerful diagnostic of the environment in shocked gas. Further work is needed to test the robustness of this method as a probe of the physical conditions in protostellar outflows. First, dedicated models of cosmic-ray acceleration in shocks with the high densities and magnetic fields typical of these regions should be explored. Second, the statistics of CH3OH/CH3CN measurements in outflows should be expanded to determine whether the high cosmic-ray ionisation rates inferred here are common or if S68N represents a peculiar case.
In summary, the S68N outflow shows a CH3OH/CH3CN ratio of about 100–200, comparable with those found in hot corinos. We verified the efficiency of gas phase formation of CH3CN assuming that grain surface production is negligible. We found that an extremely high CR is needed to reproduce the ratio (ζCR ∼ 10−14 s−1). This shows how powerful the CH3OH/CH3CN correlation can serve as a probe of the irradiation conditions in protostellar outflows.
Acknowledgments
We thank the anonymous referee for their comments, which helped improve the manuscript. The authors thank Prof. C. Ceccarelli and Dr. J. Enrique-Romero for valuable discussions. LG acknowledges the ESO Scientific Visitor Programme for financial support. LG, ClCo, LP acknowledge the PRIN-MUR 2020 BEYOND-2p (2020AFB3FX), the project ASI-Astrobiologia 2023 MIGLIORA (F83C23000800005), the INAF-GO 2024 fundings ICES, the INAF-GO 2023 fundings PROTO-SKA (C13C23000770005). ADZ acknowledge the ESO summer research student program. This paper makes use of the following ALMA data: ADS/JAO.ALMA#2017.1.1174.S ALMA is a partnership of ESO (representing its member states), NSF (USA) and NINS (Japan), together with NRC (Canada), NSTC and ASIAA (Taiwan), and KASI (Republic of Korea), in cooperation with the Republic of Chile. The Joint ALMA Observatory is operated by ESO, AUI/NRAO and NAOJ.
References
- Aso, Y., Hirano, N., Aikawa, Y., et al. 2019, ApJ, 887, 209 [Google Scholar]
- Bachiller, R. 1996, ARA&A, 34, 111 [NASA ADS] [CrossRef] [Google Scholar]
- Balucani, N., Ceccarelli, C., & Taquet, V. 2015, MNRAS, 449, L16 [Google Scholar]
- Belloche, A., Maury, A. J., Maret, S., et al. 2020, A&A, 635, A198 [NASA ADS] [CrossRef] [EDP Sciences] [Google Scholar]
- Ben Khalifa, M., Dagdigian, P. J., & Loreau, J. 2023, MNRAS, 523, 2577 [NASA ADS] [CrossRef] [Google Scholar]
- Benedettini, M., Viti, S., Codella, C., et al. 2007, MNRAS, 381, 1127 [Google Scholar]
- Bergner, J. B., Öberg, K. I., Garrod, R. T., et al. 2017, ApJ, 841, 120 [Google Scholar]
- Blázquez, S., González, D., Neeman, E. M., et al. 2020, PCCP, 22, 20562 [Google Scholar]
- Bouvier, M., Giani, L., Chahine, L., et al. 2025, MNRAS, 539, 2380 [Google Scholar]
- Cazzoli, G., & Puzzarini, C. 2006, J. Mol. Spectrosc., 240, 153 [NASA ADS] [CrossRef] [Google Scholar]
- Ceccarelli, C., Baluteau, J.-P., Walmsley, M., et al. 2002, A&A, 383, 603 [NASA ADS] [CrossRef] [EDP Sciences] [Google Scholar]
- Ceccarelli, C., Maret, S., Tielens, A. G. G. M., et al. 2003, A&A, 410, 587 [NASA ADS] [CrossRef] [EDP Sciences] [Google Scholar]
- Ceccarelli, C., Dominik, C., López-Sepulcre, A., et al. 2014, ApJ, 790, L1 [Google Scholar]
- Ceccarelli, C., Codella, C., Balucani, N., et al. 2023, ASP Conf. Ser., 534, 379 [NASA ADS] [Google Scholar]
- Chahine, L., López-Sepulcre, A., Podio, L., et al. 2022, A&A, 667, A6 [NASA ADS] [CrossRef] [EDP Sciences] [Google Scholar]
- Codella, C., Benedettini, M., Beltrán, M. T., et al. 2009, A&A, 507, L25 [NASA ADS] [CrossRef] [EDP Sciences] [Google Scholar]
- Codella, C., Ceccarelli, C., Caselli, P., et al. 2017, A&A, 605, L3 [NASA ADS] [CrossRef] [EDP Sciences] [Google Scholar]
- De Simone, M., Codella, C., Ceccarelli, C., et al. 2020, A&A, 640, A75 [NASA ADS] [CrossRef] [EDP Sciences] [Google Scholar]
- Drury, L. O. 1983, Rep. Prog. Phys., 46, 973 [Google Scholar]
- Endres, C. P., Schlemmer, S., Schilke, P., et al. 2016, J. Mol. Spectrosc., 327, 95 [NASA ADS] [CrossRef] [Google Scholar]
- Enrique-Romero, J., & Lamberts, T. 2025, A&A, 699, A235 [NASA ADS] [CrossRef] [EDP Sciences] [Google Scholar]
- Favre, C., Ceccarelli, C., López-Sepulcre, A., et al. 2018, ApJ, 859, 136 [Google Scholar]
- Flower, D. R., Pineau des Forêts, G., & Rabli, D. 2010, MNRAS, 409, 29 [NASA ADS] [CrossRef] [Google Scholar]
- Fontani, F., Ceccarelli, C., Favre, C., et al. 2017, A&A, 605, A57 [NASA ADS] [CrossRef] [EDP Sciences] [Google Scholar]
- Garrod, R. T., Jin, M., Matis, K. A., et al. 2022, ApJS, 259, 1 [NASA ADS] [CrossRef] [Google Scholar]
- Giani, L., Ceccarelli, C., Mancini, L., et al. 2023, MNRAS, 526, 4535 [NASA ADS] [CrossRef] [Google Scholar]
- Giani, L., Bianchi, E., Fournier, M., et al. 2025, MNRAS, 537, 3861 [Google Scholar]
- Hasegawa, T. I., & Herbst, E. 1993, MNRAS, 263, 589 [Google Scholar]
- Herczeg, G. J., Kuhn, M. A., Zhou, X., et al. 2019, ApJ, 878, 111 [NASA ADS] [CrossRef] [Google Scholar]
- Jenkins, E. B. 2009, ApJ, 700, 1299 [Google Scholar]
- Kakkar, H., Martínez-Bachs, B., Ceccarelli, C., et al. 2025, ApJ, 993, 184 [Google Scholar]
- Kirk, J. G. 1994, in Saas-Fee Advanced Course 24: Plasma Astrophysics, 225 [Google Scholar]
- Lacy, J. H., Knacke, R., Geballe, T. R., & Tokunaga, A. T. 1994, ApJ, 428, L69 [CrossRef] [Google Scholar]
- Le Gouellec, V. J. M., Lew, B. W. P., Greene, T. P., et al. 2025, ApJ, 985, 225 [Google Scholar]
- Lee, K. I., Fernández-López, M., Storm, S., et al. 2014, ApJ, 797, 76 [Google Scholar]
- Loison, J.-C., Wakelam, V., Hickson, K. M., et al. 2014, MNRAS, 437, 930 [Google Scholar]
- Mangum, J. G., & Shirley, Y. L. 2015, PASP, 127, 266 [Google Scholar]
- Müller, H. S. P., Thorwirth, S., Roth, D. A., et al. 2001, A&A, 370, L49 [Google Scholar]
- Müller, H. S. P., Schlöder, F., Stutzki, J., et al. 2005, J. Mol. Struct., 742, 215 [CrossRef] [Google Scholar]
- Nazari, P., Meijerhof, J. D., van Gelder, M. L., et al. 2022, A&A, 668, A109 [NASA ADS] [CrossRef] [EDP Sciences] [Google Scholar]
- Nazari, P., Rocha, W. R. M., Rubinstein, A. E., et al. 2024, A&A, 686, A71 [NASA ADS] [CrossRef] [EDP Sciences] [Google Scholar]
- Ortiz-León, G. N., Dzib, S. A., Kounkel, M. A., et al. 2017, ApJ, 834, 143 [Google Scholar]
- Padovani, M., Marcowith, A., Hennebelle, P., et al. 2016, A&A, 590, A8 [NASA ADS] [CrossRef] [EDP Sciences] [Google Scholar]
- Podio, L., Lefloch, B., Ceccarelli, C., et al. 2014, A&A, 565, A64 [NASA ADS] [CrossRef] [EDP Sciences] [Google Scholar]
- Podio, L., Tabone, B., Codella, C., et al. 2021, A&A, 648, A45 [NASA ADS] [CrossRef] [EDP Sciences] [Google Scholar]
- Rabli, D., & Flower, D. R. 2010, MNRAS, 406, 95 [Google Scholar]
- Redaelli, E., Bovino, S., Sabatini, G., et al. 2025, A&A, 702, A210 [NASA ADS] [CrossRef] [EDP Sciences] [Google Scholar]
- Rimola, A., Taquet, V., Ugliengo, P., et al. 2014, A&A, 572, A70 [NASA ADS] [CrossRef] [EDP Sciences] [Google Scholar]
- Sabatini, G., Bovino, S., & Redaelli, E. 2023, ApJ, 947, L18 [NASA ADS] [CrossRef] [Google Scholar]
- Sastry, K., Lees, R., & De Lucia, F. 1984, J. Mol. Spectrosc., 103, 486 [NASA ADS] [CrossRef] [Google Scholar]
- Skouteris, D., Balucani, N., Ceccarelli, C., et al. 2018, ApJ, 854, 135 [NASA ADS] [CrossRef] [Google Scholar]
- Tinacci, L., Ferrada-Chamorro, S., Ceccarelli, C., et al. 2023, ApJS, 266, 38 [NASA ADS] [CrossRef] [Google Scholar]
- Tychoniec, Ł., van Dishoeck, E. F., et al. 2021, A&A, 655, A65 [NASA ADS] [CrossRef] [EDP Sciences] [Google Scholar]
- Tychoniec, Ł., Hull, C. L. H., Kristensen, L. E., et al. 2019, A&A, 632, A101 [NASA ADS] [CrossRef] [EDP Sciences] [Google Scholar]
- van Gelder, M. L., Tabone, B., Tychoniec, Ł., et al. 2020, A&A, 639, A87 [NASA ADS] [CrossRef] [EDP Sciences] [Google Scholar]
- van’t Hoff, M. L. R., Bergin, E. A., Riley, P., et al. 2024, ApJ, 970, 138 [Google Scholar]
- Vazart, F., Ceccarelli, C., Balucani, N., et al. 2020, MNRAS, 499, 5547 [Google Scholar]
- Wakelam, V., Selsis, F., Herbst, E., & Caselli, P. 2005, A&A, 444, 883 [NASA ADS] [CrossRef] [EDP Sciences] [Google Scholar]
- Wakelam, V., Herbst, E., Le Bourlot, J., et al. 2010, A&A, 517, A21 [NASA ADS] [CrossRef] [EDP Sciences] [Google Scholar]
- Watanabe, N., & Kouchi, A. 2002, ApJ, 571, L173 [Google Scholar]
- Yang, Y.-L., Sakai, N., Zhang, Y., et al. 2021, ApJ, 910, 20 [Google Scholar]
- Zucker, C., Speagle, J. S., Schlafly, E. F., et al. 2019, ApJ, 879, 125 [NASA ADS] [CrossRef] [Google Scholar]
- Zucker, C., Speagle, J. S., Schlafly, E. F., et al. 2020, A&A, 633, A51 [NASA ADS] [CrossRef] [EDP Sciences] [Google Scholar]
Appendix A: Observed spectra and line fits
Figures A.1 and A.2 show the CH3OH, CH3CN, and CO spectra extracted in the four regions of the S68N outflow, together with the multi-component fits used to analyse the CH3CN emission. To verify if the gas properties change at different velocities, we performed a separate analysis for the high- and low-velocity kinematic components, shown in the rotation diagrams of Figure A.3. Table A.1 reports the results for both regimes, including column densities, temperatures, and abundance ratios. We find no significant variations in the column densities of CH3CN and CH3OH with increasing distance from the protostar. However, the rotational temperatures derived from the high-velocity components are higher than those of the low-velocity gas, likely reflecting the more efficient heating and compression produced by shocks in the fastest-moving material. The CH3OH/CH3CN abundance ratios for both velocity components are consistent, within uncertainties, with those derived from the combined (high+low) velocity analysis. This suggests that, despite the different thermal conditions, the relative chemical abundances remain robust and do not show significant variations along the outflow or between different velocity regimes.
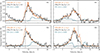 |
Fig. A.1. CH3CN 62-52 (black), CH3OH 211-101 (orange) and CO 2-1 (teal) spectra (in K) extracted in the four regions of the red-shifted (R1 and R2) and blue-shifted (B1 and B2) outflows of S68N. The spectral resolutions are 0.061 MHz (0.16 km s−1) for CH3CN, 0.122 MHz (0.14 km s−1) for CH3OH, and 0.384 MHz (0.5 km s−1) for CO. The CH3CN emission is multiplied by a factor 6.5 in R1 and R2, and by a factor 8 in B1 and B2. The CO emission is multiplied by a factor 0.02 in R1 and R2, 0.01 in B1 and 0.03 in B2 for visualisation purposes. The black dashed vertical lines mark the vsys (+8.5 km s−1, Lee et al. 2014). |
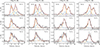 |
Fig. A.2. Spectral fits of the CH3CN 60–50, 61–51, 62–52, and 63–53 transitions extracted in the four regions R1, R2, B1, and B2. In the upper panels of each region, the transitions producing the emission lines (see Table 1) are indicated, and their corresponding frequencies are marked by small vertical purple lines. The spectra are centred at the frequency of the 60–50 transition (110.3835 GHz). In regions R1 and R2, each transition shows a main peak at +9–10 km s−1 (orange curves) and a secondary component redshifted by ∼3–4 km s−1 (blue curves). In regions B1 and B2, each transition shows a main peak at +6 km s−1 (orange curves) and a secondary component blueshifted by ∼5 km s−1 (blue curves). In all panels, the red curves show the total multi-component fits. The dashed vertical line marks the systemic velocity, +8.5 km s−1 (Lee et al. 2014). |
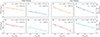 |
Fig. A.3. CH3CN rotation diagram with fit for the four regions R1, R2, B1 and B2 of the S68N outflows obtained separating the high and low velocity components of the fits. The colour coding is the same used in Fig. 1 to identify the four regions. The resulting column densities and rotational temperatures are reported on the top right corner of each diagram. |
Line fit results of CH3CN and CH3OH from the high and low velocity components (see Sect. 3).
Appendix B: LVG analysis
We used a non-LTE analysis via our in-home large velocity gradient (LVG) code grelvg (Ceccarelli et al. 2002, 2003) to predict the molecular line intensities that are simultaneously fitted via comparison to the observed ones using a χ2 minimisation. The collisional coefficients of CH3CN are reported in the LAMDA database1, computed by (Ben Khalifa et al. 2023) between 20 and 100 K for the lowest 50 levels of A-CH3CN-He (ortho) and E-CH3CN-He (para) and scaled for collisions with H2. We assumed a semi-infinite expanding slab geometry, the H2 ortho-to-para ratio equal to 3 and the CH3CN A-to-E ratio equal to 1.
We ran a large grid of models covering the frequency of the observed CH3CN lines, with a total (A plus E) column density NCH3CN ranging from 4 × 10¹² to 6 × 1013 cm−2, a gas density nH2 from 3 × 10⁶ to 109 cm−3, and a temperature T from 40 to 85 K. We simultaneously fit the measured CH3CN line intensities in R1, R2, B1 and B2 via comparison with those simulated by the LVG model, leaving NCH3CN, nH2 and T, and assuming that the source is extended. Following the observations, we assumed a line width equal to 5 km s−1 and included the calibration uncertainty (10%) in the observed intensities. The best-fit parameters obtained from our LVG analysis are summarised in Table B.1 and Fig. B.1. The obtained densities (nH2≥ 5.5 × 106 cm−3) and optical depth values (τ≤0.01) indicate that the LTE and optically thin conditions are valid for CH3CN. Indeed, the resulting excitation temperatures and CH3CN column densities are in agreement with the values derived through the RD method (see Table A.1). Furthermore, the gas densities derived for all regions are ≳107 cm−3, which is consistent with the high-density environment of the S68N outflows previously reported by Le Gouellec et al. (2025) in the region close to the protostar.
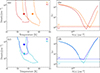 |
Fig. B.1. LVG analysis of CH3CN in the S68N outflows. Panels (a) and (b): Density–temperature χ2 contour plot (a) and reduced χ2 versus NCH3CN plot (b) for R1 (orange) and R2 (red). In panel (a), the contours represent the 1σ confidence levels, and the best-fit solutions for R1 and R2 are marked by orange and red stars, respectively. Colour coding matches that of Fig. 1. Panels (c) and (d): Same as (a) and (b), but for the blue-shifted regions B1 (blue) and B2 (cyan). |
Best-fit results and 1σ (50%) confidence level (range) from the non-LTE LVG analysis of the CH3CN lines.
Appendix C: Model description
To estimate the abundances of CH3OH and CH3CN, we employed the MyNahoon chemical code (Wakelam et al. 2005, 2010), which calculates gas–phase abundances for a given set of physical parameters (i.e. temperature, T, density, nH2, visual extinction, Av, and cosmic ray ionisation rate, ζCR). The simulations make use of the GRETOBAPE gas-phase chemical network (Tinacci et al. 2023), which incorporates several updated reactions based on studies carried out by our group and others (Loison et al. 2014; Balucani et al. 2015; Skouteris et al. 2018; Vazart et al. 2020; Blázquez et al. 2020; Giani et al. 2023, 2025).
To investigate how the passage of a shock affects the chemical composition of the gas, we adopted a two-step approach similar to that previously applied in modelling protostellar molecular shocks (e.g. Podio et al. 2014; Codella et al. 2017; De Simone et al. 2020; Bouvier et al. 2025). In the first step, we derived the chemical composition of the pre-shock cloud, starting from the elemental abundances listed in Table C.1. The physical conditions were set to T = 10 K, nH2 = 1 × 104 cm−3, and Av = 100 mag, with a cosmic-ray ionisation rate of ζCR = 1 × 10⁻¹⁷ s−1. In the second step, we simulated the effect of mantle sputtering induced by the shock by enhancing the abundances of several species released from dust grain mantles (the injected species and their abundances are reported in Table C.1). The injected species are those generally considered to form predominantly on grain surfaces and for which gas-phase formation is inefficient. However, the formation of CH3CN is still a matter of debate (see Sect. 4). For this reason, we chose not to inject CH3CN into the gas phase, as our goal is to assess the efficiency of its gas-phase formation under the assumption of a negligible grain-surface contribution. We then followed the chemical evolution under post-shock conditions assuming a gas temperature of ∼60 K (derived from CH3CN observations, see Sect. 3) and densities in the range 106–108 cm−3. We also tested temperatures between ∼40 and 70 K, consistent with the values reported in Table 1. The CH3OH/CH3CN ratio is only weakly affected by the adopted temperature, varying by less than 10% over this range. We adopted different values of the cosmic-ray ionisation rate, namely, ζCR = 10−16, 10−15, and 10−14 s−1. Due to the high densities considered, the outflow region was assumed to be highly shielded from external radiation, and therefore a visual extinction of Av = 100 was adopted. The abundance of injected methanol was treated as a free parameter and varied between 1 × 10⁻⁸ and 7 × 10⁻⁶, in agreement with the upper limit derived in Sect. 4 (≲4×10⁻⁶).
Initial elemental abundances relative to H nuclei adopted for the cold molecular cloud model (Jenkins 2009) (left) and abundances of species injected into the gas phase after the shock passage (right).
The model results are shown in Fig. C.1. In general, higher densities lead to faster chemical evolution, resulting in lower CH3OH/CH3CN abundance ratios at earlier times. An increase in the cosmic-ray ionisation rate (ζCR) also leads to a significant decrease in the CH3OH/CH3CN abundance ratio. The main formation pathway of methyl cyanide in outflows involves two steps: the radiative association of CH3+ with HCN to form protonated methyl cyanide (CH3CNH+), followed by proton transfer to ammonia (CH3CNH+ + NH3) producing CH3CN. At low ionisation rates (ζCR ∼ 10−16 s−1), methanol is mainly destroyed through reactions with H3+, enhancing the production of CH3+, the key precursor in the formation of CH3CN. At higher ionisation rates (ζCR ∼ 10−14 s−1), the chemistry changes: methanol destruction is dominated by reactions with H3O+, while CH3+ is formed via the CH2+ + H2 reaction. The combined effect of more efficient methanol destruction and enhanced CH3CN production results in a marked reduction of the CH3OH/CH3CN ratio.
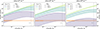 |
Fig. C.1. Same as Fig. 3 but for densities of 106 (left panel), 107 (middle panel) and 108 (right panel) cm−3. |
All Tables
Spectroscopic parameters and line fit results over the whole emission (high + low components) of CH3CN and CH3OH.
Line fit results of CH3CN and CH3OH from the high and low velocity components (see Sect. 3).
Best-fit results and 1σ (50%) confidence level (range) from the non-LTE LVG analysis of the CH3CN lines.
Initial elemental abundances relative to H nuclei adopted for the cold molecular cloud model (Jenkins 2009) (left) and abundances of species injected into the gas phase after the shock passage (right).
All Figures
|
Fig. 1. S68N outflows and its analysis. Left panel: 2.7 mm continuum (greyscale) with overlaid redshifted and blueshifted emission of CH3CN 62 − 52 (salmon/cyan shaded contours) and CH3OH 2−1, 1 − 10, 1 (red and blue contours). Contours start at 2σ in steps of 1σ (σ = 60 and 50 mJy beam−1 km s−1 for CH3CN and CH3OH, respectively). Black circles label the analysed regions (R1, R2, B1, B2); stars mark protostellar positions. The dashed circle indicates the CH3OH primary beam and synthesised beams are shown at the bottom-right. Right panel: CH3CN rotation diagrams in the four labelled regions. Colour coding is the same as in the left panel. Derived column densities and rotational temperatures are reported. |
| In the text | |
|
Fig. 2. Spectral fits of CH3CN 60–50 and 61–51 in R1 (all regions in Fig. A.2) Orange and blue curves represent the main peaks (at vsys ± 1 km s−1) and the redshifted (+3–4 km s−1 from vsys) components, respectively. Red curves show the total fit. Dashed vertical line marks the systemic velocity, +8.5 km s−1 (Lee et al. 2014). Purple ticks indicate transition frequencies from Table 1. |
| In the text | |
|
Fig. 3. Comparison of predicted and observed CH3OH/CH3CN abundance ratio versus CH3OH/H2 (see Fig. C.1 for other densities). Lines show model predictions at 300 (solid) and 1000 (dashed) yr after shock passage, with shaded areas representing intermediate times. Ratios are plotted for ζCR: 1 × 10⁻¹⁴ (green), 1 × 10⁻¹⁵ (cyan), and 1 × 10⁻¹⁶ (purple) s−1. The orange band show the observed ratio (see Table 1), while the vertical grey line marks the CH3OH abundance upper limit (Sect. 4). |
| In the text | |
|
Fig. A.1. CH3CN 62-52 (black), CH3OH 211-101 (orange) and CO 2-1 (teal) spectra (in K) extracted in the four regions of the red-shifted (R1 and R2) and blue-shifted (B1 and B2) outflows of S68N. The spectral resolutions are 0.061 MHz (0.16 km s−1) for CH3CN, 0.122 MHz (0.14 km s−1) for CH3OH, and 0.384 MHz (0.5 km s−1) for CO. The CH3CN emission is multiplied by a factor 6.5 in R1 and R2, and by a factor 8 in B1 and B2. The CO emission is multiplied by a factor 0.02 in R1 and R2, 0.01 in B1 and 0.03 in B2 for visualisation purposes. The black dashed vertical lines mark the vsys (+8.5 km s−1, Lee et al. 2014). |
| In the text | |
|
Fig. A.2. Spectral fits of the CH3CN 60–50, 61–51, 62–52, and 63–53 transitions extracted in the four regions R1, R2, B1, and B2. In the upper panels of each region, the transitions producing the emission lines (see Table 1) are indicated, and their corresponding frequencies are marked by small vertical purple lines. The spectra are centred at the frequency of the 60–50 transition (110.3835 GHz). In regions R1 and R2, each transition shows a main peak at +9–10 km s−1 (orange curves) and a secondary component redshifted by ∼3–4 km s−1 (blue curves). In regions B1 and B2, each transition shows a main peak at +6 km s−1 (orange curves) and a secondary component blueshifted by ∼5 km s−1 (blue curves). In all panels, the red curves show the total multi-component fits. The dashed vertical line marks the systemic velocity, +8.5 km s−1 (Lee et al. 2014). |
| In the text | |
|
Fig. A.3. CH3CN rotation diagram with fit for the four regions R1, R2, B1 and B2 of the S68N outflows obtained separating the high and low velocity components of the fits. The colour coding is the same used in Fig. 1 to identify the four regions. The resulting column densities and rotational temperatures are reported on the top right corner of each diagram. |
| In the text | |
|
Fig. B.1. LVG analysis of CH3CN in the S68N outflows. Panels (a) and (b): Density–temperature χ2 contour plot (a) and reduced χ2 versus NCH3CN plot (b) for R1 (orange) and R2 (red). In panel (a), the contours represent the 1σ confidence levels, and the best-fit solutions for R1 and R2 are marked by orange and red stars, respectively. Colour coding matches that of Fig. 1. Panels (c) and (d): Same as (a) and (b), but for the blue-shifted regions B1 (blue) and B2 (cyan). |
| In the text | |
|
Fig. C.1. Same as Fig. 3 but for densities of 106 (left panel), 107 (middle panel) and 108 (right panel) cm−3. |
| In the text | |
Current usage metrics show cumulative count of Article Views (full-text article views including HTML views, PDF and ePub downloads, according to the available data) and Abstracts Views on Vision4Press platform.
Data correspond to usage on the plateform after 2015. The current usage metrics is available 48-96 hours after online publication and is updated daily on week days.
Initial download of the metrics may take a while.