


Fig. A.1.
Download original image
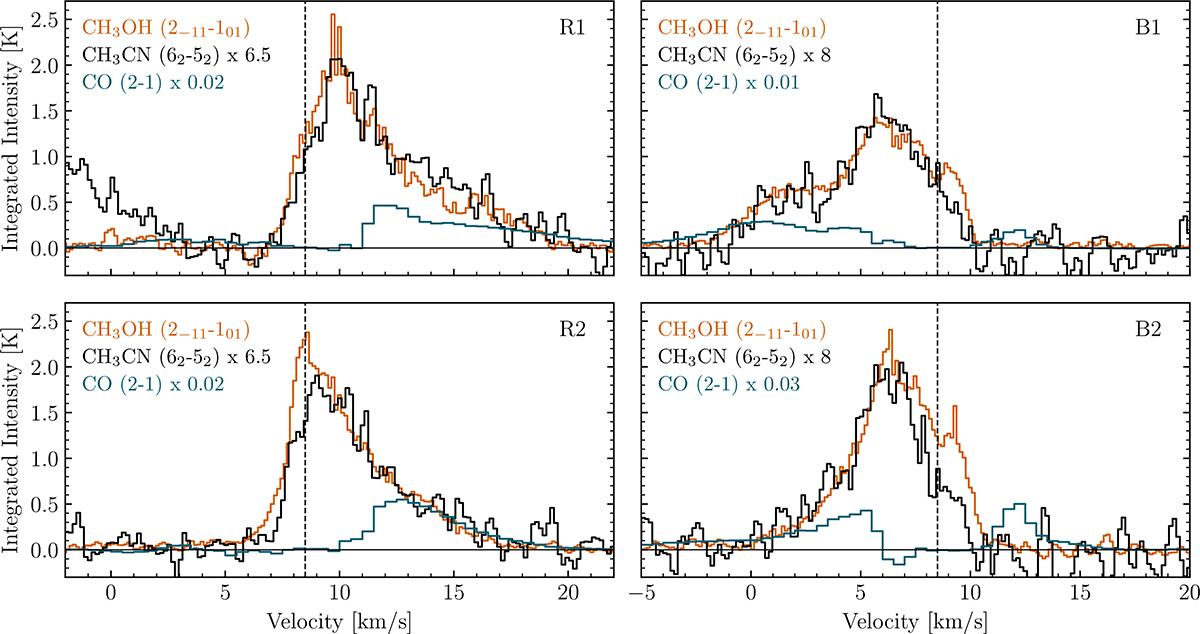
CH3CN 62-52 (black), CH3OH 211-101 (orange) and CO 2-1 (teal) spectra (in K) extracted in the four regions of the red-shifted (R1 and R2) and blue-shifted (B1 and B2) outflows of S68N. The spectral resolutions are 0.061 MHz (0.16 km s−1) for CH3CN, 0.122 MHz (0.14 km s−1) for CH3OH, and 0.384 MHz (0.5 km s−1) for CO. The CH3CN emission is multiplied by a factor 6.5 in R1 and R2, and by a factor 8 in B1 and B2. The CO emission is multiplied by a factor 0.02 in R1 and R2, 0.01 in B1 and 0.03 in B2 for visualisation purposes. The black dashed vertical lines mark the vsys (+8.5 km s−1, Lee et al. 2014).
Current usage metrics show cumulative count of Article Views (full-text article views including HTML views, PDF and ePub downloads, according to the available data) and Abstracts Views on Vision4Press platform.
Data correspond to usage on the plateform after 2015. The current usage metrics is available 48-96 hours after online publication and is updated daily on week days.
Initial download of the metrics may take a while.