


Fig. 3.
Download original image
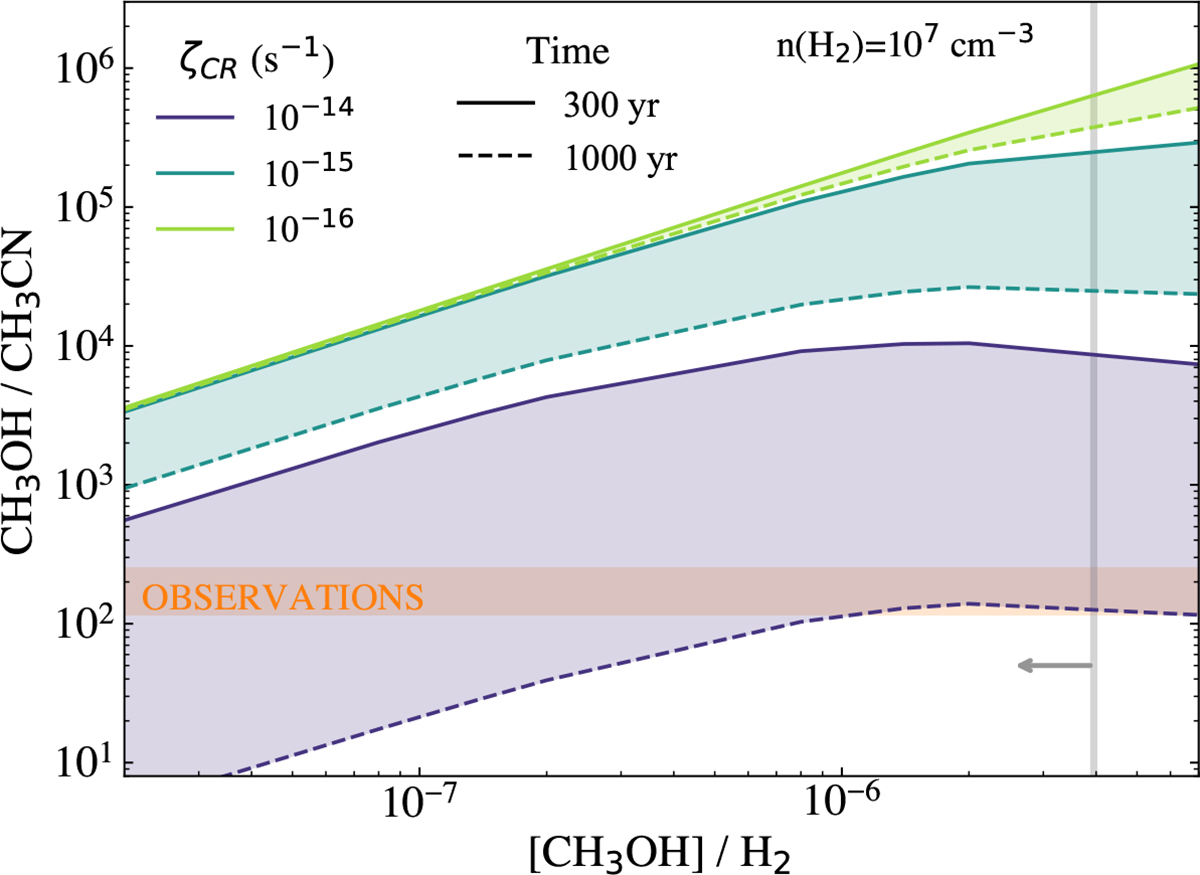
Comparison of predicted and observed CH3OH/CH3CN abundance ratio versus CH3OH/H2 (see Fig. C.1 for other densities). Lines show model predictions at 300 (solid) and 1000 (dashed) yr after shock passage, with shaded areas representing intermediate times. Ratios are plotted for ζCR: 1 × 10⁻¹⁴ (green), 1 × 10⁻¹⁵ (cyan), and 1 × 10⁻¹⁶ (purple) s−1. The orange band show the observed ratio (see Table 1), while the vertical grey line marks the CH3OH abundance upper limit (Sect. 4).
Current usage metrics show cumulative count of Article Views (full-text article views including HTML views, PDF and ePub downloads, according to the available data) and Abstracts Views on Vision4Press platform.
Data correspond to usage on the plateform after 2015. The current usage metrics is available 48-96 hours after online publication and is updated daily on week days.
Initial download of the metrics may take a while.