


Fig. 2.
Download original image
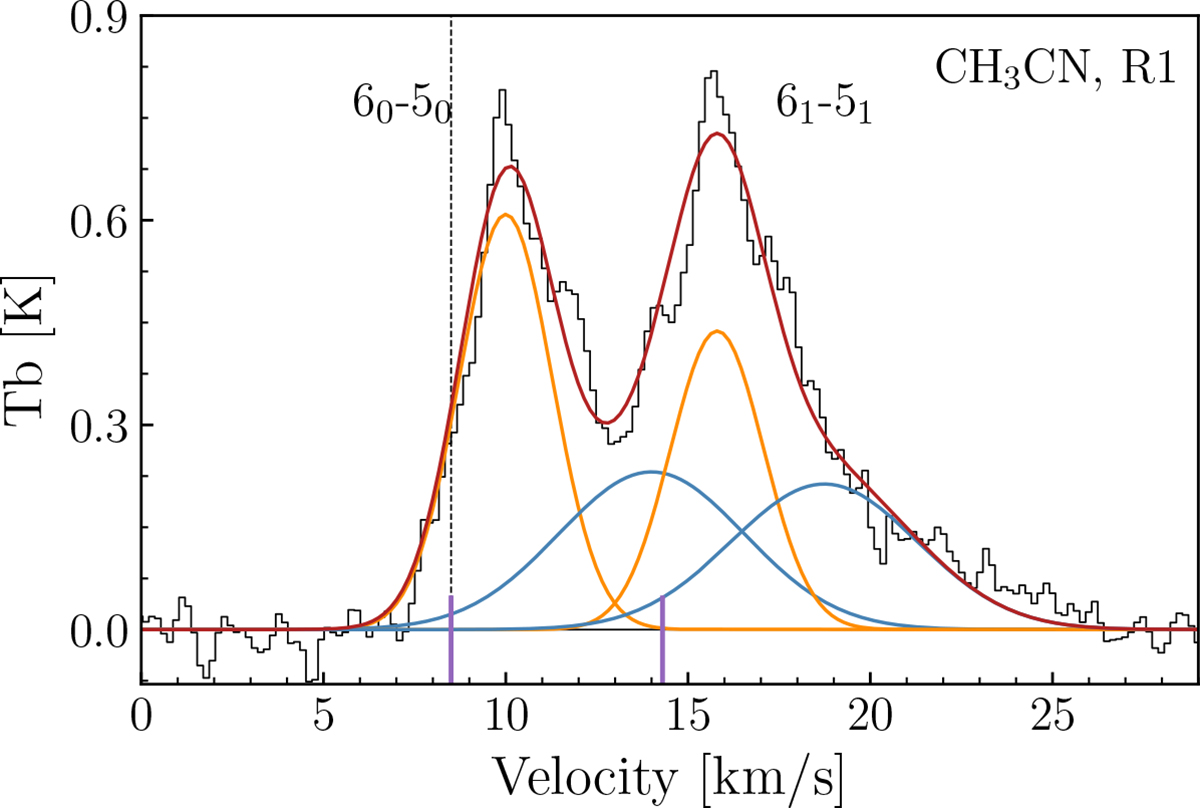
Spectral fits of CH3CN 60–50 and 61–51 in R1 (all regions in Fig. A.2) Orange and blue curves represent the main peaks (at vsys ± 1 km s−1) and the redshifted (+3–4 km s−1 from vsys) components, respectively. Red curves show the total fit. Dashed vertical line marks the systemic velocity, +8.5 km s−1 (Lee et al. 2014). Purple ticks indicate transition frequencies from Table 1.
Current usage metrics show cumulative count of Article Views (full-text article views including HTML views, PDF and ePub downloads, according to the available data) and Abstracts Views on Vision4Press platform.
Data correspond to usage on the plateform after 2015. The current usage metrics is available 48-96 hours after online publication and is updated daily on week days.
Initial download of the metrics may take a while.