


| Issue |
A&A
Volume 711, July 2026
|
|
|---|---|---|
| Article Number | A298 | |
| Number of page(s) | 17 | |
| Section | Extragalactic astronomy | |
| DOI | https://doi.org/10.1051/0004-6361/202659423 | |
| Published online | 24 July 2026 | |
Characterising Lyα damping wings at the onset of reionisation
Evidence for highly efficient star formation driven by dense, neutral gas in UV-bright galaxies at z > 9
1
Cosmic Dawn Center (DAWN), Denmark
2
Niels Bohr Institute, University of Copenhagen, Jagtvej 128, 2200 Copenhagen N, Denmark
3
DTU Space, Technical University of Denmark, Elektrovej 327, DK2800 Kgs. Lyngby, Denmark
4
Institute for Computational Cosmology, Department of Physics, Durham University, South Road, Durham DH1 3LE, UK
5
Canadian Institute for Theoretical Astrophysics, 60 St George St, University of Toronto, Toronto, ON M5S 3H8, Canada
6
David A. Dunlap Department of Astronomy and Astrophysics, University of Toronto, 50 St George St, Toronto, ON M5S 3H4, Canada
7
Department of Physics, 60 St George St, University of Toronto, Toronto, ON M5S 3H8, Canada
8
Department of Astronomy, Yale University, New Haven, CT 06511, USA
9
Stockholm University, Department of Astronomy and Oskar Klein Centre for Cosmoparticle Physics, AlbaNova University Centre, SE-10691 Stockholm, Sweden
10
Department of Physics, School of Advanced Science and Engineering, Faculty of Science and Engineering, Waseda University, 3-4-1 Okubo, Shinjuku, Tokyo 169-8555, Japan
11
Waseda Research Institute for Science and Engineering, Faculty of Science and Engineering, Waseda University, 3-4-1 Okubo, Shinjuku, Tokyo 169-8555, Japan
12
International Centre for Radio Astronomy Research (ICRAR), M468, University of Western Australia, 35 Stirling Hwy, Crawley, WA 6009, Australia
13
Department of Astronomy, University of Geneva, Chemin Pegasi 51, 1290 Versoix, Switzerland
14
MIT Kavli Institute for Astrophysics and Space Research, 70 Vassar Street, Cambridge, MA 02139, USA
15
Leiden Observatory, Leiden University, PO Box 9513, NL-2300 RA, Leiden, The Netherlands
16
School of Physics and Astronomy, University of Leicester, University Rd, Leicester LE1 7RH, UK
17
Kavli Institute for Cosmology, University of Cambridge, Madingley Road, Cambridge CB3 0HA, UK
18
Cavendish Laboratory, University of Cambridge, 19 JJ Thomson Avenue, Cambridge CB3 0HE, UK
19
Max-Planck-Institut fÜr Astronomie, Königstuhl 17, D-69117 Heidelberg, Germany
★ Corresponding author: This email address is being protected from spambots. You need JavaScript enabled to view it.
Received:
12
February
2026
Accepted:
19
May
2026
Abstract
One of the major conundrums in contemporary extragalactic astrophysics is the apparent overabundance of a remarkable population of UV-bright galaxies at redshifts z ≳ 9. We analysed galaxies spectroscopically observed by JWST/NIRSpec PRISM and confirmed to lie at z > 9, with a sufficient signal-to-noise to carefully model their rest-frame UV-to-optical continua and line emission. In particular, we modelled the damped Lyman-α (Lyα) absorption (DLA) features of each galaxy to place observational constraints on the gas assembly of neutral atomic hydrogen (H I) onto the galaxy halos at the onset of cosmic reionisation. Based on the derived H I column densities and star formation rate (SFR) surface densities, we show that all galaxies are highly efficient at forming stars on rapid ∼10 − 100 Myr depletion timescales, greatly in excess compared to the canonical local Universe Kennicutt-Schmidt (KS) relation and predictions from state-of-the-art galaxy formation simulations. The dense H I gas appears to also drive the offset from the fundamental-metallicity relation (FMR) of these galaxies though its dust-to-gas (DTG) ratio is seemingly consistent with values derived for local galaxies except for the lowest metallicity sight lines. Our results provide the first robust observational constraints on the impact of pristine H I gas on early galaxy assembly, and they imply that a combination of highly efficient star formation and low dust obscuration can likely explain the UV brightness of galaxies at cosmic dawn.
Key words: galaxies: evolution / galaxies: formation / galaxies: high-redshift / galaxies: star formation
© The Authors 2026
 Open Access article, published by EDP Sciences, under the terms of the Creative Commons Attribution License (https://creativecommons.org/licenses/by/4.0), which permits unrestricted use, distribution, and reproduction in any medium, provided the original work is properly cited.
This article is published in open access under the Subscribe to Open model. This email address is being protected from spambots. You need JavaScript enabled to view it. to support open access publication.
1. Introduction
The formation of the first stars and galaxies at cosmic dawn is widely thought to be initiated by the infall of pristine neutral gas onto dark matter halos (White & Rees 1978; Kereš et al. 2005; Dekel et al. 2009; Schaye et al. 2010; Dayal & Ferrara 2018). Early observations of JWST revealed that the first galaxies at z ≳ 10 were far more abundant and luminous than previously expected (e.g. Castellano et al. 2022; Naidu et al. 2022; Atek et al. 2023; Bouwens et al. 2023; Donnan et al. 2023; Finkelstein et al. 2023; Harikane et al. 2023; Adams et al. 2024; McLeod et al. 2024; Robertson et al. 2024; Carniani et al. 2024). Further, these most distant galaxies appear to have lower chemical abundances than expected from their mass and star formation rates (SFRs; e.g. Heintz et al. 2023a; Curti et al. 2024; Nakajima et al. 2023; Pollock et al. 2026). A key missing piece of these contemporary puzzles is the abundance and distribution of neutral atomic hydrogen (H I), how it drives early star formation, impacts local galaxy formation prescriptions, and the escape of ionising photons from the galaxies to the large-scale intergalactic medium (IGM).
A direct measure of H I in the high redshift universe has typically been determined from Lyman-α (Lyα) absorption in bright background objects such as quasars (White et al. 2003; Wolfe et al. 2005; Fan et al. 2006) or gamma-ray bursts (GRBs; Totani et al. 2006; Prochaska et al. 2007; Fynbo et al. 2009; Tanvir et al. 2019). These trace the neutral hydrogen on various scales from the interstellar and circumgalactic media (ISM and CGM, respectively) to the IGM, but only for a narrow line of sight, and with few measurements existing beyond redshift z ∼ 6.5. However, early studies of the UV turnover in JWST spectra revealed several strong damped Lyα absorption (DLA) systems with column densities NHI > 1022 cm−2 (Heintz et al. 2024, 2025a; D’Eugenio et al. 2024; Chen 2024; Umeda et al. 2024), implying absorption far greater than would be expected from gas in the IGM alone. These damped wings are evidence of significant neutral gas which is associated with the galaxy itself.
Including DLAs in modelling early galaxy spectra is important for obtaining accurate spectroscopic redshifts (Witstok et al. 2026; Asada et al. 2025; Heintz et al., in prep.). They can also have a profound impact on reionisation studies; the gas is fully self-shielding and thereby prevents escape of ionising photons. Understanding the distribution and covering fraction is thus vital for early reionisation models and for measuring the neutral hydrogen fraction of the IGM xHI, accurately (Huberty et al. 2025; Mason et al. 2026; Umeda et al. 2024, 2026).
Originally it was hypothesised that the galaxy DLAs observed could be probing the infalling pristine gas itself, which would be diluting the metal-enriched gas of the ISM, possibly explaining the offset observed from the fundamental metallicity relation (FMR) at high-z (Heintz et al. 2023a; Nakajima et al. 2023; Curti et al. 2024; Pollock et al. 2026). However, recent cosmological zoom-in simulation studies (Gelli et al. 2025) have suggested that for most lines of sight, the H I gas column density is dominated by the ISM and central starburst regions, with a minimal chance of intersecting a pristine filament or accretion channel. Further, Rowland et al. (2025) find tentative evidence that the neutral gas content inferred from [C II] luminosities is correlated to the H I gas mass derived from the damping wings, indicating that DLAs are likely associated with gas in the star-forming regions of the ISM. The gas traced by galaxy DLAs at high redshifts therefore likely provide new and unique insights to many of the processes governing galaxy growth and the ‘baryon cycle’ including star formation, chemical enrichment, and dust production from the available inflow of pristine, neutral gas.
The luminous galaxies at z > 10 are particularly puzzling in this framework. Several explanations have been proposed to alleviate their tension with galaxy formation models, including bursty star formation (Mason et al. 2023; Shen et al. 2023; Gelli et al. 2024), a top-heavy initial mass function (IMF) (Harikane et al. 2024; Menon et al. 2024; Cueto et al. 2024; Hutter et al. 2025; Mauerhofer et al. 2025), or enhanced star formation efficiency from feedback-free systems (Dekel et al. 2023; Boylan-Kolchin 2025). Given the high SFRs and compact sizes of the earliest galaxies (Roberts-Borsani et al. 2026; Naidu et al. 2026; Tang et al. 2026), one would expect short free-fall and depletion times, leading to efficient gas-to-star conversion. Moreover, a short free-fall time implies limited dust production (Asano et al. 2013), which would further contribute to the exceptional brightness of these primordial systems (Ferrara et al. 2023).
The visibility of prominent Lyα emission even in some of the most distant galaxies (e.g. at z ≈ 11 and z ≈ 13; Bunker et al. 2023; Witstok et al. 2025), at a point in cosmic time where the IGM is expected to be fully neutral, is similarly surprising. Supporting these observations is the detection of a mild Lyα damping in MoM-z14 (Naidu et al. 2026), implying a non-negligible fraction of ionised hydrogen in the IGM already at z ≳ 14. These features can potentially be explained by significant outflows clearing the gas locally and thus allowing Lyα and Lyman-continuum (LyC) photons to escape (Ferrara 2024a; Witten et al. 2024). Or, more intriguingly, it may constitute the first hints of an increased optical depth to reionisation (Sailer et al. 2026), suggesting an earlier onset of reionisation.
For this study, we have compiled all publicly available JWST spectra of galaxies at z > 9 to investigate the physical origin and properties of the discovered UV-bright galaxy population. The main goals have been to constrain the earliest phases of H I gas mass assembly, as well as determine how this drives the elevated star formation efficiencies, and impacts the onset of reionisation. This is now possible via the observed strong DLA features and implied gas column densities in this most distant galaxy population.
Our paper is structured as follows: in Section 2 we briefly describe the data reduction, detail our sample selection, and introduce the observations. In Section 3, we outline the methodology used to model DLAs, emission lines, as well as calculations for the SFR and other gas properties. In Section 4 we present the distribution of neutral gas, dust, and metals in our sample and compare it to simulations. Finally, in Sect. 5 we summarise and conclude on our work. Throughout this paper, we assume standard cosmology derived from the Astropy cosmology package, with cosmological parameters from Planck Collaboration VI (2020), and solar abundance 12 + log(O/H)⊙ = 8.69 (Asplund et al. 2009).
2. Observations
For this work, we compile all galaxies with a robust spectroscopic redshift (grade 3) at z > 9, and sufficient S/N to model the rest-frame UV from the DAWN JWST Archive (DJA; Brammer & Valentino 2025) version 4 (Valentino et al. 2025; Pollock et al. 2026), (previously Heintz et al. 2025a for v2, de Graaff et al. 2025 for v3) with full JWST/NIRSpec PRISM spectroscopy (λ = 0.6 − 5.5 μm, R ≈ 100, R(1.3 μm)∼30; Jakobsen et al. 2022). The above references detail the updates from the default JWST reduction pipeline for the Mikulski Archive for Space Telescope (MAST) data products. The most important update for the v4 spectra used here is the bar shadow correction, improving the absolute and colour-dependent flux calibration, and the extended wavelength range in the red end from 5.3 (default) to 5.5 μm. We further only consider sources with a median signal-to-noise (S/N) > 3 in the rest-frame UV (≈1500 Å) region of the spectra. The sample spans MUV = −16.4 → −21.9, with median MUV = 19.9.
We also include proprietary data for two galaxies from the Mirage or Miracle survey (PIs: P. A. Oesch and R. Naidu; GO-5244); one galaxy (MoM-z11) at zspec = 10.71 and the previously reported source MoM-z14 at zspec = 14.44 (Naidu et al. 2026). Complementing the MoM data is a multitude of publicly available data from various JWST programmes, including JADES; #1181, PI: D. Eisenstein, #1210, PI N. Lützgendorf, #1286, PI: N. Lützgendorf, #1287, PI: K. Isaak, #3215, PI: D. Eisenstein (Eisenstein et al. 2025), CEERS; #1345, PI: S. Finkelstein (Finkelstein et al. 2023), #2750, PI: P. Arrabal Haro (Arrabal Haro et al. 2023), CAPERS; #6368, PI: M. Dickinson, UNCOVER; #2561, PI: I. Labbe (Bezanson et al. 2024), RUBIES; #4233, PI: A. de Graaff (de Graaff et al. 2025), GLASS; #3073, PI: M. Castellano (Napolitano et al. 2025), DD-2756, PI: W. Chen, GO-1433, PI: D. Coe, and DD-2767, PI: P. Kelly.
There are a total of 48 galaxies in our compiled sample, of which 22 are spectroscopically confirmed to be z > 10. In the majority of cases (41/48), we are able to identify rest-frame UV or optical nebular emission lines to pin-point the systemic redshift, essential to robustly model the Lyα break and potential damping wings. A broader discussion about the caveats of estimating the redshifts from the Lyα breaks alone for z > 10 galaxies is provided in a companion paper (Heintz et al., in prep., see also; Hainline et al. 2024a; Witstok et al. 2026). The full sample is listed in Table A.1 in Appendix A, along with properties and literature references.
3. Analysis
3.1. Emission-line modelling
In each spectrum, we identified the most prominent nebular emission lines at the target redshift, ranging from Lyα to the [O III] λλ4960, 5008 doublet (up to z = 10). We modelled each feature with Gaussian line profiles, at vacuum wavelengths, while tying the redshift and intrinsic width. The lines were convolved with the wavelength-dependent PRISM resolution, which generally dominates the observed line widths, with an additional factor of 1.3× improvement from the pre-launch predicted resolution (e.g. de Graaff et al. 2025). For the rest-frame UV regime, the following lines were superimposed on the underlying continuum modelled as a single power law, Fλ ∝ λβUV; N IV]λ1486, C IVλλ1548, 1550, He IIλ1640, O III]λλ1661, 66, N III]λλ1746, 1748, 1749, 1752, 1754, and C III]λλ1907, 1909, where the doublets/multiplets were modelled as single Gaussians as they are unresolved in PRISM spectra. The inferred UV continuum was also used to model the DLA feature in each galaxy (see Sect. 3.2 below).
Also of interest are the rest-frame optical emission lines, in particular Hβ, which is available in DJA v4 NIRSpec spectra for redshifts z ≲ 10.3. We measured the strong nebular optical emission lines available for each galaxy, namely [O III]λλ4959, 5007 (z ≲ 10), Hβ (z ≲ 10.3), Hγ and [O III]λ4363 (z ≲ 11.6), [Ne III]λ3869 (z ≲ 13.2), and [O II]λλ3727, 3729 (z ≲ 13.8). We tied the line fluxes of [O III]λλ4959, 5007 together with a ratio of 1:2.97 (Storey & Zeippen 2000), and modelled the unresolved [O II] doublet as a single Gaussian. The underlying continuum for the optical regime was modelled as a simple first-order polynomial. We note that that a majority of the galaxies, especially those in the higher-z range of the sample, have low-S/N spectra and so most emission lines fluxes can be constrained as upper limits only. For galaxies with limited optical lines, zspec is generally recovered from bright UV lines (in all but 7 cases), with the strongest tending to be C III]λ1909 (see also Roberts-Borsani et al. 2026; Tang et al. 2026; Hayes et al. 2025). Where available, we also considered line-redshifts confirmed through auxiliary data, for instance with ALMA data, e.g. JADES-GS-z11-0 (Witstok et al. 2026), and JADES-GS-z14-0 (Schouws et al. 2025b; Carniani et al. 2025).
3.2. Damped Lyα absorption line modelling
To model the Lyα damping wing, we included the full spectroscopic coverage for each galaxy from Lyα to λ ∼ 3000 Å rest-frame. This avoided any potential contamination to the fit from the Balmer break at 3645 Å. The intrinsic rest-frame UV continuum was modelled by a single power law Fλ ∝ λβUV as described above. Prominent emission lines from the separate UV slope modelling (Sect. 3.1) were added as Gaussian profiles to the intrinsic spectrum. The spectral slope βUV was left free in the DLA modelling, as there can be degeneracies between the slope and inferred column density. However, we find the median difference in derived βUV between the DLA and line modelling is 0.06 dex, with only 4 objects having a difference of > 0.2 dex in both, and outside the individual measurement uncertainties.
We derived the column density NHI for each case by approximating the Lyα absorption profile with a Voigt function, following the framework from Tepper-García (2006). The optical depth is given by
 (1)
(1)
where C is the photon absorption constant, a is damping parameter and H(a, x) is the Voigt-Hjerting function. This method has conventionally been used to trace neutral gas from foreground absorbers in the line of sight to bright quasars or gamma-ray bursts, though it has recently been adopted to study gas around singular high redshift galaxies (e.g. Heintz et al. 2024). This approach assumes the gas dominating the absorption profile is located at a similar redshift to the source, i.e. an early galaxy embedded in a massive neutral gas reservoir, rather than uniformly distributed along the line of sight (though see e.g. Terp et al. 2024; Heintz et al. 2026, for cases with prominent foreground absorption).
We also included a prescription for modelling the average fraction of neutral hydrogen in the IGM, as probed in each galaxy sight line. We caution that the neutral hydrogen fraction xHI typically cannot be well constrained due to the low spectral resolution of the PRISM configuration (Heintz et al. 2025a; Huberty et al. 2025; Mason et al. 2026), and at large column densities (NHI ≳ 1021 cm−2) the damping wing is dominated by the DLA from local H I gas. We adopted the formalism from Miralda-Escudé (1998), to model the absorption profile due to neutral hydrogen in the IGM from the Gunn-Peterson effect:
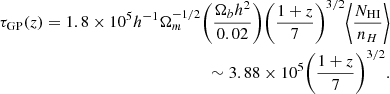 (2)
(2)
We used the correction from Totani et al. (2006) to model the contribution to absorption from xHI;
![Mathematical equation: $$ \begin{aligned} \tau _{\rm IGM}(\lambda , z_{\rm gal}) =&x_{\rm HI} R_\alpha \frac{\tau _{GP(z_{\rm gal})}}{\pi } \biggl (\frac{1+z_{\rm obs}}{1+z_{\rm gal}}\biggl )^{3/2}\nonumber \\&\times \biggl [I\biggl (\frac{1+z_{\rm IGM, u}}{1+z_{\rm obs}}\biggl ) - I\biggl (\frac{1+z_{\rm IGM, l}}{1+z_{\rm obs}}\biggl )\biggl ]. \end{aligned} $$](/articles/aa/full_html/2026/07/aa59423-26/aa59423-26-eq3.gif) (3)
(3)
Here Rα = ΛαλLyα/(4πc) = 2.02 × 10⁻⁸ is a constant which includes the damping constant of the Lyα resonance Λα, zgal is the spectroscopic redshift of the host galaxy, and zobs is the redshift of the neutral gas observed. Equation (3) assumes that the neutral hydrogen in the IGM is distributed uniformly between the upper and lower redshift bounds. We set the upper limit zIGM, u = zgal, and the lower limit zIGM, l = 5.3, when large-scale reionisation is expected to be complete (e.g. Bosman et al. 2022). The choice of the upper bound means that the galaxies do not live within ionised regions in the model. For the shape of the damping wing this choice is negligible, and assumes no nebular Lyα emission. Again, the neutral hydrogen fraction is not well constrained with PRISM data, and the choice of lower bound on redshift also does not meaningfully change the derived parameters. Combining the intrinsic power law (with emission lines), DLA absorption, and IGM absorption, the total UV spectral range is modelled as:
 (4)
(4)
where 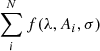 is the sum of all Gaussian line profiles for the identified emission lines. We also include JADES-GS-z13-1-LA (reported by Witstok et al. 2025) in the sample, where we include an additional Gaussian profile in the model for the Lyα line, added to the DLA+IGM model. We find a similarly high column density log(NHI/cm−2) =
  as reported in Witstok et al. (2025) (≈22.8), albeit from low-S/N spectra, and where the redshift is still uncertain.
An example best-fit model for a more representative high-z galaxy, with prominent UV emission lines and a strong DLA can be seen in Fig. 1. The inset of Fig. 1 highlights the Lyα region and compares two model fits: DLA+IGM absorption with the solid black line, and IGM only (with maximum neutral hydrogen fraction xHI = 1.0) as the dashed line. The high signal-to-noise of this spectrum clearly constrains that the strong damped UV-turnover cannot be reproduced purely with IGM absorption, and so additional H I gas characterised with a DLA (with  for this particular case), is likely present.
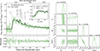 |
Fig. 1. Left: Example of UV emission line and DLA fitting for JADES-GS-z13-0 (DJA ID 3215_20128771) at z = 12.85. The NIRSpec/PRISM spectrum and associated error are shown in green. The marked UV emission lines were modelled and then superimposed on the intrinsic spectrum before modelling the DLA (solid black line). In the inset, we show a zoom on the Lyα region, with the DLA+IGM model as a solid line, and with 100% neutral IGM only (xHI = 1.0) as a dashed line. Right: Corner plot of the posterior distributions for the DLA+IGM model, with median, 16th and 84th percentiles marked. |
For the modelling of the emission lines and the Lyα damping wing, we used dynesty (Speagle 2020) to estimate the posteriors for free parameters and the total evidence of the distribution. The priors defined for each parameter for the standard DLA and IGM modelling were log10(NHI)∈Uniform(18, 24), xHI ∈ Uniform(0, 1), βUV ∈ Uniform(−4, 0), and log10(F0)∈Uniform(−17, −4). An example of the posterior distribution can be seen in the right panel of Figure 1. The best-fit model was convolved with the wavelength-dependent spectral resolution at each step of the optimisation (with the additional factor of 1.3× pre-launch predictions; as with the emission lines).
For objects for which the red wing cannot be decomposed into an IGM and host component (21/48), or damping wings suggesting a negligible DLA contribution, we additionally employed a model with only DLA absorption (τDLA) to the intrinsic spectra to obtain upper limits on the total column density (from the 95th percentile of the posterior). This method essentially provides a way to place an upper limit on the damping wing signal from both IGM and DLA absorption, as the two are not discernable in the PRISM spectra. We note that generally xHI = 1.0 is equivalent to an H I column density of NHI ≈ 1021 − 21.5 cm−2 at z = 6 − 14 (Mason et al. 2026). We also tested a model with only IGM absorption (τIGM) to obtain an upper limit for the neutral hydrogen fraction xHI, but the measurement uncertainties were substantial due to the low spectral resolution, and posteriors were generally flat (similarly to the right panel of Figure 1), or skewed towards either 0 or 1.0.
The redshifts were typically fixed for DLA fitting, from UV, optical, or ALMA emission line redshifts described in Section 3.1. As the location of the Lyman break is degenerate with column density, obtaining accurate spectroscopic redshifts are of utmost importance for accurate DLA modelling (e.g. Witstok et al. 2026). In the sample there were 7 galaxies with ambiguous redshift solutions (mostly z > 10, see e.g. 6368_22637), when the S/N of emission line detections are low, and we note that an uncertain redshift may be introducing a larger error in the derived column densities. For these cases we tested a model with absorption redshift left free. For the most part, these objects generally had unconstrained column densities in both modelling techniques, and redshifts are consistent within ±0.1 dex.
We note also 3215_20128771 (JADES-GS-z13-0), the example spectrum in Figure 1. Our fit results in a 3σ detection of both C III]λ1909 and [O III]λλ1661, 66, and zspec = 12.85 ± 0.02 which implies a column density of  . Fixing instead to the potential redshift solution from Hainline et al. (2024a) of zspec = 12.922, we obtained a virtually identical column density solution of
  . In a model with free absorption redshift, we found similar solutions though with larger uncertainties (and a tail to lower NHI in the posterior); zabs = 12.94 ± 0.29 and
  . For these handful of objects, we conclude that potential differences in redshift do not impact the overall findings with respect to the neutral gas content.
We note that Mason et al. (2026) highlight the caveat of using an intrinsic power law, rather than creating a continuum model from spectro-photometric modelling of the spectral energy distribution (SED), as power-law fits do not accurately represent the slopes of young stellar populations and nebular continuum emission. For the most extreme UV turnovers predicted in those models with substantial two-photon emission, this may overestimate NHI by up to 1 dex. However, as discussed in Section 4.1, we find no evidence of dominating nebular continuum emission, and for standard galaxy SEDs with mild to prominent Lyα emission, the uncertainty on the H I column density is only of the order ≲0.1 dex (Heintz et al. 2024).
3.3. Rest-frame UV properties
To put the derived local H I gas column densities in context, we here aim to characterise the ISM components and star formation properties of these galaxies; first estimating the dust extinction by calculating AV from spectro-photometric modelling of the SED. We used the code Bayesian Analysis of Galaxies for Physical Inference and Parameter EStimation (BAGPIPES, Carnall et al. 2018, 2019) to model the SEDs of galaxies using a non-parametric continuity star formation history (with priors as described in Leja et al. 2019). We defined a fixed grid of time steps in look-back time where the initial time bin edges are fixed at [0, 3, 10, 25, 50, 100] Myr, after which bin edges are equally spaced in logarithmic look-back time. We allowed a flexible dust curve (Salim et al. 2018), modified from Calzetti et al. (2000), which includes a 2175 Å UV dust bump B (prior Uniform(0, 5)), and δ power-law deviation from the Calzetti et al. (2000) attenuation curve slope (prior Gaussian(μ = 0, σ = 0.1)). An extra factor of η = 2 is applied to the SED-derived AV values when correcting emission line fluxes, to account for differences between nebular and stellar attenuation (Calzetti et al. 2000; Shivaei et al. 2020; Fisher et al. 2026). For the details on the SED-fitting, including star formation histories and flexible line fitting, we direct the reader to Gottumukkala et al. (in prep.).
The Balmer recombination lines can be used as a tracer of SFR, sensitive to the most massive O-type stars (M* > 10 M⊙), which contribute significant ionising flux over short lifetimes (≲20 Myr). These lines therefore provide an almost instantaneous measure of SFR (Kennicutt 1998). However, Hβ is only available for objects z ≲ 10, so we rely on UV-based SFRs to remain consistent across the full sample. UV-based SFRs are generally found to be lower, with studies finding typical values of SFRHα/SFRUV ∼ 1 − 5 (Kokorev et al. 2025; Roberts-Borsani et al. 2026; Heintz et al., in prep.), though potentially due to spectroscopic samples being biased towards galaxies with rising star formation histories (e.g. Tacchella et al. 2022). The overall UV luminosity is also regarded to be a good tracer, sensitive as well to stars of slightly lower masses, and is typically used to trace star formation over longer timescales ∼100 Myr, although at high-z it may trace substantially lower timescales (e.g. ∼25 Myr, McClymont et al. 2025). Before calculating the UV magnitude, we first photometrically corrected the spectra to account for slit-loss and other reduction issues. Following the process of Roberts-Borsani et al. (2026), we rescaled the spectra by a constant factor based on the photometric band closest to rest-frame wavelength 1750 Å, i.e. F277W for z > 13.5 and F200W for the remainder of the sample. The UV magnitude at 1500 Å was then determined from the corrected spectrum using a top hat filter of width 100 Å around 1500 Å and converted to a luminosity LUV, with dust, lensing, and K-correction. The SFR is then given by:
 (5)
(5)
This conversion assumes 10% solar metallicity (Madau & Dickinson 2014), and a Salpeter IMF. To determine the rest-frame UV sizes of each source, we either adopted the PSF-corrected values reported in individual references (see Table A.1) or calculated the implied half-light radius, RUV, from the measured size in a rest-UV adjacent JWST filter as provided through DJA (e.g. Valentino et al. 2023).
4. Galaxy assembly and star formation at z > 9
In this section, we present the main observational results. We focus on the connection between the dense H I gas reservoirs of these early galaxies to their assembly history, star formation, and dust and chemical enrichment.
4.1. The H I content of galaxies at z > 9
First, we consider the redshift evolution of the H I column density distribution in Figure 2. We find that the median H I column density is 1021.71 cm−2 at z = 9 − 10, 1022.24 cm−2 at z = 10 − 12, and 1022.37 cm−2 at z > 12. The medians should be treated conservatively as upper limits, as they are only calculated from the well-constrained DLA sample. The fraction of upper limits, or IGM-dominated galaxies in each redshift bin are 0.42, 0.50, and 0.29.
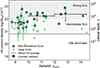 |
Fig. 2. Calculated column densities across the redshift range of the sample; dark green squares are well-constrained column densities with values NHI > 1021 cm−2. Upper limits are plotted as triangles, derived from the 95th percentile of the posterior distribution. The different shaded regions represent low column density (NHI < 1021 cm−2) where objects are likely IGM-dominated, high column densities (NHI > 1021 − 22 cm−2) where neutral hydrogen exceeds abundance from a fully neutral IGM, and very strong DLAs (NHI > 1022 cm−2) with an extreme over-abundance of neutral gas. Regardless of column density, all objects are optically thick with optical depths at the Lyman limit τ > 103, with the highest column densities NHI = 1022 cm−2 corresponding to optical depths τ ≈ 105. Medians of well-constrained column density binned in redshift (z < 10, 10 < z < 12, z > 12) are shown as black triangles (with values NHI = 1021.71, 1022.24, and 1022.37 cm−2 respectively). These are essentially upper limits, as the fraction of IGM-dominated galaxies/upper limits (which were not included in the median) in each bin is 0.42, 0.50, and 0.29 respectively. |
The sample overall displays a mostly bimodal distribution, with the majority of sources having high column densities NHI > 1021 cm−2, consistent with probing bulk ISM gas. This limit corresponds to an optical depth at the Lyman limit of τ ≳ 104, indicating that the gas is fully self-shielding from ionising photons. Sources with column densities below 1021 cm−2 are mostly unconstrained due to the low spectral resolution of the NIRSpec/PRISM configuration or difficult to disentangle from pure IGM contribution with xHI ≤ 1.0. For these objects we cannot conclusively determine the presence of local H I gas, so instead we mark the upper bounds on the derived column density, taken from the 95th percentile of the NHI posterior distribution. The observed H I column density distribution with redshift is largely consistent with previous inferences (Heintz et al. 2025a; Mason et al. 2026).
The broad H I column density distribution indicates complex geometry, implying that we are probing a large variation in sight-lines for the target galaxies, which only span a relatively limited range in UV magnitude (MUV = −16.4 to −21.9 mag) and stellar mass (log(M*/M⊙) = 7.1 to 9.4). This is consistent with expectations from the zoom-in SERRA simulations of galaxies z ∼ 6 − 9.5, where Gelli et al. (2025) find that the variation in column densities measured from a single galaxy can be large (0.5−1.5 dex) due to complex ISM morphologies. Gelli et al. (2025) also find that despite the fast-changing ISM and clumpy morphology of gas, the bulk of neutral gas is embedded within or close to the central star-forming regions, with minimal contribution from the CGM or filament inflows. We discuss further comparisons to these simulations in Section 4.2.
A potential, alternative scenario for the low observed column densities in part of the sources in our sample could be due to an ionised ‘bubble’ (Furlanetto et al. 2004; Hayes & Scarlata 2023). Galaxies with exceptionally powerful ionising photon production may be capable of creating an ionised bubble in their immediate surroundings, as proposed for JADES-GS-z13-1-LA, a Lyα emitter at z ≈ 13 (Witstok et al. 2025), or the most distant current known galaxy MoM-z14 at z ≈ 14.44, which does not display a prominent damping wing, with xHI likely to be < 1.0 (Naidu et al. 2026). Additionally, the presence of Lyα emission could contaminate the observed damping wing, which will not be resolvable with the low-resolution of PRISM (e.g. Huberty et al. 2025). This has been confirmed with GN-z11, where Lyα emission is observed in medium-resolution G140M spectra (Bunker et al. 2023), but undetected in the PRISM spectrum, resulting in a derived column density  , and an upper limit log(NHI/cm−2) < 21.0 (95th confidence level). We note, however, that the underlying H I column density could then be intrinsically higher for individual sources, but blended with strong Lyα emission in the PRISM spectra.
Next, we compare the derived H I column densities to the spectral slope, βUV, in Figure 3. This is mainly to investigate any potential correlations between the neutral gas column density and the potential dust content or the average age of the stellar population, both increasing with redder βUV. We do not observe any apparent trend between these two observables (Spearman correlation rank ρ ≈ 0.01), emphasising again the likely strong sightline-to-sightline variations in NHI. As a high nebular continuum contribution may result in two-photon emission being misinterpreted as a DLA (e.g. Cameron et al. 2024; Katz et al. 2025; Tacchella et al. 2025), we illustrate the region in Figure 3 with a grey-shaded band where this is mostly likely to occur. These values were obtained from Katz et al. (2025), simulating two-photon emission due to stars with temperature Teff = 50 000 − 100 000 K and density ne = 103 cm−3 at z = 9 and measuring the implied observed βUV and NHI. We have added an additional uncertainty ±0.3 dex to the inferred masquerading column densities, to account for observational uncertainties and difficulty in fitting the two-photon emission to a DLA model.
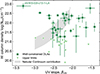 |
Fig. 3. Measured βUV slope and column density log(NHI/cm−2) for the galaxy sample. The green squares and triangles again represent the well-constrained and upper limits for column density respectively, with the grey shaded region representing possible high nebular continuum where two-photon emission may be masquerading as a DLA (Katz et al. 2025). |
We find ten galaxies with well-constrained H I column densities that lie within the potential nebular continuum region. However, other indications of strong nebular continuum emission (see e.g. Trussler et al. 2026; Cameron et al. 2024) are inconclusive: (1) None of the sample galaxies exhibit prominent Balmer jumps, even when stacked. Although with increasing temperature, the strength of the Balmer jump will decrease. (2) When the nebular continuum contribution is significant, the equivalent width (EW) of Hβ and [O III] should be large (Miranda et al. 2025). However, there are only 7 objects that meet the criteria in Miranda et al. (2025) and these do not overlap with the objects within the grey region. (3) Similarly, for the 4 galaxies in the full z > 9 sample with extreme ionising photon efficiency (ξion > 1026 Hz erg−1), the two populations do not overlap. Thus, while we cannot completely rule out the presence of two-photon emission in the sample, we argue that there are no strong indications for this effect, certainly for the majority of the sample. Consequently, we assume in the following analysis that the nebular continuum emission in the target galaxies are negligible, implying also that the estimated column densities are accurate within their measured uncertainties.
4.2. Comparison to simulations
We now attempt to place our observations into context of predictions from recent high-resolution zoom-in cosmological simulations. Specifically, we compare our results to the SERRA simulations (Pallottini et al. 2022), which has enabled a more direct comparison with the H I column densities for galaxies at similar mass and redshift as the sample studied here (Gelli et al. 2025). Firstly, we compare the histograms for two distributions in Figure 4, with the top and bottom panel showing the cumulative and ordinary histograms respectively. The shaded blue region represents the median column density for 50 galaxies in the SERRA simulations; averaged over 1000 random sight-lines extending radially from the brightest star-forming region. The grey shaded region shows all DLA-dominated galaxies from observations. The IGM-dominated galaxies with derived column densities NHI < 1021 cm−2 are represented by the light-green line in the bottom panel. Although extreme column densities (NHI < 1020.5 cm−2, NHI > 1022.5 cm−2) are possible in individual sight-lines in the simulations, they are rare. When averaged, there are no inferred column densities NHI < 1021 cm−2, and few galaxies showing NHI > 1022 cm−2 compared to the substantial amount seen in JWST data; especially at z > 10 (darkest green histogram). This suggests, as also noted by Gelli et al. (2025), that averaging over different pencil-beam sight-lines would be more accurate than how JWST spectroscopy collects light in an aperture, as this would be biased by clumpy distributions. Generally, the observed galaxy spectra will be dominated by emission and absorption from bright star-forming regions. In fact, the percentage of sight-lines which probes column densities > 1022 cm−2 is similar in both simulations and observations, around 30%.
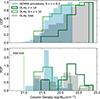 |
Fig. 4. Top: Cumulative histogram of derived column densities for our sample in shades of green: separated for non-DLAs (column densities < 1021 cm−2), and the DLA sample (column densities > 1021 cm−2) for z = 9 − 10 and z > 10. The full sample is shown as grey shaded region, comparing directly to the averages of SERRA-simulated galaxies z = 6 − 9.5 in blue (Gelli et al. 2025), showing that while the spread of observed DLAs is broadly consistent, there is a peak of extreme-DLAs (> 1022 cm−2) that are not represented in the averages of simulations, particularly for those z > 10. Bottom: Similar to top panel, but for a normalised PDF, along with the fraction of galaxies with unconstrained DLAs shown as an IGM limit. |
In Figure 5, we investigate any potential trends between the derived H I column densities and the observed UV magnitude. As MUV scales with halo mass Mh, and we would expect NHI to follow the virial radius trend; e.g.  , we expect a direct correlation. Indeed, the SERRA simulations recover a relation NHI ∝ Mh0.38 for the median NHI for each simulated galaxy, and the scatter of the overall distribution is shown as the filled grey contours in Fig. 5. The unfilled grey contour represents the approximate 1σ error region, based on the scatter on NHI for each galaxy. We convert the derived MUV magnitudes to halo masses, Mh, following the models from Mason et al. (2023, assuming no dust). While we find that the overall scatter in NHI for our observations are consistent with the simulations, we do not recover any strong evolutionary trend with MUV. If we take the expected local H I column densities from the estimated MUV or halo mass, we can infer the sources that are likely probing excess pristine gas as those significantly above the scatter, with a handful of such cases already visible in Fig. 5.
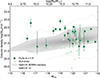 |
Fig. 5. Measured UV magnitude and column density. Halo masses for our objects are derived from UV magnitudes (Mason et al. 2023, no dust model). The well-constrained column densities of our sample are consistent with results from SERRA simulations (Gelli et al. 2025). The grey contours represent the average column density of 100 galaxies over random sight-lines, with the 1σ error region also shown, representing the scatter across sightlines in simulations. |
4.3. How pristine is the bulk H I gas in galaxies at z > 9?
There has been significant evidence that ultra-high redshift galaxies (z ≥ 8 − 9) are dust-poor (e.g. Castellano et al. 2022; Casey et al. 2023; Fujimoto et al. 2023; Carniani et al. 2025; Bakx et al. 2025). The so-called ‘Blue Monsters’ (Ziparo et al. 2023; Ferrara et al. 2025b) with slopes βUV < −2.7 seen at high-z are evidence for negligible dust-extinction (e.g. Bakx et al. 2023; Cullen et al. 2024; Roberts-Borsani et al. 2024; Rojas-Ruiz et al. 2026. However, the dust masses seen at z ∼ 6 from ALMA observations are large (Inami et al. 2022; Fisher et al. 2025; Watson et al. 2015; Algera et al. 2026; Bakx et al. 2025, though see Heintz et al. 2025c) and connecting the two populations requires a rapid build-up of dust in ∼500 Myr, which is a considerable theoretical challenge. Possible scenarios to explain the dearth of dust at high-z include: (i) grain growth is not yet very effective (Mitsuhashi et al. 2026), (ii) dust is destroyed or removed (Ferrara et al. 2023, 2025b), (iii) the grain-size distribution is different (Narayanan et al. 2025; Shivaei et al. 2025; McKinney et al. 2025), resulting in less dust obscuration in the UV. These observations are seemingly at odds with the dense H I gas reservoirs observed here, which require substantial extinction (AV ∼ 1 mag) for the given H I column density and inferred metallicity of the galaxies.
To investigate this in more detail, we here determine the visual extinction AV for each of the galaxy sight-lines using two approaches; We adopt the AV derived from the spectro-photometric SED fitting, which overall represents the total reddening of the stellar continuum. Then, we also determine upper bounds on the dust extinction in the line-of-sight by assuming a standard intrinsic slope of βUV = −3 (expected for the youngest stellar populations and is around the minimum of our sample; not including JADES-GS-z13-1-LA), and that any reddening is due to attenuation according to the steep SMC dust curve. It is not possible to derive the Balmer decrement for the majority of the sources, since Hβ is redshifted out of the NIRSpec coverage for part of the sample at z ∼ 10 and Hδ is normally very faint. Overall, we find that the βUV-derived AV’s are higher than the SED-derived values by on average 0.12 mag, as expected if the underlying spectral slope is redder than −3 due to a potential older stellar population, or contribution of nebular continuum. In the following analysis and results, we use the upper limits on AV inferred from βUV, but for any fluxes or properties corrected for dust-extinction we utilise the SED-derived AV values.
The dust-to-gas (DTG) ratio is an important property for understanding the ISM composition and the overall chemical enrichment of the target galaxies. Due to its correlation with metallicity (e.g. Zafar & Watson 2013; Heintz et al. 2023b) it reflects both dust grain growth and chemical evolution. Using the upper limits for dust extinction, we can calculate a proxy for the DTG ratio (AV/NHI) for our sample of well-constrained DLAs, and determine any potential evolution with redshift, see Figure 6. For comparison, the average values of AV/NHI for the Milky Way (Watson 2011), and the Large and Small Magellanic Clouds (LMC and SMC) (Gordon et al. 2003) are shown as well, along with AV/NHI ratios expected for 10%, 5%, and 1% solar metallicity. The majority of of the sample galaxies at z > 9 show DTG ratios well below the Milky Way value of 2.2 × 10⁻²¹ mag cm2, with a median DTG ratio of ∼2.2 × 10⁻²³ mag cm2, equivalent to ≈5% solar metallicity according lower-redshift scaling relations (e.g. Heintz et al. 2023b). While a small number of galaxies have been identified at z > 8 with metallicities of the order of a few percent solar (e.g. Cullen et al. 2025), the majority of galaxies with detectable emission lines show somewhat higher metallicities Z/Z⊙ ≳ 10% solar (Pollock et al. 2026; Hsiao et al. 2024a; Álvarez-Márquez et al. 2025).
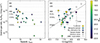 |
Fig. 6. Left: Upper limits for the dust-to-gas ratio AV/NHI against redshift, for the subsample of DLAs with NHI > 1021 cm−2. Here, AV are derived from the assumed reddening of the βUV slope, and so are taken to be upper limits. The majority of the sample are consistent with being dust-poor, lying below 10% solar metallicity. Right: The trend of AV/NHI against gas-phase metallicity 12+log(O/H), compared to values from the Milky Way, Large and Small Magellanic Clouds, and 10%, 5%, and 1% metallicities (metallicity for each represented with a star). The black line shows the relation for local galaxies and gamma-ray bursts (GRBs) (Heintz et al. 2023b). The method for calculating metallicity for each object is represented by different symbols; each still represents an upper limit in AV/NHI, and is colour-coded with lensing-corrected UV magnitude. |
In Figure 6, we also show the DTG ratio against the gas-phase metallicity (oxygen abundance; 12+log(O/H)) for the sample galaxies. The metallicities were calculated either with the direct method for those with high signal-to-noise detections of the [O III]λ4363 auroral line (Pollock et al. 2026), strong-line calibrations (z < 10 galaxies with Hβ detections) with R23, R2, R3, O32 and Ne3O2 from Sanders et al. (2025) and  from Laseter et al. (2024), or using the empirical 12 + log(O/H)−MUV relation (Pollock et al. 2026) for those with limited or no detection of UV and optical strong-lines. For comparison we plot the average DTG trend with metallicity for high redshift GRB sight-lines (Heintz et al. 2023b). We find that the DTG ratios derived for our sample generally correlate with the metallicity, noting that the median of our sample lies slightly below the expected relation though still within the 1σ scatter. We also find a potentially steeper DTG to metallicity relation, with in particular the most metal-poor systems (12 + log(O/H) < 8.0) generally being below the benchmark relation. This could suggest that the absorbing gas is more pristine than the central star-forming ISM (see also e.g. D’Eugenio et al. 2024; Heintz et al. 2025b) or that the dust production itself is inefficient. We note that most of the metal-poor systems are also those at z > 10, where 12+log(O/H) was derived using an empirical MUV-metallicity relation. It is possible that these objects have MUV which are biased high compared to their true metallicity, which could be expected if they were currently experiencing a strong starburst. If we remove all z > 10 galaxies from the sample, the median increases from 12 + log(O/H) = 7.53 → 7.64 and AV/NHI = 2.2 → 3.9 × 10⁻²³. These values are within 1σ of the previous medians, but would reconcile the observations to ∼10% solar as expected.
For comparison, Asano et al. (2013) determine the DTG ratio relative to metallicity for various gas depletion times, showing a steep increase in DTG ratio at a critical metallicity, which is higher if the star formation timescale is shorter. Given the shorter free-fall time expected for more compact high-z objects (see also discussion in Sect. 4.4 below), it is perhaps unsurprising that the values fall below the local GRB relation.
Further potential evidence for the pristine-gas inflow scenario is the observed offset from the FMR (12 + log(O/H) = log(M*)−αlog(SFR)); a scaling relation constructed to reduce scatter in the mass-metallicity relation (MZR) due to SFR (Mannucci et al. 2010; Maiolino & Mannucci 2019; Curti et al. 2020). There is a clear deviation from the FMR recovered at high-z, constrained both observationally (Heintz et al. 2023a; Nakajima et al. 2023; Curti et al. 2024; Langeroodi & Hjorth 2023; Pollock et al. 2026) and with simulations (McClymont et al. 2026). This has generally been attributed to chemical ‘dilution’ of the gas, from pristine gas inflows. It should be noted that the empirical relations (e.g. Curti et al. 2020; Andrews & Martini 2013) are extrapolated to the low-mass regime of high-z galaxies, and Laseter et al. (2025) show that even at z = 0, the FMR does not hold for low-mass systems M* < 109 M⊙. Although they find that the high-z galaxies are more offset from the FMR than low-z analogues at a fixed mass, they instead suggest that the offset at high-z is driven by star formation and enriched outflows.
To determine whether the abundant H I gas reservoirs probed from the DLAs can explain this potential offset, we compare the physical properties of the sample galaxies at z > 9 to the local FMR (Curti et al. 2020, with α = 0.56) to determine FMR offset Δ[O/H] and show that as a function of H I column density in Figure 7. We observe only a moderate trend, with a Spearman correlation coefficient ρ ≈ −0.4. Generally there is a large scatter, but we note that most of the high-column density objects are, on average, more offset from the FMR, even in relation to the median of z = 9 − 10 galaxies with metallicities calculated using the [O III]λ4363 auroral line (Pollock et al. 2026). We note that the metallicities of galaxies z > 10 here are calculated using an empirical MUV − 12 + log(O/H) relation. However, excluding these galaxies results in a marginal difference to the binned averages, from −0.58, −0.77 to −0.41, −0.77, which are well within 1σ. This suggests the galaxies with large neutral gas reservoirs are less enriched at a given SFR-normalised stellar mass. This would support the hypothesis of pristine H I gas diluting the ISM, though a larger sample is needed to robustly validate this trend.
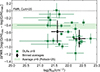 |
Fig. 7. Offset from the FMR (Curti et al. 2020) as a function of the H I column density for the sample of constrained DLAs. Binned averages for NHI = 1021 − 22 cm−2 and NHI > 1022 cm−2 are shown as black diamonds, with 1σ error bars. The average offset from metallicity measurements at z = 9 − 10 (Pollock et al. 2026) is shown in light green. There is only a moderate correlation, with Spearman rank ρ ≈ −0.4, however the strongest DLAs tend to show large offsets from the FMR, as would be expected from pristine gas inflow dilution. |
4.4. The Kennicutt-Schmidt relation at z > 9
Observations show that galaxies in the early universe have higher SFRs and SFR surface densities (ΣSFR) compared to local counterparts (e.g. Heintz et al. 2023a; Clarke et al. 2024; Mérida et al. 2026; Roberts-Borsani et al. 2026), reflecting either intrinsically higher star formation efficiencies (Fudamoto et al. 2025; Yung et al. 2025) or more bursty star formation histories (Endsley et al. 2025; Simmonds et al. 2025). In this section, we investigate the underlying origin of the luminous galaxies at z ≳ 9 in context to dense neutral gas reservoirs. Specifically, given that there is now mounting evidence for the DLAs tracing bulk ISM gas, we can directly determine the neutral gas surface density, ΣHI, integrated over the entire UV emitting area and compare to ΣSFR.
The connection between star formation and gas surface density was first proposed by Schmidt (1959) as a power law ΣSFR ∝ (Σgas)N, and later updated for larger samples of galaxies (Kennicutt 1998; Kennicutt & Evans 2012; Kennicutt & De Los Reyes 2021), the so-called Kennicutt-Schmidt (KS) law. The combination of more compact morphologies and higher SFRs in the early universe implies that high-z galaxies on average tend to have higher ΣSFR. Consequently, they should lie offset from the canonical KS relation, with higher SFR per unit area. Indeed, Kennicutt & De Los Reyes (2021) include a main sequence and starburst relation, with the latter relation showing both higher SFR and gas surface densities than the main sequence; consistent with shorter gas depletion times, with a median of 240 Myr compared to 3.2 Gyr for local spirals (Kennicutt 1998). Comparing the derived ΣSFR to Σgas for the sample galaxies at z > 9 thus directly informs the efficiency or typical gas depletion timescales in these young systems. This is particularly crucial, given that the KS relation is used in many assumptions in the galaxy formation field; mostly in simulations, and further provides the most direct constraints for the conditions under which the first generation of stars form.
We focus on the UV-derived SFRs, as we can uniformly measure them for the entire sample (Hβ is unavailable z ≳ 10.3) and adopt the rest-frame UV sizes as derived in Sect. 3. We define ΣSFR as:
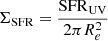 (6)
(6)
where Re is the half-light or ‘effective’ radius of the galaxy. We caution that for a subset of the sample, the sizes may be overestimated due to being smaller than the point-spread function (PSF) of the JWST/NIRCam images. This would effectively translate into higher ΣSFR for the target galaxies.
As the neutral hydrogen column density NHI represents the total integrated number of hydrogen atoms in the line of sight, it can be converted to an effective surface gas density ΣHI by a simple unit conversion:
 (7)
(7)
This conversion assumes that the derived column density represents the average volumetric density of the H I gas and that the line of sight is representative of the average across the whole galaxy (which might show large variations, as discussed in Sect. 4.2).
While the canonical KS relation describes the total gas surface density Σgas ≡ ΣHI + ΣH2, our measurements trace the neutral, atomic gas only. In the following, we assume that the bulk of gas present in the z > 9 galaxies is neutral. Since molecular hydrogen H2 typically forms on interstellar dust grains (Cazaux & Spaans 2009; Wakelam et al. 2017), its production will likely be inefficient in the observed low-metallicity, dust-poor environments. Intense UV-photons (Lyman-Werner feedback) will also increasingly photo-dissociate H2 (Nebrin et al. 2023; Sugimura et al. 2024), especially in low-metallicity environments. Additionally, it has been suggested that star formation can occur directly from atomic hydrogen, without a molecular gas phase if the metallicity is low (of the order of a few percent of solar abundances) (Krumholz 2012). Although we are not claiming that molecular gas in these systems is completely absent, given the age of the universe and the relatively low metallicities measured, we are approaching a regime where it is possible that recent Population III star formation may have dominated. The assumption that the majority of gas present in the high redshift galaxy population in its atomic, neutral form is thus physically motivated.
In Figure 8, we compare the derived Σgas and ΣSFR. As in the previous analysis, the ‘unconstrained’ galaxies, with Lyα damping wings consistent with IGM absorption only, are plotted as 95th percentile upper limits. Interestingly, the IGM-dominated objects do not follow the expected trend of the KS law, with similar, or even higher ΣSFR than the sources with strong DLAs. We plot the means of Σgas bins (101 − 102, and 102 − 103 M⊙ pc−2 respectively), both of which lie around the 10 Myr depletion timescale. The empirical KS relations are overlaid for comparison, showing the main sequence and starburst regimes (Kennicutt & De Los Reyes 2021), as well as the canonical KS law with different gas depletion times 0.1, 1, and 10 Gyr. Assuming a free-fall time (tff) of 108 years, typical for a Milky Way type galaxy, these depletion times would correspond to star formation efficiencies (SFE) ϵ = 100%, 10%, 1% respectively (Kennicutt 1998). However, as free-fall time scales with  ; denser and more compact high-z galaxies would consequently have a much lower tff, of the order of 1Myr for Σgas ≈ 103 M⊙ pc−2.
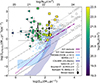 |
Fig. 8. Atomic KS relation of log(ΣHI) and log(ΣSFR), coloured with column density values. As previously, we plot non-constrained values as upper limits (95%). We compare to the canonical Kennicutt & De Los Reyes (2021) (K21) relations for starburst and main sequence galaxies, as well as various gas consumption depletion times corresponding to global star formation efficiency in grey (Kennicutt 1998, N = 1.0). All galaxies lie above the empirical law, with some scatter, and the low column density (non-DLA) objects are extremely offset, even when plotted as upper limits. The binned means for Σgas = 101 − 102, and 102 − 103 M⊙ pc−2 are shown as black diamonds, both consistent with ∼10 Myr. In shades of blue we compare to simulation predictions from THESAN-ZOOM at z = 10 − 12 (Shen et al. 2026; Kannan et al. 2025), SERRA at z = 7 (Pallottini et al. 2022), and H I-only gas surface density from COLIBRE at z = 8 (Lagos et al. 2026). Various literature measurements are shown in grey: from ALMA detections of [O III] 88 μm and [C II] 158 μm (Vallini et al. 2024) at z ≈ 7, CO-based measurements for starburst ULIRGs at z ∼ 0 (Bouché et al. 2007), and SMGs at z ∼ 2 (Bothwell et al. 2010; Tacconi et al. 2008). |
Simulation predictions for total ΣHI + H2 from THESAN-ZOOM at z = 10 − 12 (Kannan et al. 2025; Shen et al. 2026, light blue shaded region), and SERRA at z ≈ 7.7 (Pallottini et al. 2022, light blue scatter points) are shown in Figure 8 for comparison. The SERRA galaxies have high ΣSFR due to high SFR and small UV sizes, and are therefore also located above the local KS law. Pallottini et al. (2022) suggest this result is due to burstiness, with SERRA galaxies on average 3× more bursty than galaxies lying on the KS relation for the same Σgas (i.e. located above the KS relation by a factor κs = 3). We also show atomic-only ΣHI from the COLIBRE simulations at z = 8 (Lagos et al. 2026) in the dark blue shaded region, which show a similar range of gas densities though lower star formation rate densities; possibly due to a fixed efficiency per free-fall time of ϵff = 1%. Though there are galaxies in the COLIBRE simulations with H I depletion times of ∼100 Myr, they tend to be higher gas metallicity (though still sub-solar by 0.3 − 0.5 dex) and high ΣSFR objects. Shorter depletion times of 10 − 100 Myr are seen in COLIBRE, though only for H2 depletion time.
Finally, to put our results in context with galaxies across cosmic time, we consider various literature values across a wide redshift range including: Gas densities derived from ALMA detections of [O III]88 μm and [C II]158 μm from Vallini et al. (2024) at z ≈ 7, and CO-based measurements for starburst ULIRGs at z ∼ 0 (Bouché et al. 2007), and SMGs at z ∼ 2 (Bothwell et al. 2010; Tacconi et al. 2008). While these literature measurements are generally above the typical KS relation, with implied depletion times tdep ∼ 100 Myr, the DLA measurements for the sample galaxies at z > 9 are still systematically higher, indicating a likely transition in the conditions under which stars in galaxies at z > 9 form. Reconciling the observations with the canonical KS relation would imply an additional molecular or ‘hidden’ gas reservoir 300× more massive than the neutral gas present, which we consider unlikely, though note that some of the discrepancy could arise from Lyα emission contamination as described previously.
The star formation rate efficiency is defined as ϵ = tff/tdep, where tff is the free-fall time of the gas cloud,  and the depletion time defined as tdep ≡ Σgas/ΣSFR (Kennicutt 1998). For the sample galaxies with strong DLAs at z > 9, the mean free-fall time and depletion timescales are tff ≈ 25 Myr (corresponding to a particle density of n ∼ 0.03 cm−3) and tdep ∼ 28 Myr, respectively. This suggests a mean efficiency ϵ = 90%. This is extremely high, approaching the 100% efficiencies that are claimed to be necessary to explain the UV-bright population. Near-unity efficiencies have been produced in simulations with feedback-free systems (Somerville et al. 2025; Dekel et al. 2023; Boylan-Kolchin 2025), though it is currently debated whether feedback-free can exist in systems due to Lyα feedback (Manzoni & Ferrara 2025; Ferrara et al. 2025a; Nebrin et al. 2025). In this framework, 100% efficiency would require extreme surface densities ∼105 M⊙ pc−2 and near-solar metallicities. In summary, our results strongly imply efficient conversion of gas into stars in targeted objects at high redshift, either quantified as a rapid free-fall time due to the higher gas densities,
  , or the standard efficiency parameter reaching ϵ ≈ 90%.
4.5. Caveats
With an average efficiency of the sample reaching 90% and many individual galaxies exceeding unity efficiencies, we now summarise any possible biases, systematics, or caveats with our assumptions that may affect the interpretation of Figure 8.
-
Firstly, we measure UV SFRs over an assumed 108 year timescale. If the star formation is especially stochastic, or bursty (e.g. Sun et al. 2023) then the SFR we measure may not be representative of the system across 108 years, biasing us to higher ΣSFR. However, at high-z it has been suggested that the timescales would be closer to 25 Myr (McClymont et al. 2025). Should the effective timescale even decrease to 107 − 106 years, the offset in ΣSFR will be ∼0.2 − 1 dex lower (Madau & Dickinson 2014). However, we note that other measures of SFR, such as using Hβ luminosity (when available), [C III] luminosity (Heintz et al., in prep.), or SED-derived values on 10 or 100 Myr timescales result in similar, or higher ΣSFR.
-
Similarly, if the IMF is top-heavy, the true SFRs would be lower than the measured values (e.g. Hutter et al. 2025).
-
Accurately measuring the effective radii of the galaxies is perhaps the largest uncertainty in the work, as many of the galaxies are extremely compact and close to the resolution limit. If the full sample had physical sizes ∼10× larger, the mean log(ΣSFR) would be ∼2 dex lower, more in line with the starburst regime from Kennicutt & De Los Reyes (2021). However, we note that for many of the galaxies, the true size is more likely to be smaller than the measured size (due to being smaller than the resolution limit), resulting in higher ΣSFR.
-
With the PRISM spectra we could be missing contamination from Lyα emission blended with a damping wing. This could result in an apparent steep drop-off (i.e. GN-z11’s PRISM spectrum) which would result in a lower constrained column density. This depends on a non-zero covering fraction, but may be biasing particularly the ‘unconstrained DLAs’ to lower Σgas.
-
The large observed range in the column densities are likely biased by the geometry of these systems. We are assuming a screen-like distribution when converting the column density to surface gas density, assuming the distribution of gas is roughly the size of the UV region (i.e. with a covering fraction fc = 1). If there are high column densities of gas extending outwith this region (i.e. suggested by Rowland et al. 2025) our gas densities are biased too low. Additionally, if the gas is instead clumpy or patchy, the derived NHI should be interpreted as a UV-luminosity-weighted column density, and the true area-averaged Σgas would be larger according to the covering fraction, ∼1/fc.
-
Due to selection effects, we are more likely to observe highly star-forming galaxies at high-z, which must require large gas supplies, potentially biasing our sample towards objects with higher NHI. As we require robust spectroscopic redshifts for the DLA fitting, and we use only grade = 3 redshifts from DJA, the majority of our sample (41/48) have nebular emission line detections. Our sample is therefore also likely biased to strong line emitters, which may be currently undergoing starbursts. These objects could be representing a population that has greater ΣSFR and therefore efficiency than non-line emitters which are not observed.
-
As mentioned previously, we would need on average ∼300× more hidden or molecular gas for the current observations to lie on the starburst Kennicutt & De Los Reyes (2021) relation. There indeed must be some molecular gas present in these systems, though we believe not of the order of 100 − 1000× the inferred neutral gas.
While it is unlikely that any of these effects alone are able to explain the discrepancy, it is possible that invoking a few simultaneously could decrease the offset. Taking into consideration each of the caveats listed above, it is possible that the current observed tension with the local KS relation is not due to low-dust and increased star formation efficiency, but a combination of bursty star formation, top-heavy IMF, larger UV sizes, low covering fractions, or exceptionally high molecular gas content.
5. Summary and future outlook
In this work, we have performed a careful analysis of the Lyα damping wings observed in the total compiled sample of 48 UV-bright galaxies at z > 9, near the expected onset of cosmic reionisation. All galaxies have been observed with JWST/NIRSpec in the PRISM configuration from various observing programmes, and reduced uniformly through the optimised DJA framework. The main goal was to measure the local H I gas producing strong damping wings. This was crucial to investigate the H I gas mass build-up in these early galaxies, and determine its role in governing the observed chemical enrichment, dust properties, and star formation rate densities. We then compared the neutral gas surface densities ΣHI integrated over the UV-emitting region as probed via NHI to the effective ΣSFR, to gauge the efficiency of the observed star formation.
Our main findings are summarised below:
-
The majority of the sample galaxies show prominent DLAs, reaching column densities NHI ≳ 1022.5 cm−2. We highlight the minority subsample of ‘DLA-free’ objects at z > 9, which are of potential interest for Lyα follow-up surveys with higher resolution spectra, since the steepness of the Lyα wings might reflect Lyα emission that is unresolved in the PRISM resolution.
-
The overall H I column density distribution was found to be in good agreement with predictions from simulated galaxies at z ≳ 8 from the SERRA suite of zoom-in high-resolution cosmological simulations, also considering their absolute magnitudes MUV and inferred halo masses, though with a larger fraction of high column density systems at z > 10. This indicated that the gas probed by DLAs are likely already driving the central star formation in the targeted galaxies.
-
We found that the DTG ratios, AV/NHI, were in good agreement with lower-redshift empirical relations based on their metallicities, though we noted a potential decrease in AV/NHI in the most metal-poor systems, with 12 + log(O/H) < 8.0. Higher resolution spectroscopy is, however, needed to robustly constrain the metal content of the foreground DLA gas via low-ionisation metal lines as commonly done for GRB or quasar absorption line systems.
-
We further tested the proposed scenario of the abundant neutral gas causing the deviation in the FMR towards lower metallicities by comparing the offset directly to the derived H I column densities. We indeed found a trend for the sources with the lowest metallicities at a given stellar mass and SFR to show the highest NHI at z > 9, though still with a substantial scatter.
-
We found that all the sample galaxies at z > 9 were offset from the canonical KS relation, with most having depletion times well below 100 Myr, implying highly efficient and rapid star formation from the available gas. The derived Σgas were found to be consistent with predictions from state-of-the-art cosmological simulations, though none of them reaching the ΣSFR observed here. These deviations from the local KS relation and the more rapid gas depletion times are critical to incorporate into future simulations to understand the conditions under which the first stars and galaxies form. For future avenues, we strongly emphasise the need higher-resolution JWST grating spectroscopy to better constrain the presence of Lyα emission, the Lyα damping wings to disentangle H I in the IGM from local galaxy contributions, and measure the metallicities of the absorbing gas from low-ion metal absorption lines directly. This will greatly advance our understanding of the early assembly and formation of stars and galaxies, and their impact on the large-scale reionisation of the Universe.
Acknowledgments
We would like to thank the anonymous referee for their constructive report which improved the presentation of the results in this work. The data products presented herein were retrieved from the Dawn JWST Archive (DJA). DJA is an initiative of the Cosmic Dawn Center, which is funded by the Danish National Research Foundation under grant DNRF140. We express our greatest gratitude to the investigators on the major JWST observing programmes, such as RUBIES, CEERS, CAPERS, UNCOVER, and JADES. The work presented here would not have been possible without their major efforts in designing and obtaining the observational data included in our work here. KEH acknowledges support from the Independent Research Fund Denmark (DFF) under grant 5251-00009B and co-funding by the European Union (ERC, HEAVYMETAL, 101071865). Views and opinions expressed are, however, those of the authors only and do not necessarily reflect those of the European Union or the European Research Council. Neither the European Union nor the granting authority can be held responsible for them. P. Dayal warmly acknowledges support from an NSERC discovery grant (RGPIN-2025-06182). JRW acknowledges that support for this work was provided by The Brinson Foundation through a Brinson Prize Fellowship grant. This work is based in part on observations made with the NASA/ESA/CSA James Webb Space Telescope. The data were obtained from the Mikulski Archive for Space Telescopes (MAST) at the Space Telescope Science Institute, which is operated by the Association of Universities for Research in Astronomy, Inc., under NASA contract NAS 5-03127 for JWST. This work has received funding from the Swiss State Secretariat for Education, Research and Innovation (SERI) under contract number MB22.00072, as well as from the Swiss National Science Foundation (SNSF) through project grant 200020_207349. Software used in this work includes MATPLOTLIB (Hunter 2007), NUMPY (Harris et al. 2020), ASTROPY (Astropy Collaboration 2013), SCIPY (Virtanen et al. 2020), PANDAS (The pandas development team 2020), and PYNEB (Luridiana et al. 2015).
References
- Adams, N. J., Conselice, C. J., Austin, D., et al. 2024, ApJ, 965, 169 [NASA ADS] [CrossRef] [Google Scholar]
- Algera, H. S. B., Rowland, L., Stefanon, M., et al. 2026, MNRAS, 545, staf1897 [Google Scholar]
- Álvarez-Márquez, J., Crespo Gómez, A., Colina, L., et al. 2025, A&A, 695, A250 [NASA ADS] [CrossRef] [EDP Sciences] [Google Scholar]
- Andrews, B. H., & Martini, P. 2013, ApJ, 765, 140 [NASA ADS] [CrossRef] [Google Scholar]
- Arrabal Haro, P., Dickinson, M., Finkelstein, S. L., et al. 2023, Nature, 622, 707 [NASA ADS] [CrossRef] [Google Scholar]
- Asada, Y., Desprez, G., Willott, C. J., et al. 2025, ApJ, 983, L2 [Google Scholar]
- Asano, R. S., Takeuchi, T. T., Hirashita, H., & Inoue, A. K. 2013, Earth Planets Space, 65, 213 [NASA ADS] [CrossRef] [Google Scholar]
- Asplund, M., Grevesse, N., Sauval, A. J., & Scott, P. 2009, ARA&A, 47, 481 [NASA ADS] [CrossRef] [Google Scholar]
- Astropy Collaboration (Robitaille, T. P., et al.) 2013, A&A, 558, A33 [NASA ADS] [CrossRef] [EDP Sciences] [Google Scholar]
- Atek, H., Chemerynska, I., Wang, B., et al. 2023, MNRAS, 524, 5486 [NASA ADS] [CrossRef] [Google Scholar]
- Bakx, T. J. L. C., Zavala, J. A., Mitsuhashi, I., et al. 2023, MNRAS, 519, 5076 [NASA ADS] [CrossRef] [Google Scholar]
- Bakx, T. J. L. C., Algera, H. S. B., Jolly, J. B., et al. 2025, MNRAS, 546, staf2284 [Google Scholar]
- Bezanson, R., Labbe, I., Whitaker, K. E., et al. 2024, ApJ, 974, 92 [NASA ADS] [CrossRef] [Google Scholar]
- Bosman, S. E. I., Davies, F. B., Becker, G. D., et al. 2022, MNRAS, 514, 55 [NASA ADS] [CrossRef] [Google Scholar]
- Bothwell, M. S., Chapman, S. C., Tacconi, L., et al. 2010, MNRAS, 405, 219 [NASA ADS] [Google Scholar]
- Bouché, N., Cresci, G., Davies, R., et al. 2007, ApJ, 671, 303 [Google Scholar]
- Bouwens, R. J., Stefanon, M., Brammer, G., et al. 2023, MNRAS, 523, 1036 [NASA ADS] [CrossRef] [Google Scholar]
- Boyett, K., Bunker, A. J., Curtis-Lake, E., et al. 2024a, MNRAS, 535, 1796 [NASA ADS] [CrossRef] [Google Scholar]
- Boyett, K., Trenti, M., Leethochawalit, N., et al. 2024b, Nat. Astron., 8, 657 [CrossRef] [Google Scholar]
- Boylan-Kolchin, M. 2025, MNRAS, 538, 3210 [Google Scholar]
- Brammer, G., & Valentino, F. 2025, https://doi.org/10.5281/zenodo.15472354 [Google Scholar]
- Bunker, A. J., Saxena, A., Cameron, A. J., et al. 2023, A&A, 677, A88 [NASA ADS] [CrossRef] [EDP Sciences] [Google Scholar]
- Bunker, A. J., Cameron, A. J., Curtis-Lake, E., et al. 2024, A&A, 690, A288 [NASA ADS] [CrossRef] [EDP Sciences] [Google Scholar]
- Calabrò, A., Pentericci, L., Santini, P., et al. 2024, A&A, 690, A290 [NASA ADS] [CrossRef] [EDP Sciences] [Google Scholar]
- Calzetti, D., Armus, L., Bohlin, R. C., et al. 2000, ApJ, 533, 682 [NASA ADS] [CrossRef] [Google Scholar]
- Cameron, A. J., Katz, H., Rey, M. P., & Saxena, A. 2023a, MNRAS, 523, 3516 [NASA ADS] [CrossRef] [Google Scholar]
- Cameron, A. J., Saxena, A., Bunker, A. J., et al. 2023b, A&A, 677, A115 [NASA ADS] [CrossRef] [EDP Sciences] [Google Scholar]
- Cameron, A. J., Katz, H., Witten, C., et al. 2024, MNRAS, 534, 523 [NASA ADS] [CrossRef] [Google Scholar]
- Carnall, A. C., McLure, R. J., Dunlop, J. S., & Davé, R. 2018, MNRAS, 480, 4379 [Google Scholar]
- Carnall, A. C., McLure, R. J., Dunlop, J. S., et al. 2019, MNRAS, 490, 417 [Google Scholar]
- Carniani, S., Hainline, K., D’Eugenio, F., et al. 2024, Nature, 633, 318 [CrossRef] [Google Scholar]
- Carniani, S., D’Eugenio, F., Ji, X., et al. 2025, A&A, 696, A87 [NASA ADS] [CrossRef] [EDP Sciences] [Google Scholar]
- Casey, C. M., Kartaltepe, J. S., Drakos, N. E., et al. 2023, ApJ, 954, 31 [NASA ADS] [CrossRef] [Google Scholar]
- Castellano, M., Fontana, A., Treu, T., et al. 2022, ApJ, 938, L15 [NASA ADS] [CrossRef] [Google Scholar]
- Cazaux, S., & Spaans, M. 2009, A&A, 496, 365 [NASA ADS] [CrossRef] [EDP Sciences] [Google Scholar]
- Chen, H. 2024, MNRAS, 528, L33 [Google Scholar]
- Clarke, L., Shapley, A. E., Sanders, R. L., et al. 2024, ApJ, 977, 133 [NASA ADS] [CrossRef] [Google Scholar]
- Cohon, J., Cain, C., Windhorst, R., et al. 2026, PASA, 43, e046 [Google Scholar]
- Cueto, E. R., Hutter, A., Dayal, P., et al. 2024, A&A, 686, A138 [NASA ADS] [CrossRef] [EDP Sciences] [Google Scholar]
- Cullen, F., McLeod, D. J., McLure, R. J., et al. 2024, MNRAS, 531, 997 [NASA ADS] [CrossRef] [Google Scholar]
- Cullen, F., Carnall, A. C., Scholte, D., et al. 2025, MNRAS, 540, 2176 [Google Scholar]
- Curti, M., Mannucci, F., Cresci, G., & Maiolino, R. 2020, MNRAS, 491, 944 [Google Scholar]
- Curti, M., Maiolino, R., Curtis-Lake, E., et al. 2024, A&A, 684, A75 [NASA ADS] [CrossRef] [EDP Sciences] [Google Scholar]
- Curti, M., Witstok, J., Jakobsen, P., et al. 2025, A&A, 697, A89 [Google Scholar]
- Curtis-Lake, E., Carniani, S., Cameron, A., et al. 2023, Nat. Astron., 7, 622 [NASA ADS] [CrossRef] [Google Scholar]
- Dayal, P., & Ferrara, A. 2018, Phys. Rep., 780, 1 [Google Scholar]
- de Graaff, A., Brammer, G., Weibel, A., et al. 2025, A&A, 697, A189 [NASA ADS] [CrossRef] [EDP Sciences] [Google Scholar]
- Dekel, A., Birnboim, Y., Engel, G., et al. 2009, Nature, 457, 451 [Google Scholar]
- Dekel, A., Sarkar, K. C., Birnboim, Y., Mandelker, N., & Li, Z. 2023, MNRAS, 523, 3201 [NASA ADS] [CrossRef] [Google Scholar]
- D’Eugenio, F., Maiolino, R., Carniani, S., et al. 2024, A&A, 689, A152 [NASA ADS] [CrossRef] [EDP Sciences] [Google Scholar]
- Donnan, C. T., McLeod, D. J., Dunlop, J. S., et al. 2023, MNRAS, 518, 6011 [Google Scholar]
- Donnan, C. T., Dickinson, M., Taylor, A. J., et al. 2025, ApJ, 993, 224 [Google Scholar]
- Eisenstein, D. J., Johnson, B. D., Robertson, B., et al. 2025, ApJS, 281, 50 [Google Scholar]
- Endsley, R., Chisholm, J., Stark, D. P., Topping, M. W., & Whitler, L. 2025, ApJ, 987, 189 [Google Scholar]
- Fan, X., Strauss, M. A., Becker, R. H., et al. 2006, AJ, 132, 117 [NASA ADS] [CrossRef] [Google Scholar]
- Ferrara, A. 2024a, A&A, 684, A207 [NASA ADS] [CrossRef] [EDP Sciences] [Google Scholar]
- Ferrara, A. 2024b, A&A, 689, A310 [NASA ADS] [CrossRef] [EDP Sciences] [Google Scholar]
- Ferrara, A., Pallottini, A., & Dayal, P. 2023, MNRAS, 522, 3986 [NASA ADS] [CrossRef] [Google Scholar]
- Ferrara, A., Manzoni, D., & Ntormousi, E. 2025a, Open J. Astrophys., 8, 140 [Google Scholar]
- Ferrara, A., Pallottini, A., & Sommovigo, L. 2025b, A&A, 694, A286 [NASA ADS] [CrossRef] [EDP Sciences] [Google Scholar]
- Finkelstein, S. L., Bagley, M. B., Ferguson, H. C., et al. 2023, ApJ, 946, L13 [NASA ADS] [CrossRef] [Google Scholar]
- Finkelstein, S. L., Leung, G. C. K., Bagley, M. B., et al. 2024, ApJ, 969, L2 [NASA ADS] [CrossRef] [Google Scholar]
- Fisher, R., Bowler, R. A. A., Stefanon, M., et al. 2025, MNRAS, 539, 109 [Google Scholar]
- Fisher, R., Bowler, R. A. A., Cochrane, R. K., et al. 2026, MNRAS, 546, stag049 [Google Scholar]
- Fudamoto, Y., Nakazato, Y., Ceverino, D., et al. 2025, ArXiv e-prints [arXiv:2510.11770] [Google Scholar]
- Fujimoto, S., Finkelstein, S. L., Burgarella, D., et al. 2023, ApJ, 955, 130 [NASA ADS] [CrossRef] [Google Scholar]
- Fujimoto, S., Wang, B., Weaver, J. R., et al. 2024, ApJ, 977, 250 [NASA ADS] [CrossRef] [Google Scholar]
- Furlanetto, S. R., Hernquist, L., & Zaldarriaga, M. 2004, MNRAS, 354, 695 [Google Scholar]
- Fynbo, J. P. U., Jakobsson, P., Prochaska, J. X., et al. 2009, ApJS, 185, 526 [NASA ADS] [CrossRef] [Google Scholar]
- Gelli, V., Mason, C., & Hayward, C. C. 2024, ApJ, 975, 192 [NASA ADS] [CrossRef] [Google Scholar]
- Gelli, V., Mason, C., Pallottini, A., et al. 2025, ArXiv e-prints [arXiv:2510.01315] [Google Scholar]
- Gordon, K. D., Clayton, G. C., Misselt, K. A., Landolt, A. U., & Wolff, M. J. 2003, ApJ, 594, 279 [NASA ADS] [CrossRef] [Google Scholar]
- Hainline, K. N., D’Eugenio, F., Jakobsen, P., et al. 2024a, ApJ, 976, 160 [NASA ADS] [CrossRef] [Google Scholar]
- Hainline, K. N., Johnson, B. D., Robertson, B., et al. 2024b, ApJ, 964, 71 [CrossRef] [Google Scholar]
- Harikane, Y., Ouchi, M., Oguri, M., et al. 2023, ApJS, 265, 5 [NASA ADS] [CrossRef] [Google Scholar]
- Harikane, Y., Nakajima, K., Ouchi, M., et al. 2024, ApJ, 960, 56 [NASA ADS] [CrossRef] [Google Scholar]
- Harikane, Y., Perez-Gonzalez, P. G., Alvarez-Marquez, J., et al. 2026, ArXiv e-prints [arXiv:2601.21833] [Google Scholar]
- Harris, C. R., Millman, K. J., van der Walt, S. J., et al. 2020, Nature, 585, 357 [NASA ADS] [CrossRef] [Google Scholar]
- Hayes, M. J., & Scarlata, C. 2023, ApJ, 954, L14 [NASA ADS] [CrossRef] [Google Scholar]
- Hayes, M. J., Saldana-Lopez, A., Citro, A., et al. 2025, ApJ, 982, 14 [Google Scholar]
- Heintz, K. E., Brammer, G. B., Giménez-Arteaga, C., et al. 2023a, Nat. Astron., 7, 1517 [NASA ADS] [CrossRef] [Google Scholar]
- Heintz, K. E., De Cia, A., Thöne, C. C., et al. 2023b, A&A, 679, A91 [NASA ADS] [CrossRef] [EDP Sciences] [Google Scholar]
- Heintz, K. E., Watson, D., Brammer, G., et al. 2024, Science, 384, 890 [NASA ADS] [CrossRef] [Google Scholar]
- Heintz, K. E., Brammer, G. B., Watson, D., et al. 2025a, A&A, 693, A60 [Google Scholar]
- Heintz, K. E., Pollock, C. L., Witstok, J., et al. 2025b, ApJ, 987, L2 [Google Scholar]
- Heintz, K. E., Watson, D., Valentino, F., et al. 2025c, ArXiv e-prints [arXiv:2510.07936] [Google Scholar]
- Heintz, K. E., Bennett, J. S., Oesch, P. A., et al. 2026, Nat. Astron., 10, 448 [Google Scholar]
- Helton, J. M., Rieke, G. H., Alberts, S., et al. 2025, Nat. Astron., 9, 729 [Google Scholar]
- Hsiao, T. Y.-Y., Abdurro’uf, Coe, D., et al. 2024a, ApJ, 973, 8 [NASA ADS] [CrossRef] [Google Scholar]
- Hsiao, T. Y.-Y., Álvarez-Márquez, J., Coe, D., et al. 2024b, ApJ, 973, 81 [NASA ADS] [CrossRef] [Google Scholar]
- Huberty, M., Scarlata, C., Hayes, M. J., & Gazagnes, S. 2025, ApJ, 987, 82 [Google Scholar]
- Hunter, J. D. 2007, Comput. Sci. Eng., 9, 90 [NASA ADS] [CrossRef] [Google Scholar]
- Hutter, A., Cueto, E. R., Dayal, P., et al. 2025, A&A, 694, A254 [NASA ADS] [CrossRef] [EDP Sciences] [Google Scholar]
- Inami, H., Algera, H. S. B., Schouws, S., et al. 2022, MNRAS, 515, 3126 [NASA ADS] [CrossRef] [Google Scholar]
- Jakobsen, P., Ferruit, P., Alves de Oliveira, C., et al. 2022, A&A, 661, A80 [NASA ADS] [CrossRef] [EDP Sciences] [Google Scholar]
- Kannan, R., Puchwein, E., Smith, A., et al. 2025, Open J. Astrophys., 8, 153 [Google Scholar]
- Katz, H., Cameron, A. J., Saxena, A., et al. 2025, Open J. Astrophys., 8, 104 [Google Scholar]
- Kennicutt, R. C. 1998, ARA&A, 36, 189 [NASA ADS] [CrossRef] [Google Scholar]
- Kennicutt, R. C., & De Los Reyes, M. A. C. 2021, ApJ, 908, 61 [NASA ADS] [CrossRef] [Google Scholar]
- Kennicutt, R. C., & Evans, N. J. 2012, ARA&A, 50, 531 [NASA ADS] [CrossRef] [Google Scholar]
- Kereš, D., Katz, N., Weinberg, D. H., & Davé, R. 2005, MNRAS, 363, 2 [Google Scholar]
- Kokorev, V., Chávez Ortiz, Ó. A., Taylor, A. J., et al. 2025, ApJ, 988, L10 [Google Scholar]
- Krumholz, M. R. 2012, ApJ, 759, 9 [NASA ADS] [CrossRef] [Google Scholar]
- Lagos, C. D. P., Schaye, J., Schaller, M., et al. 2026, MNRAS, 549, stag947 [Google Scholar]
- Langeroodi, D., & Hjorth, J. 2023, ArXiv e-prints [arXiv:2307.06336] [Google Scholar]
- Laseter, I. H., Maseda, M. V., Curti, M., et al. 2024, A&A, 681, A70 [NASA ADS] [CrossRef] [EDP Sciences] [Google Scholar]
- Laseter, I. H., Maseda, M. V., Bunker, A. J., et al. 2025, ArXiv e-prints [arXiv:2510.15024] [Google Scholar]
- Leja, J., Carnall, A. C., Johnson, B. D., Conroy, C., & Speagle, J. S. 2019, ApJ, 876, 3 [Google Scholar]
- Luridiana, V., Morisset, C., & Shaw, R. A. 2015, A&A, 573, A42 [NASA ADS] [CrossRef] [EDP Sciences] [Google Scholar]
- Madau, P., & Dickinson, M. 2014, ARA&A, 52, 415 [Google Scholar]
- Maiolino, R., & Mannucci, F. 2019, A&ARv, 27, 3 [Google Scholar]
- Maiolino, R., Übler, H., Perna, M., et al. 2024, A&A, 687, A67 [NASA ADS] [CrossRef] [EDP Sciences] [Google Scholar]
- Mannucci, F., Cresci, G., Maiolino, R., Marconi, A., & Gnerucci, A. 2010, MNRAS, 408, 2115 [NASA ADS] [CrossRef] [Google Scholar]
- Manzoni, D., & Ferrara, A. 2025, A&A, 704, L12 [NASA ADS] [CrossRef] [EDP Sciences] [Google Scholar]
- Marques-Chaves, R., Álvarez-Márquez, J., Colina, L., et al. 2026, ArXiv e-prints [arXiv:2602.02322] [Google Scholar]
- Mason, C. A., Trenti, M., & Treu, T. 2023, MNRAS, 521, 497 [NASA ADS] [CrossRef] [Google Scholar]
- Mason, C. A., Chen, Z., Stark, D. P., et al. 2026, A&A, 705, A114 [NASA ADS] [CrossRef] [EDP Sciences] [Google Scholar]
- Mauerhofer, V., Dayal, P., Haehnelt, M. G., et al. 2025, A&A, 696, A157 [NASA ADS] [CrossRef] [EDP Sciences] [Google Scholar]
- McClymont, W., Tacchella, S., Smith, A., et al. 2025, MNRAS, 544, 513 [Google Scholar]
- McClymont, W., Tacchella, S., Smith, A., et al. 2026, MNRAS, 548, stag016 [Google Scholar]
- McKinney, J., Cooper, O. R., Casey, C. M., et al. 2025, ApJ, 985, L21 [Google Scholar]
- McLeod, D. J., Donnan, C. T., McLure, R. J., et al. 2024, MNRAS, 527, 5004 [Google Scholar]
- Menon, S. H., Lancaster, L., Burkhart, B., et al. 2024, ApJ, 967, L28 [NASA ADS] [CrossRef] [Google Scholar]
- Mérida, R. M., Sawicki, M., Iyer, K. G., et al. 2026, A&A, 707, A5 [NASA ADS] [CrossRef] [EDP Sciences] [Google Scholar]
- Miralda-Escudé, J. 1998, ApJ, 501, 15 [CrossRef] [Google Scholar]
- Miranda, H., Pappalardo, C., Afonso, J., et al. 2025, A&A, 694, A102 [NASA ADS] [CrossRef] [EDP Sciences] [Google Scholar]
- Mitsuhashi, I., Zavala, J. A., Bakx, T. J. L. C., et al. 2026, ApJ, 1000, 159 [Google Scholar]
- Naidu, R. P., Oesch, P. A., Setton, D. J., et al. 2022, ArXiv e-prints [arXiv:2208.02794] [Google Scholar]
- Naidu, R. P., Oesch, P. A., Brammer, G., et al. 2026, Open J. Astrophys., 9, 56033 [Google Scholar]
- Nakajima, K., Ouchi, M., Isobe, Y., et al. 2023, ApJS, 269, 33 [NASA ADS] [CrossRef] [Google Scholar]
- Nakane, M., Ouchi, M., Nakajima, K., et al. 2025, ApJ, 994, 65 [Google Scholar]
- Napolitano, L., Pentericci, L., Santini, P., et al. 2024, A&A, 688, A106 [NASA ADS] [CrossRef] [EDP Sciences] [Google Scholar]
- Napolitano, L., Castellano, M., Pentericci, L., et al. 2025, A&A, 693, A50 [NASA ADS] [CrossRef] [EDP Sciences] [Google Scholar]
- Narayanan, D., Stark, D. P., Finkelstein, S. L., et al. 2025, ApJ, 982, 7 [Google Scholar]
- Nebrin, O., Giri, S. K., & Mellema, G. 2023, MNRAS, 524, 2290 [Google Scholar]
- Nebrin, O., Smith, A., Lorinc, K., et al. 2025, MNRAS, 537, 1646 [Google Scholar]
- Oesch, P. A., Brammer, G., van Dokkum, P. G., et al. 2016, ApJ, 819, 129 [NASA ADS] [CrossRef] [Google Scholar]
- Ono, Y., Harikane, Y., Ouchi, M., et al. 2023, ApJ, 951, 72 [NASA ADS] [CrossRef] [Google Scholar]
- Pallottini, A., Ferrara, A., Gallerani, S., et al. 2022, MNRAS, 513, 5621 [NASA ADS] [Google Scholar]
- Planck Collaboration VI. 2020, A&A, 641, A6 [NASA ADS] [CrossRef] [EDP Sciences] [Google Scholar]
- Pollock, C. L., Gottumukkala, R., Heintz, K. E., et al. 2026, A&A, 708, A203 [NASA ADS] [CrossRef] [EDP Sciences] [Google Scholar]
- Prochaska, J. X., Chen, H.-W., Dessauges-Zavadsky, M., & Bloom, J. S. 2007, ApJ, 666, 267 [NASA ADS] [CrossRef] [Google Scholar]
- Qin, Y., & Wyithe, J. S. B. 2025, MNRAS, 538, L16 [Google Scholar]
- Roberts-Borsani, G., Treu, T., Chen, W., et al. 2023, Nature, 618, 480 [NASA ADS] [CrossRef] [Google Scholar]
- Roberts-Borsani, G., Treu, T., Shapley, A., et al. 2024, ApJ, 976, 193 [NASA ADS] [CrossRef] [Google Scholar]
- Roberts-Borsani, G., Oesch, P. A., Ellis, R., et al. 2026, MNRAS, 548, stag701 [Google Scholar]
- Robertson, B., Johnson, B. D., Tacchella, S., et al. 2024, ApJ, 970, 31 [NASA ADS] [CrossRef] [Google Scholar]
- Rojas-Ruiz, S., Roberts-Borsani, G., Morishita, T., et al. 2026, ApJ, 1000, 285 [Google Scholar]
- Rowland, L. E., Heintz, K. E., Algera, H., et al. 2025, ArXiv e-prints [arXiv:2510.11351] [Google Scholar]
- Sailer, N., Farren, G. S., Ferraro, S., & White, M. 2026, Phys. Rev. Lett., 136, 081002 [Google Scholar]
- Salim, S., Boquien, M., & Lee, J. C. 2018, ApJ, 859, 11 [Google Scholar]
- Sanders, R. L., Shapley, A. E., Topping, M. W., et al. 2025, ArXiv e-prints [arXiv:2508.10099] [Google Scholar]
- Schaerer, D., Marques-Chaves, R., Xiao, M., & Korber, D. 2024, A&A, 687, L11 [NASA ADS] [CrossRef] [EDP Sciences] [Google Scholar]
- Schaye, J., Dalla Vecchia, C., Booth, C. M., et al. 2010, MNRAS, 402, 1536 [Google Scholar]
- Schmidt, M. 1959, ApJ, 129, 243 [NASA ADS] [CrossRef] [Google Scholar]
- Scholtz, J., Parlanti, E., Carniani, S., et al. 2025, MNRAS, 544, L113 [Google Scholar]
- Schouws, S., Bouwens, R. J., Algera, H., et al. 2025a, ArXiv e-prints [arXiv:2502.01610] [Google Scholar]
- Schouws, S., Bouwens, R. J., Ormerod, K., et al. 2025b, ApJ, 988, 19 [Google Scholar]
- Shen, X., Vogelsberger, M., Boylan-Kolchin, M., Tacchella, S., & Kannan, R. 2023, MNRAS, 525, 3254 [NASA ADS] [CrossRef] [Google Scholar]
- Shen, X., Kannan, R., Puchwein, E., et al. 2026, MNRAS, 545, staf2119 [Google Scholar]
- Shivaei, I., Reddy, N., Rieke, G., et al. 2020, ApJ, 899, 117 [NASA ADS] [CrossRef] [Google Scholar]
- Shivaei, I., Naidu, R. P., Rodríguez Montero, F., et al. 2025, ArXiv e-prints [arXiv:2509.01795] [Google Scholar]
- Simmonds, C., Tacchella, S., McClymont, W., et al. 2025, MNRAS, 544, 4551 [Google Scholar]
- Somerville, R. S., Yung, L. Y. A., Lancaster, L., et al. 2025, MNRAS, 544, 3774 [Google Scholar]
- Speagle, J. S. 2020, MNRAS, 493, 3132 [Google Scholar]
- Storey, P. J., & Zeippen, C. J. 2000, MNRAS, 312, 813 [NASA ADS] [CrossRef] [Google Scholar]
- Sugimura, K., Ricotti, M., Park, J., Garcia, F. A. B., & Yajima, H. 2024, ApJ, 970, 14 [NASA ADS] [CrossRef] [Google Scholar]
- Sun, G., Faucher-Giguère, C.-A., Hayward, C. C., et al. 2023, ApJ, 955, L35 [CrossRef] [Google Scholar]
- Tacchella, S., Smith, A., Kannan, R., et al. 2022, MNRAS, 513, 2904 [NASA ADS] [CrossRef] [Google Scholar]
- Tacchella, S., Eisenstein, D. J., Hainline, K., et al. 2023, ApJ, 952, 74 [NASA ADS] [CrossRef] [Google Scholar]
- Tacchella, S., McClymont, W., Scholtz, J., et al. 2025, MNRAS, 540, 851 [Google Scholar]
- Tacconi, L. J., Genzel, R., Smail, I., et al. 2008, ApJ, 680, 246 [Google Scholar]
- Tang, M., Stark, D. P., Topping, M. W., Mason, C., & Ellis, R. S. 2024, ApJ, 975, 208 [NASA ADS] [CrossRef] [Google Scholar]
- Tang, M., Stark, D. P., Mason, C. A., et al. 2026, ApJ, 1001, 38 [Google Scholar]
- Tanvir, N. R., Fynbo, J. P. U., de Ugarte Postigo, A., et al. 2019, MNRAS, 483, 5380 [Google Scholar]
- Tepper-García, T. 2006, MNRAS, 369, 2025 [CrossRef] [Google Scholar]
- Terp, C., Heintz, K. E., Watson, D., et al. 2024, A&A, 690, A70 [NASA ADS] [CrossRef] [EDP Sciences] [Google Scholar]
- The pandas development team 2020, https://doi.org/10.5281/zenodo.3509134 [Google Scholar]
- Totani, T., Kawai, N., Kosugi, G., et al. 2006, PASJ, 58, 485 [NASA ADS] [Google Scholar]
- Trussler, J. A. A., Cameron, A. J., Eisenstein, D. J., et al. 2026, MNRAS, 549, stag788 [Google Scholar]
- Umeda, H., Ouchi, M., Nakajima, K., et al. 2024, ApJ, 971, 124 [NASA ADS] [CrossRef] [Google Scholar]
- Umeda, H., Ouchi, M., Kageura, Y., et al. 2026, ApJ, 997, 86 [Google Scholar]
- Valentino, F., Brammer, G., Gould, K. M. L., et al. 2023, ApJ, 947, 20 [NASA ADS] [CrossRef] [Google Scholar]
- Valentino, F., Heintz, K. E., Brammer, G., et al. 2025, A&A, 699, A358 [NASA ADS] [CrossRef] [EDP Sciences] [Google Scholar]
- Vallini, L., Witstok, J., Sommovigo, L., et al. 2024, MNRAS, 527, 10 [Google Scholar]
- Virtanen, P., Gommers, R., Oliphant, T. E., et al. 2020, Nat. Meth., 17, 261 [Google Scholar]
- Wakelam, V., Bron, E., Cazaux, S., et al. 2017, Mol. Astrophys., 9, 1 [Google Scholar]
- Watson, D. 2011, A&A, 533, A16 [CrossRef] [EDP Sciences] [Google Scholar]
- Watson, D., Christensen, L., Knudsen, K. K., et al. 2015, Nature, 519, 327 [Google Scholar]
- White, S. D. M., & Rees, M. J. 1978, MNRAS, 183, 341 [Google Scholar]
- White, R. L., Becker, R. H., Fan, X., & Strauss, M. A. 2003, AJ, 126, 1 [NASA ADS] [CrossRef] [Google Scholar]
- Williams, H., Kelly, P. L., Chen, W., et al. 2023, Science, 380, 416 [NASA ADS] [CrossRef] [Google Scholar]
- Witstok, J., Jakobsen, P., Maiolino, R., et al. 2025, Nature, 639, 897 [Google Scholar]
- Witstok, J., Smit, R., Baker, W. M., et al. 2026, Open J. Astrophys., 9, 55261 [Google Scholar]
- Witten, C., Laporte, N., Martin-Alvarez, S., et al. 2024, Nat. Astron., 8, 384 [Google Scholar]
- Wolfe, A. M., Gawiser, E., & Prochaska, J. X. 2005, ARA&A, 43, 861 [NASA ADS] [CrossRef] [Google Scholar]
- Wu, Z., Eisenstein, D. J., Johnson, B. D., et al. 2025, ApJ, 992, 212 [Google Scholar]
- Yanagisawa, H., Ouchi, M., Nakajima, K., et al. 2025, ApJ, 988, 86 [Google Scholar]
- Yung, L. Y. A., Somerville, R. S., & Iyer, K. G. 2025, MNRAS, 543, 3802 [Google Scholar]
- Zafar, T., & Watson, D. 2013, A&A, 560, A26 [NASA ADS] [CrossRef] [EDP Sciences] [Google Scholar]
- Zavala, J. A., Castellano, M., Akins, H. B., et al. 2025, Nat. Astron., 9, 155 [Google Scholar]
- Ziparo, F., Ferrara, A., Sommovigo, L., & Kohandel, M. 2023, MNRAS, 520, 2445 [NASA ADS] [CrossRef] [Google Scholar]
- Zitrin, A., Zheng, W., Broadhurst, T., et al. 2014, ApJ, 793, L12 [Google Scholar]
Appendix A: Table and spectra of all galaxies
ID, spectroscopic redshift, UV magnitude, UV slope, H I column density, and literature references for the full z > 9 sample
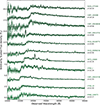 |
Fig. A.1. All z > 10 spectra, showing UV turnover fitting. Note that when available, spectroscopic redshifts are measured from rest-optical emission lines. |
 |
Fig. A.1. (continued) |
 |
Fig. A.2. All 9 < z < 10 spectra, showing UV turnover fitting. Note that in almost all cases, the best-fit spectroscopic redshift is derived from rest-optical emission lines. |
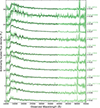 |
Fig. A.2. (continued) |
All Tables
ID, spectroscopic redshift, UV magnitude, UV slope, H I column density, and literature references for the full z > 9 sample
All Figures
|
Fig. 1. Left: Example of UV emission line and DLA fitting for JADES-GS-z13-0 (DJA ID 3215_20128771) at z = 12.85. The NIRSpec/PRISM spectrum and associated error are shown in green. The marked UV emission lines were modelled and then superimposed on the intrinsic spectrum before modelling the DLA (solid black line). In the inset, we show a zoom on the Lyα region, with the DLA+IGM model as a solid line, and with 100% neutral IGM only (xHI = 1.0) as a dashed line. Right: Corner plot of the posterior distributions for the DLA+IGM model, with median, 16th and 84th percentiles marked. |
| In the text | |
|
Fig. 2. Calculated column densities across the redshift range of the sample; dark green squares are well-constrained column densities with values NHI > 1021 cm−2. Upper limits are plotted as triangles, derived from the 95th percentile of the posterior distribution. The different shaded regions represent low column density (NHI < 1021 cm−2) where objects are likely IGM-dominated, high column densities (NHI > 1021 − 22 cm−2) where neutral hydrogen exceeds abundance from a fully neutral IGM, and very strong DLAs (NHI > 1022 cm−2) with an extreme over-abundance of neutral gas. Regardless of column density, all objects are optically thick with optical depths at the Lyman limit τ > 103, with the highest column densities NHI = 1022 cm−2 corresponding to optical depths τ ≈ 105. Medians of well-constrained column density binned in redshift (z < 10, 10 < z < 12, z > 12) are shown as black triangles (with values NHI = 1021.71, 1022.24, and 1022.37 cm−2 respectively). These are essentially upper limits, as the fraction of IGM-dominated galaxies/upper limits (which were not included in the median) in each bin is 0.42, 0.50, and 0.29 respectively. |
| In the text | |
|
Fig. 3. Measured βUV slope and column density log(NHI/cm−2) for the galaxy sample. The green squares and triangles again represent the well-constrained and upper limits for column density respectively, with the grey shaded region representing possible high nebular continuum where two-photon emission may be masquerading as a DLA (Katz et al. 2025). |
| In the text | |
|
Fig. 4. Top: Cumulative histogram of derived column densities for our sample in shades of green: separated for non-DLAs (column densities < 1021 cm−2), and the DLA sample (column densities > 1021 cm−2) for z = 9 − 10 and z > 10. The full sample is shown as grey shaded region, comparing directly to the averages of SERRA-simulated galaxies z = 6 − 9.5 in blue (Gelli et al. 2025), showing that while the spread of observed DLAs is broadly consistent, there is a peak of extreme-DLAs (> 1022 cm−2) that are not represented in the averages of simulations, particularly for those z > 10. Bottom: Similar to top panel, but for a normalised PDF, along with the fraction of galaxies with unconstrained DLAs shown as an IGM limit. |
| In the text | |
|
Fig. 5. Measured UV magnitude and column density. Halo masses for our objects are derived from UV magnitudes (Mason et al. 2023, no dust model). The well-constrained column densities of our sample are consistent with results from SERRA simulations (Gelli et al. 2025). The grey contours represent the average column density of 100 galaxies over random sight-lines, with the 1σ error region also shown, representing the scatter across sightlines in simulations. |
| In the text | |
|
Fig. 6. Left: Upper limits for the dust-to-gas ratio AV/NHI against redshift, for the subsample of DLAs with NHI > 1021 cm−2. Here, AV are derived from the assumed reddening of the βUV slope, and so are taken to be upper limits. The majority of the sample are consistent with being dust-poor, lying below 10% solar metallicity. Right: The trend of AV/NHI against gas-phase metallicity 12+log(O/H), compared to values from the Milky Way, Large and Small Magellanic Clouds, and 10%, 5%, and 1% metallicities (metallicity for each represented with a star). The black line shows the relation for local galaxies and gamma-ray bursts (GRBs) (Heintz et al. 2023b). The method for calculating metallicity for each object is represented by different symbols; each still represents an upper limit in AV/NHI, and is colour-coded with lensing-corrected UV magnitude. |
| In the text | |
|
Fig. 7. Offset from the FMR (Curti et al. 2020) as a function of the H I column density for the sample of constrained DLAs. Binned averages for NHI = 1021 − 22 cm−2 and NHI > 1022 cm−2 are shown as black diamonds, with 1σ error bars. The average offset from metallicity measurements at z = 9 − 10 (Pollock et al. 2026) is shown in light green. There is only a moderate correlation, with Spearman rank ρ ≈ −0.4, however the strongest DLAs tend to show large offsets from the FMR, as would be expected from pristine gas inflow dilution. |
| In the text | |
|
Fig. 8. Atomic KS relation of log(ΣHI) and log(ΣSFR), coloured with column density values. As previously, we plot non-constrained values as upper limits (95%). We compare to the canonical Kennicutt & De Los Reyes (2021) (K21) relations for starburst and main sequence galaxies, as well as various gas consumption depletion times corresponding to global star formation efficiency in grey (Kennicutt 1998, N = 1.0). All galaxies lie above the empirical law, with some scatter, and the low column density (non-DLA) objects are extremely offset, even when plotted as upper limits. The binned means for Σgas = 101 − 102, and 102 − 103 M⊙ pc−2 are shown as black diamonds, both consistent with ∼10 Myr. In shades of blue we compare to simulation predictions from THESAN-ZOOM at z = 10 − 12 (Shen et al. 2026; Kannan et al. 2025), SERRA at z = 7 (Pallottini et al. 2022), and H I-only gas surface density from COLIBRE at z = 8 (Lagos et al. 2026). Various literature measurements are shown in grey: from ALMA detections of [O III] 88 μm and [C II] 158 μm (Vallini et al. 2024) at z ≈ 7, CO-based measurements for starburst ULIRGs at z ∼ 0 (Bouché et al. 2007), and SMGs at z ∼ 2 (Bothwell et al. 2010; Tacconi et al. 2008). |
| In the text | |
|
Fig. A.1. All z > 10 spectra, showing UV turnover fitting. Note that when available, spectroscopic redshifts are measured from rest-optical emission lines. |
| In the text | |
|
Fig. A.1. (continued) |
| In the text | |
|
Fig. A.2. All 9 < z < 10 spectra, showing UV turnover fitting. Note that in almost all cases, the best-fit spectroscopic redshift is derived from rest-optical emission lines. |
| In the text | |
|
Fig. A.2. (continued) |
| In the text | |
Current usage metrics show cumulative count of Article Views (full-text article views including HTML views, PDF and ePub downloads, according to the available data) and Abstracts Views on Vision4Press platform.
Data correspond to usage on the plateform after 2015. The current usage metrics is available 48-96 hours after online publication and is updated daily on week days.
Initial download of the metrics may take a while.