


Fig. 4.
Download original image
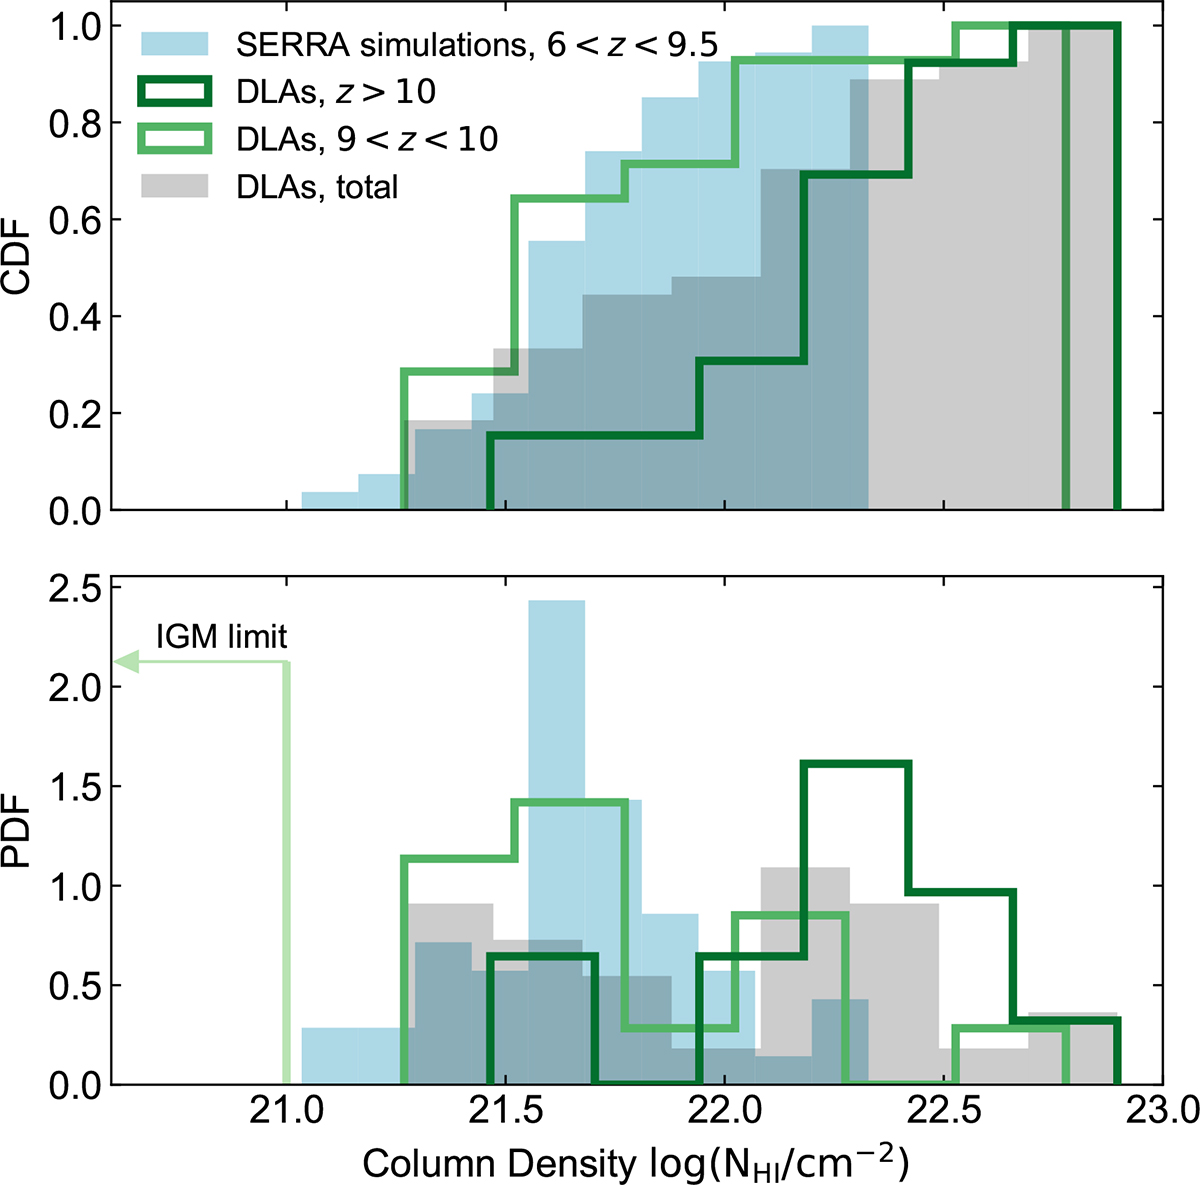
Top: Cumulative histogram of derived column densities for our sample in shades of green: separated for non-DLAs (column densities < 1021 cm−2), and the DLA sample (column densities > 1021 cm−2) for z = 9 − 10 and z > 10. The full sample is shown as grey shaded region, comparing directly to the averages of SERRA-simulated galaxies z = 6 − 9.5 in blue (Gelli et al. 2025), showing that while the spread of observed DLAs is broadly consistent, there is a peak of extreme-DLAs (> 1022 cm−2) that are not represented in the averages of simulations, particularly for those z > 10. Bottom: Similar to top panel, but for a normalised PDF, along with the fraction of galaxies with unconstrained DLAs shown as an IGM limit.
Current usage metrics show cumulative count of Article Views (full-text article views including HTML views, PDF and ePub downloads, according to the available data) and Abstracts Views on Vision4Press platform.
Data correspond to usage on the plateform after 2015. The current usage metrics is available 48-96 hours after online publication and is updated daily on week days.
Initial download of the metrics may take a while.