


| Issue |
A&A
Volume 710, June 2026
|
|
|---|---|---|
| Article Number | A374 | |
| Number of page(s) | 15 | |
| Section | Extragalactic astronomy | |
| DOI | https://doi.org/10.1051/0004-6361/202557654 | |
| Published online | 29 June 2026 | |
REBELS-IFU: Linking damped Lyman-α absorption to [C II] emission and dust content in the Epoch of Reonisation
1
Leiden Observatory, Leiden University, P.O. Box 9513, 2300 RA, Leiden, The Netherlands
2
Cosmic Dawn Center (DAWN), Copenhagen, Denmark
3
Niels Bohr Institute, University of Copenhagen, Jagtvej 128, 2200 Copenhagen, Denmark
4
Department of Astronomy, University of Geneva, Chemin Pegasi 51, 1290 Versoix, Switzerland
5
Institute of Astronomy and Astrophysics, Academia Sinica, 11F of Astronomy-Mathematics Building, No.1, Sec. 4, Roosevelt Rd, Taipei 106319, Taiwan, ROC
6
Departament d’Astronomia i Astrofísica, Universitat de València, C. Dr Moliner 50, E-46100 Burjassot, València, Spain
7
Unidad Asociada CSIC ‘Grupo de Astrofísica Extragaláctica y Cosmología’ (Instituto de Física de Cantabria – Universitat de València), València, Spain
8
Instituto de Estudios Astrofísicos, Facultad de Ingeniería y Ciencias, Universidad Diego Portales, Av. Ejército 441 Santiago, Chile
9
Millenium Nucleus for Galaxies (MINGAL), Avenida Ejército 441 Santiago 8370191, Chile
10
International Centre for Radio Astronomy Research (ICRAR), The University of Western Australia, Crawley, WA 6009, Australia
11
ARC Centre of Excellence for All Sky Astrophysics in 3 Dimensions (ASTRO 3D), Australia
12
Canadian Institute for Theoretical Astrophysics, 60 St George St, University of Toronto, Toronto, ON M5S 3H8, Canada
13
David A. Dunlap Department of Astronomy and Astrophysics, University of Toronto, 50 St George St, Toronto, ON M5S 3H4, Canada
14
Department of Physics, 60 St George St, University of Toronto, Toronto, ON M5S 3H8, Canada
15
Scuola Normale Superiore, Piazza dei Cavalieri 7, 56126 Pisa, Italy
16
Jodrell Bank Centre for Astrophysics, Department of Physics and Astronomy, University of Manchester, Manchester, UK
17
Departamento de Astronomía, Universidad de Chile, Camino del Observatorio 1515, Las Condes, Santiago 7591245, Chile
18
Hiroshima Astrophysical Science Center, Hiroshima University, Hiroshima 739-8526, Japan
19
Centre for Astrophysics and Supercomputing, Swinburne University of Technology, Hawthorn, VIC 3122, Australia
20
Astrophysics Research Institute, Liverpool John Moores University, Liverpool, UK
21
Dipartimento di Fisica “Enrico Fermi”, Università di Pisa, Pisa, Italy
22
Sterrenkundig Observatorium, Ghent University, Ghent, Belgium
★ Corresponding author: This email address is being protected from spambots. You need JavaScript enabled to view it.
Received:
10
October
2025
Accepted:
27
April
2026
Abstract
Neutral gas present in galaxies during the Epoch of Reionisation (EoR) is responsible for regulating star formation, dust growth, and the escape of ionising photons, making it a key ingredient in our understanding of both galaxy assembly and reionisation. However, direct constraints on the H I content of galaxies at z > 6 have been scarce thus far. With JWST, it is possible to obtain a direct probe of this neutral component by surveying Lyα damping wings in galaxy spectra. We analysed JWST/NIRSpec prism spectra of 12 UV-luminous galaxies from the REBELS-IFU program at z ∼ 6.5–7.7, deriving H I column densities by modelling Lyα damping wings. Significant damped Lyα absorption from local H I gas was detected in six galaxies, with NH I ≳ 1021 cm−2. We use the column densities and sizes derived for these sources to estimate their H I masses and compare with L[C II]–MH I calibrations. The resulting H I masses show a tentative correlation with those inferred from [C II], although the [C II]-based estimates are systematically larger, suggesting that the H I reservoirs might extend beyond the [C II]-emitting gas. We also combined measurements taken from damped Lyman-α (Lyα) systems (DLAs) with far-infrared (FIR) derived dust-to-gas ratios (DTGs), dust attenuation, and gas-phase metallicities. No correlation was found between DLA-based and FIR-based DTGs; however, combining the REBELS-IFU sample with literature samples at lower metallicities revealed a strong correlation between AV/NH I and metallicity. These findings suggest that by z ∼ 7 massive galaxies already have the capacity to host substantial, enriched reservoirs of neutral gas and dust, consistent with AV/NH I–metallicity trends at lower redshifts. Finally, we also see tentative evidence of a redshift evolution of the AV/NH I–metallicity relation, with lower AV/NH I at fixed metallicity with increasing redshift, which might point to pristine gas accretion or more efficient dust destruction and/or expulsion.
Key words: galaxies: evolution / galaxies: high-redshift / galaxies: ISM
© The Authors 2026
 Open Access article, published by EDP Sciences, under the terms of the Creative Commons Attribution License (https://creativecommons.org/licenses/by/4.0), which permits unrestricted use, distribution, and reproduction in any medium, provided the original work is properly cited.
This article is published in open access under the Subscribe to Open model. This email address is being protected from spambots. You need JavaScript enabled to view it. to support open access publication.
1. Introduction
A central goal of galaxy formation theory is to understand how galaxies acquire gas, form stars, and chemically enrich their interstellar medium (ISM) over cosmic time. This process, known as the baryon cycle, relies critically on the accretion of gas from the intergalactic medium (IGM), its subsequent conversion into molecular gas (the fundamental fuel for star formation), and the return of enriched material through stellar feedback (e.g. Tumlinson et al. 2017; Tacconi et al. 2020). The presence, abundance, and spatial distribution of gas therefore provides vital insight into the physical processes regulating early galaxy growth.
At high redshift, theoretical models and cosmological simulations predict elevated accretion rates of pristine neutral atomic gas onto galaxies, driving an increase in gas turbulence (Dekel et al. 2009; Ginzburg et al. 2022), a dilution of gas-phase abundances (e.g. Ma et al. 2016), and rapid and bursty star formation (Pallottini et al. 2022). However, directly measuring the atomic gas content in these early galaxies has remained challenging. The H I 21 cm hyperfine line is typically too faint to be detected for individual galaxies beyond z ∼ 0.5 with current observational facilities (Fernández et al. 2016; Sinigaglia et al. 2022). Instead, absorption spectroscopy of bright background sources such as quasars or gamma-ray bursts (GRBs) has historically been the primary method to study neutral gas at high redshift via damped Lyman-α (Lyα) absorption systems (DLAs). These systems arise when large reservoirs of neutral hydrogen along the line of sight produce strong Lyα absorption with characteristic damping wings, corresponding to column densities above NHI ≥ 2 × 1020 cm−2 (e.g. Wolfe et al. 2005; Jakobsson et al. 2006; Péroux & Howk 2020).
Recently, a new window into H I gas at z > 6 has opened, enabled by the James Webb Space Telescope (JWST). High-sensitivity rest-UV spectroscopy has revealed broad Lyα absorption in the spectra of star-forming galaxies themselves, likely shaped by large columns of neutral gas within or around the galaxies; namely, extreme DLAs with column densities exceeding NHI ≳ 1022 cm−2 (e.g. Heintz et al. 2024b; D’Eugenio et al. 2024; also see the discussion of the impact of nebular continuum emission on inferred column densities in Cameron et al. 2024; Katz et al. 2025). These features represent the first direct detections of the neutral atomic gas reservoirs in galaxies during the EoR and challenge earlier assumptions that the damping wings in z > 6 galaxy spectra solely probe the IGM (Miralda-Escude 1998; McQuinn et al. 2008).
These DLAs likely trace the buildup of pristine gas as it accretes from the IGM and fuels early star formation, thereby representing a key missing piece in our census of baryonic matter in high-z galaxies. The presence of these neutral gas reservoirs can also hinder the escape of ionising photons, affecting the contribution of galaxies to reionisation. It can bias photometric and spectroscopic redshift measurements based on the Lyman break (e.g. Heintz et al. 2024; Hainline et al. 2024; Witstok et al. 2025; Asada et al. 2025). Crucially, the shape of the Lyα absorption profile itself can be used to infer the H I column density and constrain the neutral gas content along the line of sight.
While atomic gas at z > 6 has also been indirectly traced via the [C II]158 μm far-infrared (FIR) emission line, this line typically probes a mix of ionised, neutral, and molecular ISM phases, and [C II] luminosity-based conversions into atomic, molecular, or total gas mass are dependent on various ISM properties (e.g. Wolfire et al. 2022; Vizgan et al. 2022; Casavecchia et al. 2025; Vallini et al. 2025; Khatri et al. 2025). While perhaps more difficult to analyse, the Lyα damping wings therefore offer a complementary and more direct tracer of neutral hydrogen within or around galaxies, especially when combined with other probes of the gas and dust content, key to also understanding where the most prominent FIR ISM cooling lines, such as [C II]158 μm, mainly originate from at high redshifts.
In parallel, recent observations have revealed that dust is already widespread by the end of the EoR. ALMA has detected massive dust reservoirs in galaxies out to z ∼ 8.3 (e.g. Riechers et al. 2013; Marrone et al. 2018; Tamura et al. 2019; Inami et al. 2022), suggesting that chemical enrichment and dust buildup occur rapidly after the onset of star formation. However, beyond z ≳ 8, dust detections become remarkably scarce. This apparent disappearance of dust is particularly intriguing in light of JWST’s discovery of an overabundance of UV-bright galaxies at z > 10 (Naidu et al. 2022; Castellano et al. 2023; Finkelstein et al. 2023; Harikane et al. 2023), with some studies suggesting that the dust in these galaxies may have been pushed to kiloparsec (kpc) scales by outflows and/or destroyed by supernovae (Ferrara 2024; Ferrara et al. 2025, but see e.g. Mirocha & Furlanetto 2023; Dekel et al. 2023; Trinca et al. 2024; Matteri et al. 2025 for alternative explanations).
A promising route to further understanding and directly quantifying the buildup of dust and metals in the early Universe is via the dust-to-gas (DTG), dust-to-metal (DTM), and dust-to-stellar (DTS) mass ratios (Rémy-Ruyer et al. 2014; Vis et al. 2017; Looze et al. 2020; Galliano et al. 2021). These ratios provide key insights into the dominant dust production channels, the efficiency of grain growth in the ISM, and the timescales for chemical enrichment (e.g. see the recent review of Schneider & Maiolino 2024). By combining new constraints on neutral gas masses with measurements of dust attenuation and metallicity, we can further test theoretical models of early dust production, grain growth, and destruction mechanisms.
In this work, we analyse a sample of massive, UV-luminous star-forming galaxies from the REBELS survey (Bouwens et al. 2022) at z ∼ 6.5 − 7.7, with the data described in Section 2. Using JWST/NIRSpec prism spectroscopy, we model their UV continua and Lyα absorption profiles to measure H I column densities and probe the neutral gas content via damped Lyα features (Section 3.1). We describe the other key ISM properties of this sample in Section 2 and derive different estimates for the H I mass in Section 3.2. We compare these H I mass estimates to gas masses inferred from [C II] emission (Section 4.1), and explore their relation to dust attenuation and metallicity (Section 4.2). This multi-tracer approach offers a powerful new window into the early gas and dust reservoirs of galaxies, and sheds a unique light on how baryons assemble and evolve in the first billion years of cosmic history.
Throughout this work, we assume a standard lambda cold dark matter (ΛCDM) cosmology, with H0 = 70 km s−1 Mpc−1, Ωm = 0.30, and ΩΛ = 0.70. We adopt the Kroupa (2001) initial mass function and take the solar abundance as 12 + log(O/H) = 8.69 (Asplund et al. 2009).
2. Data
The 12 galaxies analysed in this work, hereafter referred to as the REBELS-IFU sample, were selected from the Cycle 7 ALMA Large Program (LP) Reionisation-Era Bright Emission Line Survey (REBELS; Bouwens et al. 2022; Schouws et al., in prep.), which carried out Band 6 spectral scans targeting the [C II] 158 μm fine-structure line and underlying dust continuum emission in 36 UV-luminous (MUV, AB ≲ −21.5 mag) galaxies with photometric redshifts zphot > 6.51. All 12 galaxies within the REBELS-IFU sample have high signal-to-noise (S/N ≳ 8) detections of [C II], with a spectroscopic redshift range of 6.5 ≲ z ≲ 7.7, and [C II] luminosities between log(L[C II]/L⊙) = 8.2−9.3 (see Table 1). All but two of these galaxies (REBELS-15 and REBELS-34) are also detected in the ALMA Band 6 continuum from the LP data (Inami et al. 2022).
Summary of derived physical properties for the REBELS-IFU sample.
The REBELS-IFU sample was then observed as part of two Cycle 1 JWST NIRSpec/IFU programs: 11 galaxies were observed in GO 1626 (PI M. Stefanon, ∼1700 second exposures per source) and one (REBELS-18) in GO 2659 (PI J. Weaver, on-source exposure of 1.7 hours). These observations used the low-resolution prism mode (ℛ ∼ 100), covering a 3″ × 3″ field of view over an observed wavelength range of 0.6 − 5.3 μm, enabling detections of key rest-frame optical emission lines, as detailed in Rowland et al. (2026). Full details of the data reduction is presented in Stefanon et al. (in prep.), with a summary given in Rowland et al. (2026), Algera et al. (2026), Fisher et al. (2025).
Rowland et al. (2026) also provided details on the extraction of 1D integrated spectra using masks around each galaxy in the IFU cubes, and the corresponding emission line analysis and metallicity measurements for each source. In this work, we used the same integrated 1D spectra and, where necessary, the derived emission line fluxes and ISM properties described therein and summarised, below. A schematic overview of how the different datasets are used in this analysis is shown in Figure 1, with full methodological details provided in Section 3.
 |
Fig. 1. Schematic illustrating the assumptions and methodology used in this work. We stress that this schematic should be regarded only as a rough illustration under the very simplified assumptions adopted. Left panel: Section of a simplified model galaxy, where we assume spherical geometry with radii set by the UV emission, [C II] emission, and the H I reservoir radii derived in this work (see text). Ionising photons from young massive stars (yellow) propagate outward, becoming attenuated by dust (orange circles) and, along some sight lines, absorbed by neutral H I clouds in or around the galaxy (dashed red line). Other sight lines pass through without strong absorption (solid red line). All photons are then additionally absorbed by the IGM. Top right panel: Example SED from BAGPIPES for a massive (log(M*/M⊙) = 9), dusty (AV = 0.9 mag), star-forming (SFR10 = 200 M⊙ yr−1) galaxy at z = 7. Shown are the intrinsic stellar continuum (yellow), the attenuated stellar continuum (red), and dust emission (orange). The blue shaded region marks the NIRSpec wavelength range used to measure stellar AV, while the red shaded band indicates the ALMA Band 6 FIR continuum at ∼160 μm used to estimate the dust mass for the REBELS-IFU sample. Bottom right panel: Example Lyα transmission curves, comparing the case of IGM-only absorption (solid red line) with IGM + DLA absorption from neutral gas in the ISM and/or CGM (dashed red). Following our modelling, we assume a mean IGM neutral fraction of xHI = 0.33 and convolve the spectra to ℛ = 60. |
The key ISM properties relevant to this study are the oxygen abundance (12 + log(O/H)) and the dust attenuation (AV). The oxygen abundance values are derived from the same integrated spectra in Rowland et al. (2026), with details discussed therein. In summary, strong line calibrations from Sanders et al. (2024) are used to derive 12 + log(O/H), primarily using R23 (([O III]λλ 4959,5007 + [O II]λλ3727,29)/Hβ) and R3 (= [O III]λ 5007/ Hβ) ratios, and using O32 (= [O III]λ 5007/[O II]λλ3727,29) and/or Ne3O2 (= [Ne III]λ3869/[O II]λ>λ>3727,29) ratios to break the degeneracy for these multi-solution calibrations. The resulting metallicities are all ≳10% Z⊙, with a mean 12 + log(O/H) = 8.3 (∼ 40% Z⊙).
The nebular attenuation values derived from the observed Hα/Hβ Balmer decrements, AV, neb, are also provided in Rowland et al. (2026). Nebular attenuation values typically exceed the stellar attenuation inferred from spectral energy distribution (SED) fitting, which is mainly based on the attenuation of the stellar continuum, by as much as a factor of two (e.g. Calzetti et al. 1994). This is also the case for the REBELS-IFU sample (Fisher et al. 2026). Since the SED-derived AV represents the integrated attenuation of the whole stellar continuum, and not just in emission-line regions, we adopt SED-derived AV values for all sources in this work (given in Table 1), but we note that adopting AV, neb does not significantly change our findings. The SED fitting of the integrated REBELS-IFU spectra is summarised in Rowland et al. (2026), with full details and values provided in Stefanon et al. (in prep.). In short, BAGPIPES is used to fit the observed spectrum of each source, assuming a non-parametric star formation history (SFH) with a continuity prior and a Calzetti et al. (2000) attenuation curve. We also repeat the analysis discussed in subsequent sections with the AV values derived from the flexible attenuation curve fitting described in Fisher et al. (2025), and find that any differences are not significant enough to affect the trends discussed in this work.
3. Methods
3.1. Modelling the Lyα damping wing
To model the observed spectrum of each galaxy, we simultaneously fit the UV continuum (UV slopes, βUV, and absolute magnitudes, MUV) along with absorption by neutral hydrogen. The fit is restricted to rest-frame wavelengths between 1000–2600 Å, thereby excluding regions affected by strong optical nebular emission lines. We also masked out wavelengths that may be affected by the 2175 Å bump feature, which has been detected for some of the REBELS-IFU sources (see Fisher et al. 2025). We compare the βUV and MUV values derived simultaneously with the DLA in this work with those derived in Fisher et al. (2025), who masked out λrest < 1268 Å, in Appendix A.
Following Heintz et al. (2024b), we accounted for absorption from the intergalactic medium (IGM) using the formalism of Miralda-Escude (1998) and Totani et al. (2006), where the IGM transmission redward of Lyα is modelled as
![Mathematical equation: $$ \begin{aligned} \tau _{\mathrm{IGM} }(\lambda _{\mathrm{obs} }, z)&= \frac{x_{\mathrm{HI} } R_\alpha \tau _{\mathrm{GP} }(z_{\mathrm{gal} })}{\pi } \left( \frac{1 + z_{\mathrm{abs} }}{1 + z_{\mathrm{gal} }} \right)^{3/2} \nonumber \\&\quad \times \left[ I\left( \frac{1 + z_{\mathrm{IGM,u} }}{1 + z_{\mathrm{abs} }} \right) - I\left( \frac{1 + z_{\mathrm{IGM,l} }}{1 + z_{\mathrm{abs} }} \right) \right], \end{aligned} $$](/articles/aa/full_html/2026/06/aa57654-25/aa57654-25-eq31.gif) (1)
(1)
where I(x) is given by Eq. (3) in Totani et al. (2006), xHI is the average fraction of neutral hydrogen in the IGM, zgal is the redshift of the galaxy, zabs is the redshift of the neutral absorbing gas, and Rα = Λαλα/(4πc) depends on the Lyα damping constant, Λα, and rest-frame wavelength λα = 1216 Å. We set the upper bound at the galaxy redshift, zIGM, u = zgal, and integrate the expression down to zIGM, u = 6 (as in Totani et al. 2006; Heintz et al. 2024b). The Gunn–Peterson optical depth is given by Eq. (4) in Totani et al. (2006), which is simplified to
 (2)
(2)
for the cosmological parameters assumed in this work.
In addition to IGM absorption, we model the optical depth due to neutral hydrogen along the line of sight using a Voigt absorption profile following the analytical approximation derived by Tepper-García (2006) as
 (3)
(3)
where H(a, x) is the Voigt-Hjerting function, a is the damping parameter, and C is the photon absorption constant. In this model, the neutral hydrogen column density, NH I, and the absorber redshift, zabs, are the two parameters that describe the DLA. For this work, we assume that the DLA arises from gas in close proximity to the galaxy (e.g. ISM or circumgalactic medium, CGM), and therefore fix the absorber redshift to that of the galaxy (zabs = zgal), determined from the [C II] systemic redshifts reported in Table 1. This DLA fitting methodology with fixed zabs will hereafter be referred to as our fiducial method.
A key strength of our analysis is that these [C II] detections from ALMA provide extremely precise spectroscopic redshifts (typically Δz ∼ 0.0001), unlike samples relying solely on JWST spectroscopy (often prism), which suffer from larger uncertainties. As discussed in Stefanon et al. (in prep.), we also correct for the small wavelength offset between the prism spectra and the [C II] redshifts, which is a systematic offset also found between prism and grating NIRSpec spectra (e.g. D’Eugenio et al. 2025).
We also explored leaving zabs as a free parameter in the fits. Allowing this freedom effectively tests whether the absorption could arise from a foreground system rather than from gas associated with the galaxy itself. In practice, NH I and zabs are highly degenerate, particularly at the relatively low spectral resolution and S/N of prism data, and the best-fit absorber redshifts are generally consistent with the systemic [C II] values within the uncertainties. Only two galaxies (REBELS-12 and REBELS-18) were found to have both Δz = zabs − zgal and NHI values inconsistent with zero (at the 1 − 1.3σ level) and prefer a DLA model with zabs < zgal (Figure B.2). It is possible that these objects could lie in overdense regions (REBELS-12 already has one known close neighbour; Fudamoto et al. 2022), making foreground absorption plausible (with Δz = 0.35 ± 0.20 and 0.26 ± 0.18, respectively). Since the absorption in these cases may arise from foreground gas rather than from the ISM or CGM of the galaxies themselves, the inferred NH I may not trace the neutral gas reservoir associated with the [C II] emission discussed in subsequent sections. We therefore exclude REBELS-12 and REBELS-18 from further analysis and adopt the assumption zabs = zgal for the remaining sources.
Additionally, in our fiducial fits, we assumed xHI = 0.33, which was derived in Mason et al. (2026) for sources at z ∼ 5.5 − 8, for all 12 of the REBELS-IFU sources. As noted by Huberty et al. (2025), xHI and the H I column densities are degenerate in these fits, which can result in uncertainties of up to 1 dex in low resolution spectra. However, we find that the main conclusions of this work do not significantly change if we instead chose to adopt xHI = 0.53, as calculated in Umeda et al. (2024) for galaxies at z ∼ 7. Quantitatively, adopting xHI = 0.53 results in NH I values lower by less than 0.1 dex, which is within the uncertainties of the quoted fiducial values in Table 1. We also perform an additional test in which we assume xHI = 1 and instead allow the distance between the galaxy and the surrounding neutral gas to vary as a free parameter, following the approach of Mason et al. (2026). The resulting NH I values are consistent with those derived from our fiducial fits, indicating that our conclusions are not sensitive to the adopted IGM prescription.
There are also additional degeneracies with Lyα emission, which we do not include in the fitting. Lyα emission has only been detected for three of the sources in the REBELS-IFU sample from MMT/Binospec observations (Endsley et al. 2022, discussed below) and is completely blended with the continuum in these prism spectra. Incorporating Lyα emission within the range of Lyα FWHM, velocity offsets, and equivalent widths (EWs) obtained from Endsley et al. (2022) also does not significantly impact the derived column densities; however, we note the considerable uncertainties due to the unknown contribution of Lyα emission for the majority of this sample. This analysis would therefore benefit from higher resolution rest-UV spectra to further investigate all the degeneracies discussed here.
Given these broad assumptions, the only parameters that we leave free in our fiducial fits are NH I, βUV, and MUV. We fit the full model (UV continuum × IGM transmission × ISM damping) to the observed 1D spectrum of each galaxy using the Levenberg–Marquardt minimiser implemented in the lmfit package, minimising the residuals between the model and the observed spectrum. We convolve the full model with the NIRSpec prism spectral resolution (ℛ) prior to fitting, for which we use the empirically-derived resolution curve (Stefanon et al., in prep.). At the observed wavelength of Lyα at z = 6.5 − 7.7, this results in ℛ ∼ 60.
To assess the significance of the DLA component, we compared the reduced chi-squared (χ2) and Bayesian information criterion (BIC) between the full model and an IGM-only model without the ISM damping component. In the IGM-only case, only the UV continuum slope (β) and MUV are fitted, and only absorption from neutral hydrogen in the IGM with a fixed xHI = 0.33 is considered. We find that in eight out of 12 sources, the addition of the DLA component improves the fit (improved χ2 and BIC), supporting the presence of high column density neutral hydrogen along the line of sight. As discussed above, two of these galaxies (REBELS-12 and REBELS-18) show a mild preference for zabs < zgal and are therefore excluded from the subsequent analysis. This leaves a final sample of six galaxies with measurements of NH I for which the absorption can be reasonably associated with neutral gas in or near the galaxy itself (plotted in Figure 2). However, we caution that the statistical improvement from the addition of the DLA component is only moderate for the majority of sources, as indicated on Figure 2.
 |
Fig. 2. Spectral fits for the six galaxies where including a damped Lyα absorption (DLA) component with zabs = zgal improves the fit to the observed UV continuum downturn, as quantified by both the reduced χ2 and the BIC. The observed data are shown in black, with the flux uncertainties shaded in grey. The best-fit model including both IGM and DLA absorption is plotted in red, while the blue curve shows a model with only IGM absorption. |
For the remaining four galaxies plotted in Figure B.1 (REBELS-14, 15, 32, and 39), the fits with the DLA component show no statistical improvement. It is interesting to note that three of these galaxies (REBELS-14, 15 and 39) are the only confirmed Lyα emitters in the REBELS-IFU sample (Endsley et al. 2022), and have the highest [O III]λ5007 EWs and lowest metallicities (Rowland et al. 2026). As discussed above, when we incorporated the observed FWHM, EW, and velocity offsets of the observed Lyα emission from Endsley et al. (2022), there was no statistical improvement to the DLA fitting for these three sources. This may suggest that the assumption of a uniform H I distribution in our DLA modelling is too simplistic. Indeed the Lyα escape fractions of these galaxies appear to match their inferred LyC escape fractions (Komarova et al. 2025), consistent with escape through low-column ‘channels’ with insufficient H I for Lyα scattering.
Alternatively, another explanation for the poor DLA fits could be that the observed UV downturns are not due to absorption at all, but rather to intrinsic nebular continuum emission. As noted in Section 1, recent studies have shown that strong UV continuum downturns can be produced by two-photon nebular emission in galaxies with extremely hot and young stellar populations (ages ∼106 yr; T* ≳ 80 000 K), potentially mimicking the appearance of DLA damping wings (Katz et al. 2025; Cameron et al. 2024). Given their high [O III]λ5007 equivalent widths (≳1000 Å) and low metallicities (≲0.2 Z⊙), such conditions may plausibly apply to REBELS-14, 15 and 39. However, Katz et al. (2025) show that nebular continuum emission under these conditions, and for the measured range of βUV for this sample, would typically mimic DLAs with column densities NH I > 1022 cm−2, which is higher than what we infer for these sources. However, note that the inferred DLA column is dependent on the assumed intrinsic SED. Katz et al. (2025) also find that such nebular-dominated spectra are expected to exhibit strong Balmer jumps, which are not observed in our data. We therefore conclude that nebular two-photon emission is unlikely to be the dominant cause of the UV downturns observed in most REBELS galaxies. However, for REBELS-14, 15, and 39, we cannot rule out a moderate contribution from this effect, particularly given their more extreme emission line properties.
Another aspect that could complicate this analysis for the majority of the REBELS-IFU sample is their observed clumpy morphology in the JWST emission line maps (see Figure 1 in Rowland et al. 2026), which could suggest that these are neighbouring or merging galaxies. There is also some evidence that Lyα emission is enhanced in mergers (Witten et al. 2024), which could provide an explanation for the Lyα emission detected for REBELS-14, 15 and 39. To test the effect this clumpy morphology may have on our results and interpretation, we also fit DLA profiles to individual ‘clump’ spectra, extracted using the ASTRODENDRO2 Python package. Tests using these clump masks on the derived ISM properties (including the oxygen abundance) are discussed in Rowland et al. (2026), with full details of this clump selection and analysis detailed in Rowland et al. (in prep.). For the clumps with sufficient S/N, we find that the derived NH I values are consistent within the uncertainties with the integrated values, although they on average tend to show higher hydrogen column densities (by a factor of ∼1.8). Since one of the aims of this work is to compare the H I gas masses inferred from the DLA fitting to those derived from the [C II] luminosities, for which the corresponding ALMA data does not have sufficient resolution to identify and analyse individual clumps for the full sample, we therefore only use the NH I values derived from the DLA fitting of the integrated spectra in subsequent analyses.
For the galaxies with poor fits to the integrated spectra (REBELS-14, 15, 32, and 39), the clump-based analysis likewise does not improve the quality of the DLA fits. Since the models fail to reproduce the apparent UV downturns in REBELS-14, 15, and 39 (both in the integrated and clump spectra), and the UV continuum of REBELS-32 is likely too faint to reliably constrain a damping wing, we treated all four as non-detections.
For the final sample of six galaxies with fitted DLA components (REBELS-05, 08, 25, 29, 34, and 38), we estimate the detection significance of the damping-wing absorption by measuring how far the best-fit DLA+IGM model lies below the IGM-only model relative to the error spectrum. Using this metric, three galaxies (REBELS-08, REBELS-29, and REBELS-38) show detections at > 3σ, while the remaining three sources have lower-S/N detections in the range ∼1.7–2.7σ (Table 1). In Appendix B, we explore the impact of treating the lower-S/N detections as upper limits, where we retain the best-fit column densities for the three more robust detections and adopt the 3σ upper limits for the others.
For clarity, we summarise the tests used to assess the DLA modelling and define the final sample:
-
Fiducial fits: We first fit DLA models to the integrated spectra of all 12 galaxies assuming zabs = zgal. Eight sources show improved fits relative to the IGM-only model, while four (REBELS-14, 15, 32, and 39) show insufficient evidence of a DLA under our various assumptions.
-
Free absorber redshift: Allowing zabs to vary reveals two galaxies (REBELS-12 and REBELS-18) that mildly prefer zabs < zgal, suggesting possible foreground absorption. These two sources are therefore excluded from the subsequent analysis.
-
Lyα emission test: Including Lyα emission for the three known Lyα emitters (REBELS-14, 15, and 39) does not improve the fits and their inferred NH I values remain consistent with zero.
-
Clump tests: Fitting DLA models to spectra extracted from individual clumps yields column densities broadly consistent with the integrated values.
-
Final sample: After excluding the two foreground candidates and four non-detections, the final sample consists of six galaxies (REBELS-05, 08, 25, 29, 34, and 38) where we obtain NH I values from DLA fitting of the integrated spectra with fixed zabs = zgal. Of these, three (REBELS-08, REBELS-29, and REBELS-38) show > 3σ DLA detections, while the remaining three have lower-significance detections (∼1.7–2.7σ).
3.2. Atomic gas masses
In this work, we focus on estimates of the atomic (H I) gas mass. As noted in Section 1, the [C II]158 μm line is an oft-used tracer of atomic and/or molecular gas reservoirs within galaxies (e.g. Pallottini et al. 2017; Vallini et al. 2017; Pineda et al. 2013; Zanella et al. 2018; Lebouteiller et al. 2019; Madden et al. 2020; Vizgan et al. 2022; Casavecchia et al. 2025). Since both atomic and molecular gas fuel star formation, [C II] can also trace star formation, although whether its luminosity correlates more fundamentally with gas mass or with the star formation rate remains debated (e.g. Peng et al. 2025). More broadly, there remains debate over whether atomic or molecular gas dominates the overall gas budget in the early Universe, and consequently what [C II] effectively traces (e.g. Obreschkow & Rawlings 2009; Vallini et al. 2015; Tacconi et al. 2018; Ferrara et al. 2019; Pallottini et al. 2019; Chowdhury et al. 2022; Vizgan et al. 2022; Casavecchia et al. 2025). We therefore proceeded by comparing L[C II]-based methods for estimating the H I masses in our sample with an independent, DLA-based method (see also Heintz et al. 2024a; D’Eugenio et al. 2024). We comment further on these caveats in Section 4.1 and Appendix C:
(i) The first method estimates H I masses from the column densities (NHI) inferred through the DLA fitting described in Section 3.1, which represents the integrated H I abundance in the line of sight. We assume a uniform spherical distribution of neutral gas within/around each galaxy, and compute the mass as
 (4)
(4)
where re is the measured effective radius of each galaxy, NHI is the H I column density, and mH the mass of a hydrogen atom. For this equation, we assume that the effective radius is equivalent to the half-mass radius, such that the total radius, R = 21/3re, and the additional factor of 1.3 stems from a conversion between the projected 2D effective radius and the 3D half-mass radius for a uniform sphere (i.e. assuming q0 = 1 in the models of Price et al. 2022).
Ideally, we would use the effective radius of the HI distribution for re. Since this quantity is not directly observable, we instead adopt the radii derived from the [C II] emission and investigate the assumption that re,H I = re,[C II]. To obtain these [C II] radii, we fit convolved Sérsic models to the higher spatial resolution (beam FWHM 0.7–3 kpc) [C II] observations of REBELS-05, –08, –25, –29, and –38 (Phillips et al., in prep., see Rowland et al. 2024 for REBELS-25). These sizes derived in the image plane range from ∼2 − 3 kpc. A complete analysis of the sizes and morphologies of this sample, also from fitting in the uv-plane, will be presented in a forthcoming work (Astles et al., in prep.). For the remaining source without a high resolution follow-up [C II] data (REBELS-34), we fit an exponential profile to the REBELS ALMA LP observations (resolution ∼7 kpc), with the caveat that this source is barely resolved and the morphology is likely very beam-dependent.
(ii) The second method uses a metallicity-dependent conversion between [C II] luminosity and H I gas mass from Heintz et al. (2021), given by
![Mathematical equation: $$ \begin{aligned} \log M_{\mathrm{HI} , \ [\mathrm{C} ii ]} = (-0.87 \pm 0.09) \times \log (Z/Z_\odot ) + (1.48 \pm 0.12) + \log L_{\mathrm{[CII]} }, \end{aligned} $$](/articles/aa/full_html/2026/06/aa57654-25/aa57654-25-eq35.gif) (5)
(5)
where Z/Z⊙ is the gas-phase metallicity relative to solar and MHI and L[CII] are in units of M⊙ and L⊙, respectively. This relation is calibrated on the direct measurements of the [C II]-to-H I conversion factor in star-forming galaxies at 2.19 ≤ z ≤ 4.99 using γ-ray burst afterglows, and most importantly captures the trend of decreasing [C II] luminosity per unit gas mass at lower metallicities. This empirical relation has also been reproduced in simulations (Vizgan et al. 2022; Casavecchia et al. 2025), corroborating its applicability. The resulting neutral gas masses, which we denote as MHI, [C II], are listed in Table 1 based on [C II] luminosities taken from Bouwens et al. (2022) and Schouws et al. (in prep.).
For method (ii), which is dependent on L[CII], we note that there is substantial scatter in the literature regarding the conversion factor between L[CII] and gas mass. In recent years, there have also been a number of studies on the dependencies of this conversion factor with metallicity, redshift, and other ISM conditions. While the Heintz et al. (2021) calibration is adopted as our fiducial approach for estimating MHI from [C II], we compare this against other metallicity- or redshift-dependent prescriptions based on cosmological simulations (Vizgan et al. 2022; Casavecchia et al. 2025; Vallini et al. 2025; Khatri et al. 2025) and analytical models (Ferrara et al. 2019) in Section 4.1 and Appendix C. In Appendix C, we also make some comparisons with calibrations that adopt a fixed conversion factor between L[CII] and either the atomic (MH I), molecular (MH2) or total gas mass (such as Zanella et al. 2018), but such assumptions likely oversimplify the evolving ISM conditions in the early Universe.
To test these H I mass estimates, this work would benefit from dynamical mass measurements for all galaxies in the sample. Currently, only REBELS-25 has such a constraint ( ; Rowland et al. 2024), which, when compared with its latest stellar mass from JWST SED fitting (M* ∼ 2 × 10⁹ M⊙, Rowland et al. 2026), implies a total gas reservoir of the order of 1011 M⊙. The H I masses inferred from both L[CII] and DLA fitting therefore lie within the allowed dynamical budget, although we note that the gas fraction implied from the kinematics and the stellar mass from the integrated SED fitting is higher than expected for its relatively high metallicity (see Algera et al. 2026).
3.3. Dust masses
The dust masses used in this work were derived in Algera et al. (2026), with the methodology described in detail therein. In summary, ten out of the twelve REBELS-IFU sources are detected in ALMA Band 6 continuum emission, probing rest-frame ∼160 μm (Inami et al. 2022). For the two non-detections (REBELS-15 and REBELS-34), we adopt 3σ upper limits based on the σrms noise of the continuum images. For all single-band detections, dust masses are inferred assuming a modified blackbody with a fixed dust temperature of Tdust = 45 ± 15 K (consistent with Sommovigo et al. 2022) and an emissivity index of βIR = 2.0.
Two galaxies in the sample have dust continuum detections in multiple ALMA bands, enabling more robust constraints. REBELS-25 has constraints in six ALMA bands, providing well-constrained values for its dust mass, temperature, and emissivity index (Algera et al. 2024a). REBELS-38 is detected in Bands 6 and 8, allowing for a dual-band measurement (Algera et al. 2024b). For these two sources we adopt the dust masses and temperatures measured directly from the multi-band fits, which give lower Tdust ∼ 30–35 K compared to the assumed 45 K of the rest of the sample. As a result, REBELS-25 and REBELS-38 are inferred to be significantly more dust-rich, with dust masses higher by ∼0.4 dex than what would be obtained under the fixed Tdust assumption. Across the sample, the dust masses span log(Mdust/M⊙)∼7.0–8.2, with most of the single-band detections falling in a narrower range of ∼7.0–7.3. The dominant source of uncertainty arises from the poorly constrained dust temperatures, for which an uncertainty of ±15 K is propagated through for the Mdust measurements.
Dust masses for the REBELS sample have also been estimated using alternative methods, e.g. as in Ferrara et al. (2022), Sommovigo et al. (2022), Dayal et al. (2022). Overall, the scatter between different methods corresponds to an uncertainty of ∼0.2 − 0.4 dex on individual dust masses.
4. Results and discussions
4.1. Linking [C II] emission and damped Lyα profiles
For the first time at z > 6, we are able to directly compare the [C II] emission, a common tracer of cold neutral and molecular gas in high-z galaxies, with H I column densities derived from damped Lyα wings. The use of NH I as a tracer of neutral gas within galaxies is already established out to z ≲ 5 (e.g. Tepper-García 2006; Péroux & Howk 2020). If [C II] is an effective tracer of HI within a galaxy, and if the DLA features in this z > 6 sample are indeed predominantly caused by neutral gas within the galaxy itself, we would expect these properties to be correlated, with an additional dependence on the size of the gas reservoir, and likely also on the metallicity or redshift of the source for the L[CII]-to-Mgas conversions. To encapsulate these additional dependencies, we present a comparison between MHI, [C II] (∝ L[C II] Z−α, where α = 0.87 in Heintz et al. 2021) and MHI, DLA ( ) in the left panel of Figure 3. In this figure, we show the six REBELS-IFU sources with evidence of a DLA, and we also plot the results obtained from a similar analysis of A1689-zD1 from Heintz et al. (2025) and results inferred from the [C II] upper limits of JADES-GS-z14-0 (Schouws et al. 2025) and its DLA fitting presented in Heintz et al. (2025).
 |
Fig. 3. Comparison between the H I gas mass inferred from damped Lyα absorption wings (MH I, DLA) and from [C II] luminosities (MH I, [C II]) using calibrations from Heintz et al. (2021) (left), Casavecchia et al. (2025) (centre) and Vizgan et al. (2022) (right) for the REBELS-IFU sample with DLA detections. Each REBELS galaxy is shown with a unique marker. We also plot A1689-zD1 at z = 7.13 from Heintz et al. (2025) (yellow star) and JADES-GS-z14-0 at z = 14.18 from Heintz et al. (2025) and Schouws et al. (2025) (yellow square). For JADES-GS-z14-0, we assume re, [C II] = 2 × re,UV, and for A1689-zD1 we determine re, [C II] assuming an exponential profile from the disc diameter reported in Heintz et al. (2025) In each panel, the black dashed line shows the one-to-one relation, which assumes that the H I gas reservoir and the [C II] emission have the same radial extent. The best-fit relation is shown with the solid blue line, with the shaded region indicating the 1σ uncertainty on the fit. The dotted line shows the average offset in log space for the fiducial MH I, [C II], corresponding to a geometric mean mass ratio of MH I, [C II] ≃ 15 × MH I, DLA. This implies a typical radius ratio of rH I ≃ 4 × r[C II]. Markers outlined in bold use the [C II] radii derived from Sérsic fitting to high resolution (beam FWHM ∼ 0.7 − 3 kpc) data. |
We also plot a comparison with two additional L[CII]-to-MH I calibrations in the middle and right panels of Figure 3 (from Casavecchia et al. 2025 and Vizgan et al. 2022, respectively), and in Appendix C we compare with L[CII] calibrations to molecular gas mass and total gas mass. The Casavecchia et al. (2025) relation depends on L[CII] and z, and is derived from the COLDSIM hydrodynamic simulations. The Vizgan et al. (2022) relation depends only on L[CII], and is derived using the SIMBA simulations. In both works, the L[CII]-to-MH I conversion factors are also found to be dependent on other galactic properties, particularly the metallicity, which is why we opt to use a metallicity-dependent calibration (Heintz et al. 2021) for the fiducial values (see Section 3.2).
For the Heintz et al. (2021) calibrated atomic gas masses, a moderate correlation (Pearson correlation coefficient = 0.66) is found between these two different H I gas mass estimates. However, the relation is not statistically significant (p-value = 0.1). The small sample size and dynamic range thereby limit our ability to draw firm conclusions, but this tentative relation could indeed indicate that the damping wing and [C II] emission originate from the same neutral gas reservoir within this sample. Consistently with this picture, Gelli et al. (2025) show from the SERRA simulations that DLAs with NHI ∼ 1021 cm−2 can arise from dense neutral gas within galaxies, predominantly from the ISM. However, these simulations also demonstrate that such high column densities are sight-line dependent, highlighting a caveat of our simplified geometric assumptions.
We also find that the MHI, DLA values are on average a factor of ∼15× lower than the fiducial MHI, [C II] values based on the Heintz et al. (2021) calibration. If the [C II]-based H I masses are not an overestimate (however, see the discussion below and e.g. Heintz et al. 2023b; Palla et al. 2024), this would imply that the radii of the H I gas reservoirs would need to be a factor of ∼4× larger than the [C II] radii (r[CII]) derived in this work. This estimate depends on the assumed geometry, for which we have adopted a very simplistic scenario, as well as on the L[CII]–MHI calibration used, and should therefore be regarded only as rough indications of the relative extent of the H I gas.
To assess the effect of the calibration used, we compare with the Casavecchia et al. (2025) and Vizgan et al. (2022) calibrations. We find a similar range in the MHI, [C II] values as the Heintz et al. (2021) calibration (Figure 3) and also find moderate correlations between MHI, [C II] and MHI, DLA (both Pearson correlation coefficients ∼0.7), but these correlations are also not statistically significant (p-values 0.08 and 0.1, respectively). These calibrations result in MHI, [C II] values that are, on average, 13× and 17× larger than the MHI, DLA values, respectively. These three calibrations therefore each find that the H I gas reservoir would need to be about three to four times more extended than the [C II] emission, with our assumed geometry.
Alternatively, it is possible that these L[CII]-based calibrations may be overestimating MHI, [C II]. For example, Palla et al. (2024) find that it is not possible to simultaneously reproduce the observed DTS and DTG mass ratios of REBELS galaxies using the Heintz et al. (2021) relation, suggesting a discrepancy in these estimates that could be explained if the gas masses are overestimated. Additionally, Heintz et al. (2024a) find that the gas mass of JADES-GS-z14-0 inferred from this calibration is in tension with the inferred dynamical mass, although they caution that the dynamical estimates are uncertain (see also a higher Mdyn estimate from Scholtz et al. 2025). As discussed in Section 3.2, we find no such tension between MHI and Mdyn for REBELS-25, the only REBELS-IFU source with well-resolved kinematics currently available (Rowland et al. 2024). Further tests of these mass estimates will be possible with upcoming dynamical constraints for additional REBELS-IFU sources (Phillips et al., in prep.). In Appendix C, we also derive total and molecular gas masses using several alternative calibrations. While these yield a wide range of values, across all calibrations we consistently find Mgas, [C II] > MHI, DLA.
The assumed geometry likely has a larger impact on this result. For example, assuming a thin shell of H I gas around the galaxy at some radius, Rsh, which we can again assume to be at 1.3 re, [C II], results in an absorbing area of ![Mathematical equation: $ 4\pi \cdot 1.3^2 r_{e,[\mathrm{C}{\small { {\text{ II}}}}]}^{2} $](/articles/aa/full_html/2026/06/aa57654-25/aa57654-25-eq38.gif) . The resulting MHI, DLA values would therefore be a factor of ∼2× larger, and the inferred rH I radii would be three times more extended than the [C II] emission. In contrast, if we are biased towards higher density sight lines with our NH I measurements (e.g. Gelli et al. 2025), the MHI, DLA values would be overestimated.
. The resulting MHI, DLA values would therefore be a factor of ∼2× larger, and the inferred rH I radii would be three times more extended than the [C II] emission. In contrast, if we are biased towards higher density sight lines with our NH I measurements (e.g. Gelli et al. 2025), the MHI, DLA values would be overestimated.
For this range of calibrations and assumed geometries, we can still therefore conclude that the H I reservoirs are likely to be more extended than the [C II] radii. For the REBELS sample, it has also been found that the [C II] emission itself extends beyond the UV emission (Fudamoto et al. 2022, Astles et al., in prep.). Taken together, this supports a scenario where the typical central UV star-forming regions in these galaxies are embedded within a larger neutral, atomic gas reservoir that also extends beyond the [C II]-emitting region.
Indeed, several studies have shown that at high redshift, [C II] emission is typically more extended than the rest-frame UV continuum, with [C II] sizes exceeding UV sizes by factors of ≳2 (e.g. Carniani et al. 2018; Fudamoto et al. 2022; Fujimoto et al. 2020; Ikeda et al. 2025). Ikeda et al. (2025) further reported a negative correlation between [C II] surface density and Lyα equivalent width, and a tentative anti-correlation between re, [CII]/re, UV and Lyα equivalent width, together suggesting that [C II] traces a more extended atomic gas component.
Comparisons with other cold gas tracers at low redshift also show that [C II] generally occupies an intermediate scale: more extended than CO but more compact than H I (de Blok et al. 2016; Péroux et al. 2019; Szakacs et al. 2021). In this context, it is plausible that only the central part of the extended H I reservoir has been significantly metal-enriched, such that [C II] emission arises only from this enriched inner region, while the more extended outer layer remains relatively metal-poor and therefore faint in [C II]. Under this assumption, deriving H I masses by equating the radial extent of the H I with that of the [C II] emission will underestimate the total H I mass that is probed by the DLA absorption.
This picture also provides a useful contrast to absorption-selected studies; for example, Wolfe et al. (2004) used C II* absorption to infer [C II] emission and derived very low star formation surface densities (ΣSFR ∼ 10−3–10−2 M⊙ yr−1 kpc−2). Such values are far below those we infer for the REBELS galaxies (ΣSFR ∼ 10 M⊙ yr−1 kpc−2; Komarova et al. 2025) and the difference can be understood as a consequence of the regions probed. In absorption-selected studies, the background quasar sight lines most often intersect the relatively unobscured outer ISM and CGM of the foreground galaxy, where the [C II] emission is likely faint, missing the more central, dusty, star-forming ISM.
We illustrated a simplified schematic of these findings in the left panel of Figure 1, where we indicated three concentric spherical regions: a central UV-emitting region, surrounded by an extended [C II]-emitting region, all embedded in a more extended H I gas reservoir. We note that in this model and the assumptions of this work, we do not attempt to separate the ISM and CGM. The boundaries between these regions, and the IGM, are not static, and material can mix or be redistributed through inflows, outflows, and environmental interactions. Indeed, across the literature the distinction between the ISM and CGM is not well-defined (Tumlinson et al. 2017). The [C II] radii derived for this sample are of the order of a few kpc (Section 3.2; see Astles, in prep., for further details), which would suggest that the [C II] emission is primarily originating from the ISM. Our analysis indicates that the neutral gas reservoir traced by the DLA absorption may extend to larger radii beyond the [C II] emission, and may therefore probe the ISM and/or CGM. However, as discussed in the next section, we find ISM-like DTG ratios, as traced by AV/NH I, which suggests that the absorbing gas is enriched and likely associated with material processed within the ISM, even if it extends beyond the central star-forming regions.
4.2. Dust-to-gas mass ratios
In this section, we use the attenuation and H I column densities measured for our sample (listed in Table 1) to infer the DTG ratios along the line of sight, as traced by the ratio AV/NH I. These measurements allow us to place the REBELS-IFU galaxies in the broader context of dust enrichment by comparing their inferred ratios with those observed in other z > 6 galaxies and in lower redshift systems. For the REBELS-IFU sources, we find values ranging from 0.5 − 4 × 10⁻²² mag cm2, which are broadly consistent with values measured at lower redshift, including those observed along some sight lines in the ISM of the Milky Way (MW), Large Magellanic Cloud (LMC), and Small Magellanic Cloud (SMC). These ISM-like DTG ratios, together with the tentative correlation between MH I DLA and MH I [C II], may therefore support that both the [C II] emission and DLA absorption are tracing the same enriched material within the ISM and inner CGM of these galaxies.
With tentative evidence to support the notion that the damped Lyα wings in this sample of high-z galaxies arise from neutral gas within the galaxies themselves, one might expect a correlation between their DTG mass ratios derived from ALMA observations (using L[C II] to determine the gas mass, and the FIR continuum to trace the dust mass) and those inferred along the line of sight via AV/NH I. This underlying assumption, namely, that the same gas reservoir traced by [C II] and dust traced by FIR emission also produces the DLA absorption and stellar attenuation, is illustrated schematically in Figure 1.
The left panel of Figure 4 shows this comparison for the six galaxies in this study with successful DLA fits, as well as an additional z > 6 source with similar measurements from the literature (A1689-zD1 at z = 7.13 from Heintz et al. 2025). No clear trend is observed between these two DTG tracers, regardless of whether we adopted method (ii) for converting L[C II] to MH I (Section 3.2) or the alternative calibrations discussed in Section 3.2 and Appendix C, and regardless of whether we adopted the dust masses from Algera et al. (2026) (as plotted in Figure 4), Dayal et al. (2022), Ferrara et al. (2022) or Sommovigo et al. (2022). However, as discussed in Sections 3.2 and 3.3, there are considerable uncertainties in the FIR-based mass measurements. We also note that we only considered the H I mass, without taking into account contributions from molecular gas to the total gas mass. As discussed in Section 3.2, the relative contribution of atomic and molecular gas to the total gas budget, and to the observed [C II] emission, is uncertain at high-z.
 |
Fig. 4. Left: Comparison between the DTG mass ratios derived from ALMA observations (using L[C II] to estimate the H I mass and the FIR continuum to infer dust mass) and from DLA-based measurements (AV/NH I) for the REBELS-IFU galaxies with DLA detections and for A1689-zD1 (Heintz et al. 2025). In both panels, the same marker shapes are used as in the legend of Figure 3. REBELS-34 has an upper limit on the dust mass since it is undetected in Band 6 continuum from the REBELS ALMA LP. No clear trend is observed between these two DTG estimates for this sample. We also plot for reference the average values from different sight lines in the MW, LMC, and SMC from Konstantopoulou et al. (2024) and references therein, where we adopt their AV, ext values derived from SED fitting and convert their total gas masses to H I masses using the conversions given in the legend taken from Table 6 of Israel (1997). Right: Relation between log(AV/NH I) and gas-phase metallicity (12 + log(O/H)) for the REBELS-IFU sample and a compilation of eleven additional z ≳ 6 galaxies from the literature (circle markers), with markers coloured by redshift. The best-fit linear relation is shown via the black solid line, with a shaded region representing the 1σ uncertainty. A strong correlation is found (Pearson r = 0.7, p = 1 × 10⁻³), with a consistent slope to the trend reported in Heintz et al. (2023a) based on GRB sight lines at z = 1.7 − 6.3 (black dashed line) and the slope from a linear fit to the data presented in Konstantopoulou et al. (2024) for the MW, LMC, and SMC. |
Although we do note tentative evidence of a correlation between MH I and NH I × R2 earlier in this work, we do not find an analogous trend between Mdust and AV × R2 (following the assumption in Carniani et al. 2024) for this sample. This outcome is perhaps unsurprising given the well-known limitations of both methods and the small sample sizes considered here. On the FIR side, estimating Mdust from single-band continuum detections carries large uncertainties (see Section 3.3 and references therein). Similarly, interpreting AV as a direct tracer of the total dust mass is complicated by unknown dust–star geometry effects.
The lack of a clear correlation between the FIR-based and DLA-based DTG tracers also mirrors discrepancies reported in studies at lower redshifts. For example, Roman-Duval et al. (2022) compared DLA-based DTG ratios (derived from elemental depletion patterns such as [Zn/Fe]) with FIR-based DTG values and found systematic offsets. Konstantopoulou et al. (2024) argue that such discrepancies are likely rooted in the fact that FIR and DLA observations may probe distinct ISM phases, with FIR emission tracing the densest star-forming clouds and DLAs probing more diffuse gas. The finding in Figure 3 discussed in Section 4.1 that MH I DLA < MH I, [C II] may tentatively support this, since this could be interpreted as the H I gas reservoir being more extended than the [C II] emission. Other DTG studies have also reported discrepancies related to systematic differences between studies using absorption- and emission-line spectroscopy (Hamanowicz et al. 2020; Clark et al. 2023; Park et al. 2024; Hamanowicz et al. 2024).
As discussed in Section 1, measuring the ratios between dust, gas, stellar, and metal masses across a broad galaxy sample provides key insights into the buildup of dust over cosmic time. At low redshift, strong DTG–metallicity correlations are well established, both in the local Universe (Rémy-Ruyer et al. 2014; De Vis et al. 2019; Galliano et al. 2021) and at intermediate redshifts z ≃ 1 − 5 (Péroux & Howk 2020; Shapley et al. 2020; Popping & Péroux 2022). At higher redshifts, most theoretical models of early dust enrichment also predict near-linear relations between DTG and metallicity, although the slope and normalisation depend on the prescriptions assumed for supernovae (SNe) dust production, AGB stars, grain growth, and dust destruction (e.g. Popping et al. 2017; Vijayan et al. 2019; Triani et al. 2020; Dayal et al. 2022; Palla et al. 2024). Observationally, however, evidence to support such correlations at z > 6 remains weak in current ALMA-based studies, given the limited sample sizes and large uncertainties. In particular, a recent study of the same REBELS-IFU sample (Algera et al. 2026, notably one of the first z > 6 DTG and DTM studies), combined with a small number of additional z ≳ 6 galaxies from the literature, found no clear trend between the DTG ratio and the metallicity of the galaxies when the dust and gas masses were derived from FIR-based detections. However, as discussed therein, this could be driven by the narrow metallicity range probed, the large uncertainties of single-band Mdust estimates, and the limited sample size. Extending observational constraints to a wider range of stellar masses and metallicities is therefore essential for testing these models and advancing our understanding of dust buildup in the early Universe.
If we cautiously proceed with the assumption that AV/NH I can be used as a proxy for the integrated DTG mass ratio, this approach offers a key advantage over FIR tracers: it is more readily accessible in low-mass, metal-poor galaxies, namely, the typical population at high redshifts. At low stellar masses (and therefore metallicities), detections of [C II] and dust continuum become increasingly more challenging. At z > 6, such FIR detections are generally limited to galaxies with log(M*/M⊙)≳9, with the exception of a handful of lensed sources probing lower masses (e.g. Heintz et al. 2023b; Fujimoto et al. 2025). This limited dynamic range in both stellar mass and metallicity makes it challenging to test theoretical models of dust formation and evolution at early cosmic times. Therefore, by combining the AV/NH I ratios derived in this work with similarly derived ratios from the literature for lower mass sources at z > 6, we can extend the DTG and metallicity study of Algera et al. (2026) over a ∼2 dex range in oxygen abundance, as shown in the right panel of Figure 4. The literature data points are selected from Watson et al. (2015), Heintz et al. (2023a), Saccardi et al. (2023), D’Eugenio et al. (2024), Hainline et al. (2024), Heintz et al. (2025), Witstok et al. (2026) and comprise, to the best of our knowledge, all z > 6 sources with published NHI, AV, and 12 + log(O/H) values. In these studies, NH I values are either derived from SED fitting to the full UV spectrum or via a similar DLA fitting as done in this work, and metallicities are derived via nebular emission lines from the galaxy itself (as in this work), or from absorption lines along the line of sight.
A strong correlation emerges between AV/NH I and 12 + log(O/H), with a Pearson correlation coefficient of 0.7 and a p-value of 1 × 10⁻³, when combining the REBELS-IFU sample with the additional eleven sources collected from the literature, which mostly have lower metallicities. If we restrict our AV/NHI comparison to only the REBELS-IFU galaxies (10/13 of the sources in Algera et al. 2026), our AV/NH I analysis yields no statistically significant correlation with metallicity, supporting that the lack of correlation in Algera et al. (2026) may indeed be due to the small sample size and lack of dynamic range of the FIR-based measurements.
The best-fit line in the right panel of Figure 4 is given by
![Mathematical equation: $$ \begin{aligned} \log \left(\frac{A_V}{N_{\mathrm{H} i }}\right) = (0.8 \pm 0.2) \times \left[12 + \log (\mathrm{O} /\mathrm{H} )\right] - (29 \pm 2). \end{aligned} $$](/articles/aa/full_html/2026/06/aa57654-25/aa57654-25-eq39.gif) (6)
(6)
A quantitatively consistent slope is also found in Heintz et al. (2023a) based on γ-ray burst sight lines through star forming galaxies at z = 1.7 − 6.3 (dashed black line in the right panel of Figure 4) and for the MW, LMC, and SMC in Konstantopoulou et al. (2024) (dotted black line). This consistency in slope across redshift could suggest a common dust production mechanism acting from z ∼ 0 − 8. For example, models predict an approximately linear relation if SNe dominate dust production (which is expected at high redshift due to the short timescales on which they act, e.g, Todini & Ferrara 2001). At higher metallicities (12 + log(O/H) ≳ 8), grain growth in the ISM should steepen the relation (e.g. Asano et al. 2013; Rémy-Ruyer et al. 2014; Zhukovska 2014; Galliano et al. 2021). This turnover is not clearly seen in the right panel of Figure 4, nor in the Heintz et al. (2023a) and Konstantopoulou et al. (2024) samples (although we note there is limited sampling at the metal-rich end), nor in DLA measurements in Péroux & Howk (2020) at z ≃ 1 − 5. However, as discussed above and in Algera et al. (2026), this discrepancy could be related to systematic differences between studies using absorption- and emission-line spectroscopy (e.g. Hamanowicz et al. 2020; Clark et al. 2023; Park et al. 2024; Konstantopoulou et al. 2024; Hamanowicz et al. 2024).
Although the slope of the relation appears relatively consistent across redshift, the normalisation differs. For the REBELS-IFU sample at z ∼ 6.5–7.7, we find AV/NH I values broadly consistent with those of z < 6 galaxies at fixed metallicity, suggesting that their ISM is already relatively evolved, consistent with other evidence that the REBELS sample represents a population of evolved, dusty, metal-rich galaxies (Rowland et al. 2026; Algera et al. 2024b, 2026; Endsley et al. 2026). However, when considering the full z ∼ 6–14 sample and the relations at 1.7 ≲ z ≲ 6.3 and z ∼ 0, we find that the normalisation of the AV/NH I–metallicity relation may decrease with increasing redshift, implying progressively lower DTG ratios in galaxies at earlier cosmic times. This finding could be impacted by sight-line biases: AV/NH I is measured along narrow beams and may not capture the global dust–gas distribution. Morphology, dust–star geometry, and metal mixing within the ISM can each bias line-of-sight attenuation estimates. Indeed, spatially resolved studies of nearby galaxies show that DTG can vary by more than an order of magnitude with resolved ISM properties (Clark et al. 2023; Park et al. 2024). If the trend is real, however, it could signal intrinsic evolution of the DTG–metallicity relation with redshift. One possibility is that the neutral gas traced by DLAs is systematically more metal-poor than the ionised gas used for emission-line metallicity estimates, perhaps due to pristine IGM accretion (as suggested in Heintz et al. 2025). Another possibility is preferential dust expulsion by feedback or radiation pressure in early galaxies (Ferrara et al. 2025), consistent with the low attenuation inferred for many z > 10 systems.
Ultimately, robust constraints on DTG ratios across cosmic time will require much larger samples spanning a broad mass–metallicity range, with multi-band FIR data and high-S/N UV/optical spectra to robustly constrain Mdust, Mgas, AV, and NH I. While such datasets remain rare, the REBELS-IFU sample provides an important first step in making these comparisons at z > 6. Future deep ALMA programs and high-resolution UV spectroscopy will be essential to further extend these studies.
5. Summary and conclusions
In this work, we analysed JWST/NIRSpec prism spectra of 12 UV-luminous galaxies from the REBELS-IFU sample at z ∼ 6.5 − 7.7 to investigate their neutral gas reservoirs via Lyα damping wing absorption. For 8 out of the 12 sources, we find that DLAs with H I column densities NH I ≳ 1021 cm−2 are required to explain the observed UV profiles redwards of Lyα. We modelled these DLAs by accounting for both absorption from the IGM (following Heintz et al. 2024b; Miralda-Escude 1998; Totani et al. 2006) with an average neutral hydrogen fraction in the IGM of xH I = 0.33 (Mason et al. 2026), and also absorption from additional neutral hydrogen along the line of sight. We fixed the redshift of this absorber to the galaxy redshift, assuming that the high column densities inferred arise from H I gas in or around the galaxies themselves (ISM and CGM).
For the first time, we are able to investigate correlations between H I column densities and [C II] emission within galaxies in the EoR. By assuming simple spherical geometry, we estimated the mass of neutral gas implied by these column densities within radii equivalent to the extent of the [C II] emission and we compared these DLA-derived H I gas masses (MH I,DLA) to H I masses derived from the integrated [C II] luminosities (Figure 3).
By combining these two probes of the neutral gas mass with probes of the dust content within these galaxies, we also compared the FIR-based DTG ratios with AV/NH I, which we used to trace the DTG ratio along the line of sight (left panel of Figure 4). By compiling values of AV/NH I at z > 6 in the literature, we also extended high-z DTG-metallicity relations over a ∼2 dex range in oxygen abundance.
The key results of this analysis are as follows.
-
We find tentative evidence to support that the neutral gas traced by the DLA and the [C II] emission of massive high-z star-forming galaxies are related and might be tracing the same neutral gas reservoir within the ISM and CGM of these galaxies.
-
Whilst there are significant caveats and uncertainties involved in estimating H I gas masses from both [C II] emission and NH I, our results suggest that [C II] emission is less extended than the H I gas (by a factor of ∼4, although this factor is dependent on the L[C II]-to-MH I calibration used and the assumed geometry) in these galaxies. This is qualitatively consistent with expectations from lower redshift studies (e.g. de Blok et al. 2016).
-
We see no correlation between the FIR emission-based DTG ratios and AV/NH I for the REBELS-IFU sample at z > 6, although we are limited by the small sample size and the uncertainties in the derived properties.
-
The REBELS-IFU sample exhibits comparable metallicities and AV/NH I values with sources at lower redshifts, consistent with other findings that the REBELS-IFU sample represents an evolved sample of massive z ∼ 7 galaxies that already host an enriched ISM with substantial dust and gas reservoirs.
-
We find a strong correlation between log(AV/NH I) and 12 + log(O/H) when combining the REBELS-IFU sample with additional, lower metallicity z > 6 sources from the literature. This near-linear correlation is consistent with expectations from theoretical models of early dust buildup being predominantly driven by SNe (although we cannot rule out significant contribution from efficient ISM grain growth).
-
We see potential evidence of a redshift evolution in the DTG-metallicity relation, with higher-z sources exhibiting lower AV/NH I values for the same metallicity (although see earlier points on potential sight-line biases). If real, this could carry a number of interpretations, including that the gas traced by NH I might contain significant amounts of pristine neutral gas accreted from IGM, and/or more efficient dust destruction and expulsion at high-z. Larger samples and more detailed modelling would be necessary to solidify these findings and test these interpretations.
Overall, our results highlight that the massive REBELS-IFU galaxies at z ∼ 7 already host substantial and chemically enriched reservoirs of neutral gas and dust, with their UV-bright star-forming regions embedded within more extended atomic gas distributions. This has established Lyα damping wing fitting as a promising avenue for probing the neutral ISM and CGM in the early Universe, but the present analysis is limited by the modest S/N and spectral resolution of the NIRSpec prism data, as well as by the small sample size. Future progress will require higher-resolution, higher S/N spectroscopy to better resolve the damping wing profiles, alongside larger samples to test the diversity of neutral gas conditions across galaxy populations. Complementary constraints from resolved [C II] and other FIR lines, as well as dynamical mass measurements, will be crucial for breaking remaining degeneracies and for building a comprehensive picture of how gas, metals, and dust co-evolve in the first billion years.
Acknowledgments
The authors would like to thank the anonymous referee, whose comments helped to strengthen this manuscript. LR acknowledges support from the DAWN Visiting Programme, which funded a research visit to the Cosmic Dawn Center (DAWN) that initiated this work. JH acknowledges support from the ERC Consolidator Grant 101088676 (VOYAJ). JAH acknowledges support from the ERC Consolidator Grant 101088676 (VOYAJ). P. Dayal warmly acknowledges support from an NSERC discovery grant (RGPIN-2025-06182). MA is supported by FONDECYT grant number 1252054, and gratefully acknowledges support from ANID Basal Project FB210003, ANID MILENIO NCN2024_112 and ANID + Vinculación Internacional + FOVI250261. V.G gratefully acknowledges support from ANID/CONICYT + FONDECYT Regular 1221310 and by the ANID BASAL project FB210003. This work is based on observations made with the NASA/ESA/CSA JWST. The data were obtained from the Mikulski Archive for Space Telescopes at the Space Telescope Science Institute, which is operated by the Association of Universities for Research in Astronomy, Inc., under NASA contract NAS 5-03127 for JWST. These observations are associated with programs #1626 and #2659. This paper made use of the following software packages: Astropy (Astropy Collaboration 2022), Matplotlib (Hunter 2007), NumPy (Harris et al. 2020), SciPy (Virtanen et al. 2020), spectral-cube (Ginsburg et al. 2019), APLpy (Robitaille & Bressert 2012), and astrodendro (http://www.dendrograms.org/).
References
- Algera, H. S. B., Inami, H., De Looze, I., et al. 2024a, MNRAS, 533, 3098 [NASA ADS] [CrossRef] [Google Scholar]
- Algera, H. S. B., Inami, H., Sommovigo, L., et al. 2024b, MNRAS, 527, 6867 [Google Scholar]
- Algera, H. S. B., Rowland, L., Stefanon, M., et al. 2026, MNRAS, 545, staf1897 [Google Scholar]
- Asada, Y., Desprez, G., Willott, C. J., et al. 2025, ApJ, 983, L2 [Google Scholar]
- Asano, R. S., Takeuchi, T. T., Hirashita, H., & Inoue, A. K. 2013, Earth Planets Space, 65, 213 [NASA ADS] [CrossRef] [Google Scholar]
- Asplund, M., Grevesse, N., Sauval, A. J., & Scott, P. 2009, ARA&A, 47, 481 [NASA ADS] [CrossRef] [Google Scholar]
- Astropy Collaboration (Price-Whelan, A. M., et al.) 2022, ApJ, 935, 167 [NASA ADS] [CrossRef] [Google Scholar]
- Bouwens, R. J., Smit, R., Schouws, S., et al. 2022, ApJ, 931, 160 [NASA ADS] [CrossRef] [Google Scholar]
- Calzetti, D., Kinney, A. L., & Storchi-Bergmann, T. 1994, ApJ, 429, 582 [Google Scholar]
- Calzetti, D., Armus, L., Bohlin, R. C., et al. 2000, ApJ, 533, 682 [NASA ADS] [CrossRef] [Google Scholar]
- Cameron, A. J., Katz, H., Witten, C., et al. 2024, MNRAS, 534, 523 [NASA ADS] [CrossRef] [Google Scholar]
- Carniani, S., Maiolino, R., Amorin, R., et al. 2018, MNRAS, 478, 1170 [NASA ADS] [CrossRef] [Google Scholar]
- Carniani, S., Hainline, K., D’Eugenio, F., et al. 2024, Nature, 633, 318 [CrossRef] [Google Scholar]
- Casavecchia, B., Maio, U., Péroux, C., & Ciardi, B. 2025, A&A, 693, A119 [NASA ADS] [CrossRef] [EDP Sciences] [Google Scholar]
- Castellano, M., Fontana, A., Treu, T., et al. 2023, ApJ, 948, L14 [NASA ADS] [CrossRef] [Google Scholar]
- Chowdhury, A., Kanekar, N., & Chengalur, J. N. 2022, ApJ, 935, L5 [NASA ADS] [CrossRef] [Google Scholar]
- Clark, C. J. R., Roman-Duval, J. C., Gordon, K. D., et al. 2023, ApJ, 946, 42 [NASA ADS] [CrossRef] [Google Scholar]
- Dayal, P., Ferrara, A., Sommovigo, L., et al. 2022, MNRAS, 512, 989 [NASA ADS] [CrossRef] [Google Scholar]
- de Blok, W. J. G., Walter, F., Smith, J. D. T., et al. 2016, AJ, 152, 51 [NASA ADS] [CrossRef] [Google Scholar]
- De Vis, P., Jones, A., Viaene, S., et al. 2019, A&A, 623, A5 [NASA ADS] [CrossRef] [EDP Sciences] [Google Scholar]
- Dekel, A., Sari, R., & Ceverino, D. 2009, ApJ, 703, 785 [Google Scholar]
- Dekel, A., Sarkar, K. C., Birnboim, Y., Mandelker, N., & Li, Z. 2023, MNRAS, 523, 3201 [NASA ADS] [CrossRef] [Google Scholar]
- D’Eugenio, F., Maiolino, R., Carniani, S., et al. 2024, A&A, 689, A152 [NASA ADS] [CrossRef] [EDP Sciences] [Google Scholar]
- D’Eugenio, F., Cameron, A. J., Scholtz, J., et al. 2025, ApJS, 277, 4 [Google Scholar]
- Endsley, R., Stark, D. P., Bouwens, R. J., et al. 2022, MNRAS, 517, 5642 [NASA ADS] [CrossRef] [Google Scholar]
- Endsley, R., Shapley, A. E., Topping, M. W., et al. 2026, ApJ, 999, 95 [Google Scholar]
- Fernández, X., Gim, H. B., Gorkom, J. H. v., et al. 2016, ApJ, 824, L1 [Google Scholar]
- Ferrara, A. 2024, A&A, 684, A207 [NASA ADS] [CrossRef] [EDP Sciences] [Google Scholar]
- Ferrara, A., Vallini, L., Pallottini, A., et al. 2019, MNRAS, 489, 1 [Google Scholar]
- Ferrara, A., Sommovigo, L., Dayal, P., et al. 2022, MNRAS, 512, 58 [NASA ADS] [CrossRef] [Google Scholar]
- Ferrara, A., Pallottini, A., & Sommovigo, L. 2025, A&A, 694, A286 [NASA ADS] [CrossRef] [EDP Sciences] [Google Scholar]
- Finkelstein, S. L., Bagley, M. B., Ferguson, H. C., et al. 2023, ApJ, 946, L13 [NASA ADS] [CrossRef] [Google Scholar]
- Fisher, R., Bowler, R. A. A., Stefanon, M., et al. 2025, MNRAS, 539, 109 [Google Scholar]
- Fisher, R., Bowler, R. A. A., Cochrane, R. K., et al. 2026, MNRAS, 546, stag049 [Google Scholar]
- Fudamoto, Y., Smit, R., Bowler, R. A. A., et al. 2022, ApJ, 934, 144 [NASA ADS] [CrossRef] [Google Scholar]
- Fujimoto, S., Silverman, J. D., Bethermin, M., et al. 2020, ApJ, 900, 1 [Google Scholar]
- Fujimoto, S., Ouchi, M., Kohno, K., et al. 2025, Nat. Astron., 9, 1553 [Google Scholar]
- Galliano, F., Nersesian, A., Bianchi, S., et al. 2021, A&A, 649, A18 [EDP Sciences] [Google Scholar]
- Gelli, V., Mason, C., Pallottini, A., et al. 2025, A&A, submitted [arXiv:2510.01315] [Google Scholar]
- Ginsburg, A., Koch, E., Robitaille, T., et al. 2019, https://doi.org/10.5281/zenodo.2573901 [Google Scholar]
- Ginzburg, O., Dekel, A., Mandelker, N., & Krumholz, M. R. 2022, MNRAS, 513, 6177 [NASA ADS] [CrossRef] [Google Scholar]
- Hainline, K. N., D’Eugenio, F., Jakobsen, P., et al. 2024, ApJ, 976, 160 [NASA ADS] [CrossRef] [Google Scholar]
- Hamanowicz, A., Péroux, C., Zwaan, M. A., et al. 2020, MNRAS, 492, 2347 [CrossRef] [Google Scholar]
- Hamanowicz, A., Tchernyshyov, K., Roman-Duval, J., et al. 2024, ApJ, 966, 80 [NASA ADS] [CrossRef] [Google Scholar]
- Harikane, Y., Ouchi, M., Oguri, M., et al. 2023, ApJS, 265, 5 [NASA ADS] [CrossRef] [Google Scholar]
- Harris, C. R., Millman, K. J., van der Walt, S. J., et al. 2020, Nature, 585, 357 [NASA ADS] [CrossRef] [Google Scholar]
- Heintz, K. E., Watson, D., Oesch, P. A., Narayanan, D., & Madden, S. C. 2021, ApJ, 922, 147 [NASA ADS] [CrossRef] [Google Scholar]
- Heintz, K. E., De Cia, A., Thöne, C. C., et al. 2023a, A&A, 679, A91 [NASA ADS] [CrossRef] [EDP Sciences] [Google Scholar]
- Heintz, K. E., Giménez-Arteaga, C., Fujimoto, S., et al. 2023b, ApJ, 944, L30 [NASA ADS] [CrossRef] [Google Scholar]
- Heintz, K. E., Watson, D., Brammer, G., et al. 2024, Science, 384, 890 [NASA ADS] [CrossRef] [Google Scholar]
- Heintz, K. E., Bennett, J. S., Oesch, P. A., et al. 2024a, arXiv e-prints [arXiv:2407.06287] [Google Scholar]
- Heintz, K. E., Watson, D., Brammer, G., et al. 2024b, Science, 384, 890 [NASA ADS] [CrossRef] [Google Scholar]
- Heintz, K. E., Pollock, C. L., Witstok, J., et al. 2025, ApJ, 987, L2 [Google Scholar]
- Heintz, K. E., Watson, D., Valentino, F., et al. 2025, arXiv e-prints [arXiv:2510.07936] [Google Scholar]
- Huberty, M., Scarlata, C., Hayes, M. J., & Gazagnes, S. 2025, ApJ, 987, 82 [Google Scholar]
- Hunter, J. D. 2007, Comput. Sci. Eng., 9, 90 [NASA ADS] [CrossRef] [Google Scholar]
- Ikeda, R., Tadaki, K.-I., Mitsuhashi, I., et al. 2025, A&A, 693, A237 [NASA ADS] [CrossRef] [EDP Sciences] [Google Scholar]
- Inami, H., Algera, H. S. B., Schouws, S., et al. 2022, MNRAS, 515, 3126 [NASA ADS] [CrossRef] [Google Scholar]
- Israel, F. P. 1997, A&A, 328, 471 [NASA ADS] [Google Scholar]
- Jakobsson, P., Fynbo, J. P. U., Ledoux, C., et al. 2006, A&A, 460, L13 [NASA ADS] [CrossRef] [EDP Sciences] [Google Scholar]
- Katz, H., Cameron, A. J., Saxena, A., et al. 2025, Open J. Astrophys., 8, 104 [Google Scholar]
- Khatri, P., Romano-Díaz, E., & Porciani, C. 2025, A&A, 697, A174 [NASA ADS] [CrossRef] [EDP Sciences] [Google Scholar]
- Komarova, L., Stefanon, M., Laza-Ramos, A., et al. 2025, arXiv e-prints [arXiv:2511.10743] [Google Scholar]
- Konstantopoulou, C., De Cia, A., Ledoux, C., et al. 2024, A&A, 681, A64 [NASA ADS] [CrossRef] [EDP Sciences] [Google Scholar]
- Kroupa, P. 2001, MNRAS, 322, 231 [NASA ADS] [CrossRef] [Google Scholar]
- Lebouteiller, V., Cormier, D., Madden, S. C., et al. 2019, A&A, 632, A106 [EDP Sciences] [Google Scholar]
- Looze, I. D., Lamperti, I., Saintonge, A., et al. 2020, MNRAS, 496, 3668 [NASA ADS] [CrossRef] [Google Scholar]
- Ma, X., Hopkins, P. F., Faucher-Giguère, C.-A., et al. 2016, MNRAS, 456, 2140 [NASA ADS] [CrossRef] [Google Scholar]
- Madden, S. C., Cormier, D., Hony, S., et al. 2020, A&A, 643, A141 [NASA ADS] [CrossRef] [EDP Sciences] [Google Scholar]
- Marrone, D. P., Spilker, J. S., Hayward, C. C., et al. 2018, Nature, 553, 51 [NASA ADS] [CrossRef] [Google Scholar]
- Mason, C. A., Chen, Z., Stark, D. P., et al. 2026, A&A, 705, A114 [NASA ADS] [CrossRef] [EDP Sciences] [Google Scholar]
- Matteri, A., Pallottini, A., & Ferrara, A. 2025, A&A, 697, A65 [NASA ADS] [CrossRef] [EDP Sciences] [Google Scholar]
- McQuinn, M., Lidz, A., Zaldarriaga, M., Hernquist, L., & Dutta, S. 2008, MNRAS, 388, 1101 [NASA ADS] [Google Scholar]
- Miralda-Escude, J. 1998, ApJ, 501, 15 [CrossRef] [Google Scholar]
- Mirocha, J., & Furlanetto, S. R. 2023, MNRAS, 519, 843 [Google Scholar]
- Naidu, R. P., Oesch, P. A., van Dokkum, P., et al. 2022, ApJ, 940, L14 [NASA ADS] [CrossRef] [Google Scholar]
- Obreschkow, D., & Rawlings, S. 2009, MNRAS, 394, 1857 [NASA ADS] [CrossRef] [Google Scholar]
- Palla, M., De Looze, I., Relaño, M., et al. 2024, MNRAS, 528, 2407 [NASA ADS] [CrossRef] [Google Scholar]
- Pallottini, A., Ferrara, A., Gallerani, S., et al. 2017, MNRAS, 465, 2540 [CrossRef] [Google Scholar]
- Pallottini, A., Ferrara, A., Decataldo, D., et al. 2019, MNRAS, 487, 1689 [Google Scholar]
- Pallottini, A., Ferrara, A., Gallerani, S., et al. 2022, MNRAS, 513, 5621 [NASA ADS] [Google Scholar]
- Park, H.-J., Battisti, A. J., Wisnioski, E., et al. 2024, MNRAS, 535, 729 [Google Scholar]
- Peng, B., Stacey, G., Vishwas, A., et al. 2025, arXiv e-prints [arXiv:2507.12896] [Google Scholar]
- Péroux, C., & Howk, J. C. 2020, ARA&A, 58, 363 [CrossRef] [Google Scholar]
- Péroux, C., Zwaan, M. A., Klitsch, A., et al. 2019, MNRAS, 485, 1595 [CrossRef] [Google Scholar]
- Pineda, J. L., Langer, W. D., Velusamy, T., & Goldsmith, P. F. 2013, A&A, 554, A103 [CrossRef] [EDP Sciences] [Google Scholar]
- Popping, G., & Péroux, C. 2022, MNRAS, 513, 1531 [CrossRef] [Google Scholar]
- Popping, G., Somerville, R. S., & Galametz, M. 2017, MNRAS, 471, 3152 [NASA ADS] [CrossRef] [Google Scholar]
- Price, S. H., Übler, H., Förster Schreiber, N. M., et al. 2022, A&A, 665, A159 [NASA ADS] [CrossRef] [EDP Sciences] [Google Scholar]
- Rémy-Ruyer, A., Madden, S. C., Galliano, F., et al. 2014, A&A, 563, A31 [Google Scholar]
- Riechers, D. A., Bradford, C. M., Clements, D. L., et al. 2013, Nature, 496, 329 [Google Scholar]
- Robitaille, T., & Bressert, E. 2012, Astrophysics Source Code Library [record ascl:1208.017] [Google Scholar]
- Roman-Duval, J., Jenkins, E. B., Tchernyshyov, K., et al. 2022, ApJ, 928, 90 [NASA ADS] [CrossRef] [Google Scholar]
- Rowland, L. E., Hodge, J., Bouwens, R., et al. 2024, MNRAS, 535, 2068 [Google Scholar]
- Rowland, L. E., Stefanon, M., Bouwens, R., et al. 2026, MNRAS, 546, staf2023 [Google Scholar]
- Saccardi, A., Vergani, S. D., De Cia, A., et al. 2023, A&A, 671, A84 [NASA ADS] [CrossRef] [EDP Sciences] [Google Scholar]
- Sanders, R. L., Shapley, A. E., Topping, M. W., Reddy, N. A., & Brammer, G. B. 2024, ApJ, 962, 24 [NASA ADS] [CrossRef] [Google Scholar]
- Schneider, R., & Maiolino, R. 2024, A&ARv, 32, 2 [NASA ADS] [CrossRef] [Google Scholar]
- Scholtz, J., Parlanti, E., Carniani, S., et al. 2025, MNRAS, 544, L113 [Google Scholar]
- Schouws, S., Bouwens, R. J., Algera, H., et al. 2025, arXiv e-prints [arXiv:2502.01610] [Google Scholar]
- Shapley, A. E., Cullen, F., Dunlop, J. S., et al. 2020, ApJ, 903, L16 [NASA ADS] [CrossRef] [Google Scholar]
- Sinigaglia, F., Rodighiero, G., Elson, E., et al. 2022, ApJ, 935, L13 [NASA ADS] [CrossRef] [Google Scholar]
- Sommovigo, L., Ferrara, A., Pallottini, A., et al. 2022, MNRAS, 513, 3122 [NASA ADS] [CrossRef] [Google Scholar]
- Szakacs, R., Péroux, C., Zwaan, M., et al. 2021, MNRAS, 505, 4746 [NASA ADS] [CrossRef] [Google Scholar]
- Tacconi, L. J., Genzel, R., Saintonge, A., et al. 2018, ApJ, 853, 179 [Google Scholar]
- Tacconi, L. J., Genzel, R., & Sternberg, A. 2020, ARA&A, 58, 157 [NASA ADS] [CrossRef] [Google Scholar]
- Tamura, Y., Mawatari, K., Hashimoto, T., et al. 2019, ApJ, 874, 27 [NASA ADS] [CrossRef] [Google Scholar]
- Tepper-García, T. 2006, MNRAS, 369, 2025 [CrossRef] [Google Scholar]
- Todini, P., & Ferrara, A. 2001, MNRAS, 325, 726 [NASA ADS] [CrossRef] [Google Scholar]
- Totani, T., Kawai, N., Kosugi, G., et al. 2006, PASJ, 58, 485 [NASA ADS] [Google Scholar]
- Triani, D. P., Sinha, M., Croton, D. J., Pacifici, C., & Dwek, E. 2020, MNRAS, 493, 2490 [NASA ADS] [CrossRef] [Google Scholar]
- Trinca, A., Schneider, R., Valiante, R., et al. 2024, MNRAS, 529, 3563 [NASA ADS] [CrossRef] [Google Scholar]
- Tumlinson, J., Peeples, M. S., & Werk, J. K. 2017, ARA&A, 55, 389 [Google Scholar]
- Umeda, H., Ouchi, M., Nakajima, K., et al. 2024, ApJ, 971, 124 [NASA ADS] [CrossRef] [Google Scholar]
- Vallini, L., Gallerani, S., Ferrara, A., Pallottini, A., & Yue, B. 2015, ApJ, 813, 36 [NASA ADS] [CrossRef] [Google Scholar]
- Vallini, L., Ferrara, A., Pallottini, A., & Gallerani, S. 2017, MNRAS, 467, 1300 [NASA ADS] [Google Scholar]
- Vallini, L., Pallottini, A., Kohandel, M., et al. 2025, A&A, 700, A117 [NASA ADS] [CrossRef] [EDP Sciences] [Google Scholar]
- van Leeuwen, I. F., Bouwens, R. J., Hodge, J. A., et al. 2025, MNRAS, 542, 1388 [Google Scholar]
- Vijayan, A. P., Clay, S. J., Thomas, P. A., et al. 2019, MNRAS, 489, 4072 [NASA ADS] [CrossRef] [Google Scholar]
- Virtanen, P., Gommers, R., Oliphant, T. E., et al. 2020, Nat. Methods, 17, 261 [Google Scholar]
- Vis, P. D., Gomez, H. L., Schofield, S. P., et al. 2017, MNRAS, 471, 1743 [Google Scholar]
- Vizgan, D., Heintz, K. E., Greve, T. R., et al. 2022, ApJ, 939, L1 [NASA ADS] [CrossRef] [Google Scholar]
- Watson, D., Christensen, L., Knudsen, K. K., et al. 2015, Nature, 519, 327 [Google Scholar]
- Witstok, J., Jakobsen, P., Maiolino, R., et al. 2025, Nature, 639, 897 [Google Scholar]
- Witstok, J., Smit, R., Baker, W. M., et al. 2026, Open J. Astrophys., 9, 55261 [Google Scholar]
- Witten, C., Laporte, N., Martin-Alvarez, S., et al. 2024, Nat. Astron., 8, 384 [Google Scholar]
- Wolfe, A. M., Howk, J. C., Gawiser, E., Prochaska, J. X., & Lopez, S. 2004, ApJ, 615, 625 [CrossRef] [Google Scholar]
- Wolfe, A. M., Gawiser, E., & Prochaska, J. X. 2005, ARA&A, 43, 861 [NASA ADS] [CrossRef] [Google Scholar]
- Wolfire, M. G., Vallini, L., & Chevance, M. 2022, ARA&A, 60, 247 [NASA ADS] [CrossRef] [Google Scholar]
- Zanella, A., Daddi, E., Magdis, G., et al. 2018, MNRAS, 481, 1976 [Google Scholar]
- Zhukovska, S. 2014, A&A, 562, A76 [NASA ADS] [CrossRef] [EDP Sciences] [Google Scholar]
A further four sources at zphot ≳ 7.6 were scanned for [O III]88 μm emission rather than [C II], although no lines were detected (van Leeuwen et al. 2025).
Appendix A: βUV and MUV
In Figure A.1, we compare MUV and βUV derived from the fitting described in Section 3.1 (where the UV continua are simultaneously modelled with the Lyα absorption) with those derived in Fisher et al. (2025). There is, in general, good agreement between the two methods. We also note that fixing the MUV and βUV values to those derived in Fisher et al. (2025) does not significantly affect the derived NHI in the DLA fitting described in Section 3.1.
 |
Fig. A.1. A comparison of the MUV and βUV values derived from the fitting described in Section 3.1 (where the UV continua are simultaneously modelled with the Lyα absorption) with those derived in Fisher et al. (2025). |
Appendix B: Non-significant or poorly constrained DLA fits
As discussed in Section 3.1, only three galaxies in our sample (REBELS-08, 29, and 38) have ≳3σ DLA detections with zabs = zgal, and for two galaxies a DLA model with zabs < zgal is preferred, but only at a ∼1σ level (Figure B.2). This reflects the limitations of the modest spectral resolution and S/N of the prism data. Four galaxies in particular (REBELS-14, -15, -32, and -39, Figure B.1) have column densities consistent with zero and are therefore treated as non-detections. Possible explanations include contributions from two-photon continuum, Lyα emission, merging systems, absorption from a foreground source, or the presence of ionised bubbles around these galaxies. A full exploration of these scenarios will require more detailed modelling and higher-quality data, which is beyond the scope of this work.
 |
Fig. B.1. As in Figure 2, we plot the the best-fit DLA (red) and the IGM-only (blue) model. For these galaxies, the fitted IGM+DLA model is consistent with the IGM-only model, and so the derived NHI values are consistent with zero within the uncertainties. We also show a representative DLA curve (dashed orange), corresponding to a model that lies 3σ below the IGM-only model at wavelengths close to the Lyman break. We find that these IGM+DLA models do not provide a good description of the spectra of these sources. |
 |
Fig. B.2. As with Figure 2, we plot the the best-fit fiducial DLA model (red) and the IGM-only (blue) model, but we also plot the best-fit DLA models with zabs as a free parameter (green dashed line). In each panel we give the reduced χ2 value for each fit and the change in BIC compared to the IGM-only model. For these two galaxies, a fit with zabs < zgal is preferred. |
To test the impact of treating the lower-S/N cases as non-detections, we repeated our analysis adopting the 3σ upper limits for all sources except the three robust detections. The main conclusions remain unchanged. In particular, for the majority of the sources, the upper limits still suggest that MHI, DLA < MHI, [C II] (Figure B.3) and that the AV/NHIof the REBELS-IFU sources are still higher than other z > 6 sources with lower metallicities (Figure B.4).
 |
Fig. B.3. As in Figure 3, but plotting upper limits for NHI for all sources apart from those with the most robust DLA fits (REBELS-12, 29, and 38; markers outlined in yellow). We also plot the fiducial best-fit line from the text when using the Heintz et al. (2021) calibrations in blue for comparison. |
 |
Fig. B.4. As with Figure 4b, but plotting upper limits for NHI for all sources apart from those with the most robust DLA fits (REBELS-12, 29, and 38; markers outlined in yellow). |
Appendix C: Additional L[C II]-to-Mgas calibrations
In the main text, we describe how we adopted the metallicity-dependent calibration from Heintz et al. (2021) to infer H I masses from L[CII], and we also make comparisons with alternative L[CII]-to-MH I calibrations in Section 4.1. To further assess the effect of different gas mass estimates on the results presented in this work, we repeated the analysis with several additional prescriptions.
For each galaxy, we computed gas mass estimates using four calibrations that do not strictly isolate H I: (i) Vallini et al. (2025) (total gas; Mgas,tot = MH I + MH2; depends on L[CII] and metallicity), (ii) Zanella et al. (2018) (MH2 only, with a constant conversion factor of α[C II] = 31 M⊙/L⊙), (iii) Khatri et al. (2025) (both MH2 and Mgas, tot) and (iv) Ferrara et al. (2019) (Mgas, dependent on L[CII], metallicity, and radius). We note that the gas masses derived using the Zanella et al. (2018) calibration, which assumes a fixed ![Mathematical equation: $ \alpha_{\mathrm{[CII]}}=31 \mathrm{M}_{\odot} \mathrm{L}_{\odot}^{-1} $](/articles/aa/full_html/2026/06/aa57654-25/aa57654-25-eq40.gif) , are presented in Algera et al. (2026).
, are presented in Algera et al. (2026).
Figures C.2 and C.1 show the the values derived using the Vallini et al. (2025) and the Ferrara et al. (2019) calibrations for the total gas mass, respectively. It would therefore be expected that these are upper limits to MHI. The values derived using the analytical model from Ferrara et al. (2019) (which depends on the L[CII], metallicity and radius) are on average ∼5.5× higher than the fiducial MHI values. Conversely, the total gas masses derived from the metallicity-dependent calibration from Vallini et al. (2025) are on average ∼0.10× the fiducial H I masses adopted. For REBELS-25, we note that the Vallini et al. (2025)Mgas estimate is ∼ 7.9 × 10⁹ M⊙, which is ∼14× lower than the Mgas estimate based on its dynamical and stellar mass (Mgas = 1.1 × 10¹¹ M⊙, Rowland et al. 2024). Additionally, as noted in Vallini et al. (2025), the metallicity used in their calibrations is taken directly from the intrinsic O/H abundance in the simulations, whereas observational metallicities are inferred from emission-line calibrations. This may introduce systematic differences when applying the calibration to observed galaxies.
 |
Fig. C.1. As with Figure 3, but plotting the total gas masses using the L[C II]-to-Mgas calibration from Ferrara et al. (2019). |
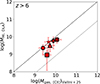 |
Fig. C.2. As with Figure 3, but using the L[C II]-to-Mgas calibration from Vallini et al. (2025). |
For completeness, the H2 masses from the Zanella et al. (2018) conversion are ∼0.48× the fiducial H I masses, and the Khatri et al. (2025) prescriptions yield ∼6× higher total gas masses and ∼30× higher H2 than MHI from Heintz et al. (2021).
Despite this large range of calibrations, in all cases tested, the [C II]-based gas mass exceeds the DLA-based H I mass, supporting our interpretation that the H I reservoir is more extended than the region traced by the [C II] emission.
All Tables
All Figures
|
Fig. 1. Schematic illustrating the assumptions and methodology used in this work. We stress that this schematic should be regarded only as a rough illustration under the very simplified assumptions adopted. Left panel: Section of a simplified model galaxy, where we assume spherical geometry with radii set by the UV emission, [C II] emission, and the H I reservoir radii derived in this work (see text). Ionising photons from young massive stars (yellow) propagate outward, becoming attenuated by dust (orange circles) and, along some sight lines, absorbed by neutral H I clouds in or around the galaxy (dashed red line). Other sight lines pass through without strong absorption (solid red line). All photons are then additionally absorbed by the IGM. Top right panel: Example SED from BAGPIPES for a massive (log(M*/M⊙) = 9), dusty (AV = 0.9 mag), star-forming (SFR10 = 200 M⊙ yr−1) galaxy at z = 7. Shown are the intrinsic stellar continuum (yellow), the attenuated stellar continuum (red), and dust emission (orange). The blue shaded region marks the NIRSpec wavelength range used to measure stellar AV, while the red shaded band indicates the ALMA Band 6 FIR continuum at ∼160 μm used to estimate the dust mass for the REBELS-IFU sample. Bottom right panel: Example Lyα transmission curves, comparing the case of IGM-only absorption (solid red line) with IGM + DLA absorption from neutral gas in the ISM and/or CGM (dashed red). Following our modelling, we assume a mean IGM neutral fraction of xHI = 0.33 and convolve the spectra to ℛ = 60. |
| In the text | |
|
Fig. 2. Spectral fits for the six galaxies where including a damped Lyα absorption (DLA) component with zabs = zgal improves the fit to the observed UV continuum downturn, as quantified by both the reduced χ2 and the BIC. The observed data are shown in black, with the flux uncertainties shaded in grey. The best-fit model including both IGM and DLA absorption is plotted in red, while the blue curve shows a model with only IGM absorption. |
| In the text | |
|
Fig. 3. Comparison between the H I gas mass inferred from damped Lyα absorption wings (MH I, DLA) and from [C II] luminosities (MH I, [C II]) using calibrations from Heintz et al. (2021) (left), Casavecchia et al. (2025) (centre) and Vizgan et al. (2022) (right) for the REBELS-IFU sample with DLA detections. Each REBELS galaxy is shown with a unique marker. We also plot A1689-zD1 at z = 7.13 from Heintz et al. (2025) (yellow star) and JADES-GS-z14-0 at z = 14.18 from Heintz et al. (2025) and Schouws et al. (2025) (yellow square). For JADES-GS-z14-0, we assume re, [C II] = 2 × re,UV, and for A1689-zD1 we determine re, [C II] assuming an exponential profile from the disc diameter reported in Heintz et al. (2025) In each panel, the black dashed line shows the one-to-one relation, which assumes that the H I gas reservoir and the [C II] emission have the same radial extent. The best-fit relation is shown with the solid blue line, with the shaded region indicating the 1σ uncertainty on the fit. The dotted line shows the average offset in log space for the fiducial MH I, [C II], corresponding to a geometric mean mass ratio of MH I, [C II] ≃ 15 × MH I, DLA. This implies a typical radius ratio of rH I ≃ 4 × r[C II]. Markers outlined in bold use the [C II] radii derived from Sérsic fitting to high resolution (beam FWHM ∼ 0.7 − 3 kpc) data. |
| In the text | |
|
Fig. 4. Left: Comparison between the DTG mass ratios derived from ALMA observations (using L[C II] to estimate the H I mass and the FIR continuum to infer dust mass) and from DLA-based measurements (AV/NH I) for the REBELS-IFU galaxies with DLA detections and for A1689-zD1 (Heintz et al. 2025). In both panels, the same marker shapes are used as in the legend of Figure 3. REBELS-34 has an upper limit on the dust mass since it is undetected in Band 6 continuum from the REBELS ALMA LP. No clear trend is observed between these two DTG estimates for this sample. We also plot for reference the average values from different sight lines in the MW, LMC, and SMC from Konstantopoulou et al. (2024) and references therein, where we adopt their AV, ext values derived from SED fitting and convert their total gas masses to H I masses using the conversions given in the legend taken from Table 6 of Israel (1997). Right: Relation between log(AV/NH I) and gas-phase metallicity (12 + log(O/H)) for the REBELS-IFU sample and a compilation of eleven additional z ≳ 6 galaxies from the literature (circle markers), with markers coloured by redshift. The best-fit linear relation is shown via the black solid line, with a shaded region representing the 1σ uncertainty. A strong correlation is found (Pearson r = 0.7, p = 1 × 10⁻³), with a consistent slope to the trend reported in Heintz et al. (2023a) based on GRB sight lines at z = 1.7 − 6.3 (black dashed line) and the slope from a linear fit to the data presented in Konstantopoulou et al. (2024) for the MW, LMC, and SMC. |
| In the text | |
|
Fig. A.1. A comparison of the MUV and βUV values derived from the fitting described in Section 3.1 (where the UV continua are simultaneously modelled with the Lyα absorption) with those derived in Fisher et al. (2025). |
| In the text | |
|
Fig. B.1. As in Figure 2, we plot the the best-fit DLA (red) and the IGM-only (blue) model. For these galaxies, the fitted IGM+DLA model is consistent with the IGM-only model, and so the derived NHI values are consistent with zero within the uncertainties. We also show a representative DLA curve (dashed orange), corresponding to a model that lies 3σ below the IGM-only model at wavelengths close to the Lyman break. We find that these IGM+DLA models do not provide a good description of the spectra of these sources. |
| In the text | |
|
Fig. B.2. As with Figure 2, we plot the the best-fit fiducial DLA model (red) and the IGM-only (blue) model, but we also plot the best-fit DLA models with zabs as a free parameter (green dashed line). In each panel we give the reduced χ2 value for each fit and the change in BIC compared to the IGM-only model. For these two galaxies, a fit with zabs < zgal is preferred. |
| In the text | |
|
Fig. B.3. As in Figure 3, but plotting upper limits for NHI for all sources apart from those with the most robust DLA fits (REBELS-12, 29, and 38; markers outlined in yellow). We also plot the fiducial best-fit line from the text when using the Heintz et al. (2021) calibrations in blue for comparison. |
| In the text | |
|
Fig. B.4. As with Figure 4b, but plotting upper limits for NHI for all sources apart from those with the most robust DLA fits (REBELS-12, 29, and 38; markers outlined in yellow). |
| In the text | |
|
Fig. C.1. As with Figure 3, but plotting the total gas masses using the L[C II]-to-Mgas calibration from Ferrara et al. (2019). |
| In the text | |
|
Fig. C.2. As with Figure 3, but using the L[C II]-to-Mgas calibration from Vallini et al. (2025). |
| In the text | |
Current usage metrics show cumulative count of Article Views (full-text article views including HTML views, PDF and ePub downloads, according to the available data) and Abstracts Views on Vision4Press platform.
Data correspond to usage on the plateform after 2015. The current usage metrics is available 48-96 hours after online publication and is updated daily on week days.
Initial download of the metrics may take a while.