


| Issue |
A&A
Volume 711, July 2026
|
|
|---|---|---|
| Article Number | A112 | |
| Number of page(s) | 17 | |
| Section | Extragalactic astronomy | |
| DOI | https://doi.org/10.1051/0004-6361/202557740 | |
| Published online | 06 July 2026 | |
Extremely ultraviolet-bright starbursts at the end of cosmic reionization
1
Geneva Observatory, Department of Astronomy, University of Geneva, Chemin Pegasi 51, CH-1290 Versoix, Switzerland
2
CNRS, IRAP, 14 Avenue E. Belin, 31400 Toulouse, France
3
Centro de Astrobiología (CAB), CSIC-INTA, Ctra. de Ajalvir km 4 Torrejón de Ardoz, E-28850, Madrid, Spain
4
Division of Physics, Faculty of Pure and Applied Sciences, University of Tsukuba, Tsukuba, Ibaraki 305-8571, Japan
5
Tomonaga Center for the History of the Universe (TCHoU), Faculty of Pure and Applied Sciences, University of Tsukuba, Tsukuba, Ibaraki 305-8571, Japan
6
Department of Physics, School of Advanced Science and Engineering, Faculty of Science and Engineering, Waseda University, 3-4-1 Okubo, Shinjuku, Tokyo 169-8555, Japan
7
Waseda Research Institute for Science and Engineering, Faculty of Science and Engineering, Waseda University, 3-4-1 Okubo, Shinjuku, Tokyo 169-8555, Japan
8
Department of Physics, The University of Tokyo, 7-3-1 Hongo, Bunkyo, Tokyo 113-0033, Japan
9
Center for Computational Astrophysics, Flatiron Institute, 162 5th Avenue, New York, NY 10010, USA
10
Department of Space, Earth and Environment, Chalmers University of Technology, SE-412 96 Gothenburg, Sweden
11
Space Telescope Science Institute (STScI), 3700 San martin Drive, Baltimore, MD 21218, USA
12
Departamento de Fisica Teorica, Modulo 8, Facultad de Ciencias, Universidad Autonoma de Madrid, 28049 Madrid, Spain
13
CIAFF, Facultad de Ciencias, Universidad Autonoma de Madrid, 28049 Madrid, Spain
14
Center for Frontier Science, Chiba University, 1-33 Yayoi-cho, Inage-ku, Chiba 263-8522, Japan
15
Department of Physics, Graduate School of Science, Nagoya University, Nagoya 464-8602, Japan
16
Research Center for Space and Cosmic Evolution, Ehime University, Matsuyama, Ehime 790-8577, Japan
17
Department of Pure and Applied Physics, School of Advanced Science and Engineering, Faculty of Science and Engineering, Waseda University, 3-4-1 Okubo, Shinjuku, Tokyo 169-8555, Japan
18
Waseda Institute for Advanced Study (WIAS), Waseda University, 1-21-1, Nishi-Waseda, Shinjuku, Tokyo 169-0051, Japan
19
Center for Data Science, Waseda University, 1-6-1, Nishi-Waseda, Shinjuku, Tokyo 169-0051, Japan
20
Kavli Institute for the Physics and Mathematics of the Universe (WPI), UT Institute for Advanced Study, The University of Tokyo, Kashiwa, Chiba 277-8583, Japan
21
Research Center for the Early Universe, School of Science, The University of Tokyo, 7-3-1 Hongo, Bunkyo, Tokyo 113-0033, Japan
★ Corresponding author: This email address is being protected from spambots. You need JavaScript enabled to view it.
Received:
17
October
2025
Accepted:
18
May
2026
Abstract
We present a study of 27 very UV-bright (−22.0 ≲ MUV ≲ −24.4) star-forming galaxies at z ∼ 6 identified in the Subaru High-z Exploration of Low-Luminosity Quasars (SHELLQs) survey. Stacking their rest-frame UV spectra revealed a prominent N Vλ1240 P Cygni feature, consistent with very young (∼6 Myr) stellar populations dominated by massive and hot stars. Ultraviolet-bright galaxies in the reionization epoch are thus powerful and efficient ionizing sources, with an average ionizing photon production efficiency of log(ξion/Hz erg−1) = 25.54+0.09−0.12. For one representative source, J0217–0208 at z = 6.204 (MUV = −23.4), we analyzed available JWST/NIRCam and NIRSpec observations. Its spectral energy distribution indicates a young (∼5 Myr) starburst with a stellar mass of 109 M⊙ and a high specific star formation rate (∼100 Gyr−1). Together with its very compact NIRCam-measured size (reff ≃ 260 pc), this corresponds to stellar mass and star formation rate surface densities approximately one hundred times higher than those of typical galaxies at comparable redshifts. NIRSpec spectroscopy further revealed strong nebular emission, for which we derived a high electron density (ne ≃ 103 cm−3), a metallicity of 12 + log(O/H) = 8.20 ± 0.11 (from the direct method), and a super-solar N/O ratio (log(N/O) ≃ −0.30). Furthermore, J0217–0208 shows broad components in several rest-optical emission lines, indicating powerful ionized outflows. From the Balmer decrement, these outflows appear to be heavily obscured (E(B − V)out ≃ 0.6), in contrast to the nearly dust-free stellar continuum (E(B − V)★ = 0.01 ± 0.01) obtained from its steep UV slope, βUV ≃ −2.6. Combined with ALMA detections of a massive (Mdust ≃ 2 × 10⁸ M⊙), extended (∼1.4 kpc), and cold (Tdust ≃ 25 K) dust reservoir, these findings point to dusty feedback-driven outflows carrying and pushing dust well beyond the stellar core and likely boosting the observed UV luminosity. Taken together, our results suggest that UV-bright galaxies at high redshift represent short-lived but extreme phases of rapid stellar mass growth, efficient ionizing photon production, and strong feedback. The extreme properties of J0217–0208, such as a supersolar N/O, a steep UV slope, a compact size, and very high surface densities, closely mirror those of the brightest galaxies at z > 10, suggesting a shared evolutionary pathway.
Key words: galaxies: high-redshift / galaxies: starburst / dark ages / reionization / first stars
© The Authors 2026
 Open Access article, published by EDP Sciences, under the terms of the Creative Commons Attribution License (https://creativecommons.org/licenses/by/4.0), which permits unrestricted use, distribution, and reproduction in any medium, provided the original work is properly cited.
This article is published in open access under the Subscribe to Open model. This email address is being protected from spambots. You need JavaScript enabled to view it. to support open access publication.
1. Introduction
Ultraviolet-bright star-forming galaxies, sources located at the bright end of the UV luminosity function, were once considered extremely rare at any redshift, including during the Epoch of Reionization (6 < z < 16). However, the advent of the James Webb Space Telescope (JWST) has dramatically changed this view by revealing an unexpectedly large number of UV-luminous sources at z ≳ 10 (e.g., Arrabal Haro et al. 2023; Carniani et al. 2024). Some of these systems exhibit properties rarely observed at lower redshift, including unusual abundance patterns inferred from intense rest-UV [N IV] λ1486 and [N III] λ1750 emission lines (Bunker et al. 2023; Castellano et al. 2024; Naidu et al. 2026) as well as compact morphologies and high stellar mass and star-formation surface densities (Schaerer et al. 2024). Regardless of their intrinsic properties, their observed number densities exceed predictions from pre-JWST models of galaxy formation by nearly an order of magnitude (Kannan et al. 2023; Lovell et al. 2023), highlighting a striking tension with theoretical expectations.
Hints of this discrepancy were already present before JWST. Wide-field imaging surveys had uncovered an apparent excess of bright galaxies at z ≳ 8 relative to Schechter-function extrapolations as well as a surprisingly slow evolution of the bright end of the UV luminosity function at these redshifts (e.g., Oesch et al. 2016; Morishita et al. 2018; Stefanon et al. 2019; Bowler et al. 2020; Harikane et al. 2022). These trends have now been confirmed and extended by JWST to even earlier epochs, firmly establishing the existence of an overabundant population of UV-bright systems in the first few hundred megayears of cosmic time.
Several explanations have been put forward to account for this tension. One possibility is that early galaxies formed stars with much higher efficiencies than typically assumed and measured locally, aided by the dense metal-poor conditions at early epochs (Dekel et al. 2023; Ceverino et al. 2024; Li et al. 2024, see also: Boylan-Kolchin 2025; Renzini 2025). Alternatively, a nonstandard stellar initial mass function (IMF) biased toward (very) massive stars could boost the UV luminosity-to-mass ratio (e.g., Trinca et al. 2024; Hutter et al. 2025). Other scenarios include strong radiation-driven outflows that rapidly expel dust, thereby reducing attenuation and enhancing the UV output (Ferrara et al. 2023; Ziparo et al. 2023) or stochastic star-formation histories and very young stellar ages that can transiently elevate the UV luminosity (e.g., Mason et al. 2023; Ciesla et al. 2024; Kravtsov & Belokurov 2024; Donnan et al. 2025). While these frameworks differ fundamentally, they all invoke extreme conditions rarely observed at lower redshifts.
Crucially, and except for a few sources (e.g., Bunker et al. 2023; Carniani et al. 2024; Castellano et al. 2024; Fudamoto et al. 2024; Álvarez-Márquez et al. 2025; Schouws et al. 2025; Zavala et al. 2025), most z > 10 UV-bright galaxies remain too faint for detailed high signal-to-noise multiwavelength studies. As a result, their stellar populations, interstellar medium conditions, and dust properties remain poorly constrained, leaving the physical drivers of their remarkable luminosities an open question. In this sense, lower-z analogs may serve as ideal laboratories to investigate and potentially establish the conditions and properties of these extreme systems. In particular, identifying the UV-brightest systems at the highest accessible redshifts is crucial, as the aforementioned mechanisms may be most pronounced there, and the physical conditions may remain closest to those of the early Universe.
In this work, we present a study of a large sample of UV-bright galaxies (−22.0 ≲ MUV ≲ −24.4) at z ∼ 6 identified in the Subaru High-z Exploration of Low-Luminosity Quasars (SHELLQs) survey (Matsuoka et al. 2016, 2018b,a, 2019, 2022, 2025a). This work is organized as follows. In Sect. 2 we investigate the average rest-UV properties of these sources using ground-based spectroscopic observations. Section 3 presents JWST observations and corresponding analysis of one UV-bright galaxy at z = 6.2. Discussion of the results is presented in Sect. 4, and, finally, we present a summary of our main findings in Sect. 5. Throughout this work we use a concordance cosmology with Ωm = 0.274, ΩΛ = 0.726, and H0 = 70 km s−1 Mpc−1. Magnitudes are given in the AB system.
2. Average properties of UV-bright Epoch of Reionization galaxies
2.1. Sample and observations
The SHELLQs survey is a wide-field survey designed to identify low-luminosity Quasi-stellar Objects (QSOs or quasars) at 6 ≲ z ≲ 7 using ground-based imaging data from the Hyper Suprime-Cam (HSC) Subaru Strategic Program. As detailed in Matsuoka et al. (2022), candidates are selected based on the dropout technique in the i- or z-bands and their point-like morphologies in HSC images. Their redshifts are confirmed through optical spectroscopic follow-up observations with the Subaru and the Gran Telescopio Canarias (GTC) telescopes, using Lyα emission or the Lyα continuum break.
Among more than 160 high-z sources identified so far within SHELLQs, some exhibit strong (LLyα > 1043 erg s−1) and narrow – full width at half maximum (FWHM) < 1000 km s−1 – Lyα emission. Since similarly high Lyα luminosities are also seen at lower redshifts (e.g., at cosmic noon) and sometimes associated with active galactic nucleus (AGN) activity (e.g., Konno et al. 2016), SHELLQs conservatively classifies objects with LLyα > 1043 erg s−1 as AGNs, either obscured AGNs or weak broad absorption line QSOs (Matsuoka et al. 2018b, 2019, 2022). Nonetheless, as shown in the left panel of Fig. 1, several star-forming galaxies at intermediate and high redshifts also exhibit Lyα luminosities well exceeding LLyα > 1043 erg s−1 without any evidence of an AGN (e.g., Ouchi et al. 2009; Sobral et al. 2015; Matthee et al. 2017; Shibuya et al. 2018; Marques-Chaves et al. 2020a,b, 2021; Marques-Chaves et al. 2022; Marconcini et al. 2025; Torralba-Torregrosa et al. 2024; Dessauges-Zavadsky et al. 2025, to name a few).
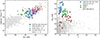 |
Fig. 1. Distribution of Lyα luminosity (LLyα), UV absolute magnitude (MUV), and redshift (z) for the SHELLQs-LAEs analyzed in this work (blue circles). Left panel: plane of LLyα–MUV comparing SHELLQs LAEs with other galaxy populations with spectroscopic redshifts, namely, SHELLQs-QSOs at z ∼ 6 (red crosses; Matsuoka et al. 2016, 2018a,b; 2019, 2022, 2025a), bright LAEs at z ∼ 6 (green squares; Ouchi et al. 2009; Sobral et al. 2015; Matthee et al. 2017; Shibuya et al. 2018; Marconcini et al. 2025), UV-bright star-forming galaxies at z ∼ 3 from SDSS/BOSS (violet diamonds; Marques-Chaves et al. 2020a,b, 2021, 2022; Dessauges-Zavadsky et al. 2025), and more typical LAEs at z ∼ 3–6 (gray squares; Kerutt et al. 2022). Right panel: MUV–z distribution of the SHELLQs LAEs together with UV-bright galaxies from SHELLQs lacking or showing weak Lyα emission (light blue circles; Matsuoka et al. 2016, 2018a,b, 2019, 2022), sources from the REBELS (green; Bouwens et al. 2022) and BoRG (red; Roberts-Borsani et al. 2025) surveys, and a compilation of spectroscopically confirmed zspec > 5 objects from the DAWN/DJA archive (gray). |
In this study, we reanalyze the spectra and classification of UV-bright SHELLQs sources with strong and narrow Lyα emission (hereafter SHELLQs-LAEs). To focus on the most UV-bright sources, we selected objects with MUV ≤ −22 measured from ground-based images), LLyα > 1043 erg s−1, and FWHM < 1000 km s−1. This subsample consists of 27 sources, with a mean and scatter absolute UV magnitude of MUV = −23.03 ± 0.58, z = 6.15 ± 0.22, and log(LLyα/erg s−1) = 43.57 ± 0.36.
Fully reduced optical spectra obtained with Subaru/FOCAS and GTC/OSIRIS are retrieved from the SHELLQs webpage1. A detailed description of the observations and data reduction is provided in the main SHELLQs survey papers (Matsuoka et al. 2016, 2018a,b, 2019, 2022). Briefly, the observations were conducted between November 2015 and August 2021, with typical total on-source exposure times of 30–120 min. The reduced one-dimensional spectra reach 1σ depths of ≃(4–10)×10−19 erg s−1 cm−2 Å−1 over the rest-frame wavelength range λrest = 1250–1400 Å. Within this region, the average signal-to-noise ratio is ∼0.8 per pixel (≃1.5 Å pix−1), corresponding to an integrated S/N of ∼20. All the rest-UV spectra used in this work are presented in the original SHELLQs survey papers.
Appendix A and Table A.1 list their coordinates and general properties obtained by the SHELLQs collaboration. The UV absolute magnitudes of SHELLQs-LAEs are represented as dark blue circles in Fig. 1. For comparison, the right panel of Fig. 1 also shows other UV-bright LBGs selected from SHELLQs (but without or weak Lyα emission; in light blue; Matsuoka et al. 2019) and other surveys targeting UV-bright star-forming galaxies at z ≳ 6 such as REBELS (green; Bouwens et al. 2022; Rowland et al. 2026) and BoRG (red; Roberts-Borsani et al. 2025), along with a compilation of sources with spectroscopic redshifts above zspec > 5 obtained with NIRSpec/JWST (gray, from DAWN/DJA archive; Heintz et al. 2024; de Graaff et al. 2025).
2.2. Composite spectrum
To investigate the representative spectral properties of the SHELLQs-LAEs, we construct a composite rest-frame UV spectrum by stacking the individual spectra. While Lyα redshifts are available for all sources, accurate systemic redshifts are crucial for aligning spectra before stacking. However, these are only known for a few SHELLQs-LAEs from recent JWST spectroscopy (Matsuoka et al. 2025b): J0217−0208 (z = 6.204, further discussed in Sect. 3), J0853+0139 (z = 6.007), J0905+0300 (z = 6.273), and J1416+0015 (z = 6.027). For the remaining sources, we estimate the systemic redshifts using the empirical corrections from Verhamme et al. (2018) using the Lyα emission peak and line width derived from optical spectroscopy, which account for radiative transfer effects.
Each spectrum is then deredshifted using the estimated systemic redshifts and resampled onto a common spectral grid with a resolution of Δλ = 1.5 Å. We also rescaled the flux of every spectrum to a common flux density to match the mean absolute UV magnitude of the sample (MUV ≃ −23.0). The composite spectrum is obtained by taking the median of the resampled spectra at each wavelength bin, minimizing the contamination in the final stack from strong sky-line residuals.
For the stacked spectrum error, we first compute the formal per-pixel uncertainty from inverse-variance weighting of the contributing spectra. However, this estimate does not account for intrinsic sample variance or correlated noise introduced by resampling onto a common wavelength grid. We therefore estimated the final uncertainties using bootstrap resampling. We generated 1000 realizations of the composite spectrum by randomly drawing spectra with replacement and recomputing the median stack for each realization. The 1σ uncertainty at each wavelength was taken as the standard deviation of the bootstrap distribution. This approach incorporates both measurement noise and intrinsic spectral diversity within the population.
Figure 2A presents the median stacked spectrum. It exhibits strong (EW0 = 19 ± 3 Å) and narrow (FWHM = 612 ± 56 km s−1) Lyα emission and a strong P Cygni profile around N Vλ1240. Other spectral features are tentatively detected, including the low-ionization absorption line in Si IIλ1260. To assess the robustness of the stack, we also computed the mean composite spectra, finding consistent results, but with lower S/N.
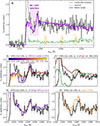 |
Fig. 2. Stacked rest-UV spectrum of UV-bright SHELLQs-LAEs. Panel A: median (black) stacked spectrum and 1σ error (green) of SHELLQs-LAEs, which presents strong Lyα emission and a well-developed N Vλ1240 P-Cygni profile (violet-shaded area). The location of low-ionization ISM absorption lines (Si II, O I, and C II) are also marked with dashed orange lines. The BPASS stellar population synthesis model that best reproduces the observed N V profile is shown in violet and is characterized by continuous star formation and an age of |

2.3. Nature of UV-bright galaxies: Very young stellar populations
The most striking spectral feature observed in the median stacked spectrum shown in Fig. 2 is the P-Cygni profile around N Vλ1240. This feature, characterized by blueshifted absorption and redshifted emission, is typical of the most massive O-type stars and originates from their strong stellar winds (cf., Roman-Duval et al. 2020). The strength of the N V P-Cygni profile is thus sensitive to the age of the stellar population but, as highlighted in Chisholm et al. (2019), it is only weakly dependent on stellar metallicity, in contrast to other wind lines such as Si IVλ1400 and C IVλ1550 whose strength is more dependent on the metallicity. As such, strong N V P-Cygni is observed (and expected) in systems dominated by very young stellar populations (e.g., Leitherer et al. 2018; Chisholm et al. 2019; Berg et al. 2022; Smith et al. 2023; Upadhyaya et al. 2024; Marques-Chaves et al. 2026). For older or more evolved stellar populations, the N V P-Cygni becomes significantly weaker or is no longer discernible, as seen in the spectra of more evolved galaxies (e.g., Shapley et al. 2003; Sugahara et al. 2019).
To investigate the origin of the N V P-Cygni feature in our stacked spectrum, we fit its observed profile (from λrest = 1225 − 1248 Å) using predictions from stellar population synthesis models. We used the Binary Population and Spectral Synthesis (BPASS v2.1; Eldridge et al. 2017) code, assuming a constant star formation history and a Chabrier (2003) IMF. Because the composite spectrum combines 27 galaxies that are unlikely to share identical star formation histories, a constant star formation history provides a neutral time-averaged description without imposing a specific functional form. We adopted a stellar metallicity of Z★ = 0.006 (or Z = 0.3 Z⊙, assuming Z⊙ = 0.02; see also Sect. 3.4). The observed N V profile is well reproduced by stellar populations with an age of ≃6 Myr (Fig. 2A). Figure 2B1 shows a zoom-in of the observed N V feature in our stacked spectrum, compared with BPASS models spanning a wide range of ages (1 − 100 Myr, color coded). Despite the relatively low S/N, our data suggest a relatively well-constrained age of  Myr. Ages shorter than ≃3 Myr or longer than ≃15 Myr are significantly disfavored, as they either overpredict or underpredict the observed strength of the N V P-Cygni feature.
It is noteworthy that similar results have been found for UV-bright galaxies at intermediate redshifts (z ∼ 2 − 4 and MUV ≤ −23), which are so far the only star-forming galaxies known to be as bright as the SHELLQs-LAEs. Deep rest-frame UV spectroscopy of these z ∼ 2 − 4 galaxies has revealed intense stellar wind lines, including prominent N V P-Cygni, from which ages of ≲10 Myr and high specific star formation rates (sSFRs; sSFR = SFR/M★ ∼ 100 Gyr−1) were inferred (Marques-Chaves et al. 2020a, 2021, 2022, 2024b; Upadhyaya et al. 2024; Dessauges-Zavadsky et al. 2025). Figure 2B2 compares the N V profile of the SHELLQs-LAEs with that of the stacked spectrum of similarly UV-bright galaxies at z ∼ 2 − 4 presented in Upadhyaya et al. (2024), showing a great similarity between the two.
The N V P-Cygni feature in SHELLQs-LAEs was also noted by Matsuoka et al. (2019), who performed a similar spectral stacking analysis using a slightly smaller sample (see their Fig. 9). They attributed the observed N V P-Cygni profile to a weak broad absorption line quasar (BALQSO), a type of quasar that shows blueshifted absorption features in its spectrum due to outflowing gas from the central supermassive black hole. While the weak BALQSO scenario cannot be ruled out as an explanation for the observed N V profile in the SHELLQs-LAEs, it is unlikely for several reasons. First, the P Cygni-like features observed in BALQSOs arise from the combination of broad emission from the accretion disk and absorption by outflowing gas along the line of sight, typically spanning a wide range of velocities from a few hundred kilometers per second to relativistic speeds (see Hamann & Ferland 1999, for a review). Given this diversity, it is improbable (but not impossible) that stacking the rest-UV spectra of multiple BALQSOs would yield a N V P-Cygni profile that precisely matches that expected from stellar winds of massive stars. Figure 2B3 shows a comparison between the observed N V profile of the SHELLQs-LAEs and those obtained from stacks of low- (green) and high-ionization (red) BALQSOs at z ∼ 1 (Brotherton et al. 2001). While these BALQSO composites do exhibit P Cygni-like N V profiles, they differ significantly from the one observed in the SHELLQs-LAEs and from BPASS model predictions. Furthermore, BALQSOs typically show broad Lyα profiles (with FWHM > 1000 km s−1), in contrast to the narrower Lyα line widths observed in SHELLQs-LAEs (< 1000 km s−1).
Finally, we investigated the contribution of an obscured AGN (e.g., type II). This is more challenging due to the limited spectral coverage of our stacked spectrum (λrest ≲ 1400 Å). However, as shown in Fig. 2B4 (orange), type-II AGNs typically exhibit narrow and symmetric N V emission, from N V 1238 Å and 1242 Å (Hainline et al. 2011; Alexandroff et al. 2013; Mignoli et al. 2019), which contrasts with blueshifted absorption and redshifted emission observed in SHELLQs-LAEs. Furthermore, a type-II AGN, or more generally an obscured AGN, would not account for the high UV luminosities observed in the SHELLQs-LAEs.
In summary, our results suggest that the UV emission of the UV-bright SHELLQs-LAEs studied here is likely dominated by very young stellar populations, with an average age of ≃6 Myr under the assumption of a constant star formation rate (SFR). As noted earlier, this does not rule out the presence of AGN-dominated systems within the sample (see e.g., Onoue et al. 2021), but their overall contribution to the UV or frequency is likely to be small. Deeper follow-up spectroscopy in the rest-UV and/or optical is required to determine the nature of these systems on an individual basis. Such observations are available for five UV-bright SHELLQs-LAEs (J0217−0208, J0853+0139, J0905+0300, J1416+0015, and J2232+0012; Matsuoka et al. 2025b), four of which show no evidence of AGN activity, as indicated by the absence of broad (FWHM > 1000 km s−1) components in the Balmer lines, the non-detection of high-ionization emission lines, and slightly resolved morphologies (Matsuoka et al. 2025b).
In the following, we present an analysis of JWST observations of one of these sources, J0217−0208 at z = 6.204. This galaxy is representative of the SHELLQs-LAE population in terms of UV and Lyα luminosities and is the only object in the sample with multi-wavelength coverage including ALMA, which, as we show later, provides crucial constraints for a comprehensive understanding of the system.
3. JWST observations of J0217−0208
J0217−0208 (RA: 02:17:21.59; Dec: −02:08:52.6) at z = 6.20 and with MUV = −23.3 was first discovered in Matsuoka et al. (2018b), showing a relatively strong Lyα emission (log[LLyα/erg s−1] = 43.33) and unresolved profile (FWHM < 230 km s−1). Far-IR ALMA observations of this source were presented in Harikane et al. (2020b), which reported significant detections in the [O III] 88 μm and [C II] 158 μm. Dust continuum emission was also significantly detected in J0217−0208 at 160 μm and 120 μm, for which Harikane et al. (2020b) derived a total IR luminosity LIR = 1.4 × 10¹¹ L⊙, and a dust temperature and mass Tdust ≃ 25 K and Mdust ≃ 2 × 10⁸ M⊙. Figure 3 summarizes the JWST observations of J0217−0208. The properties of J0217−0208 derived in this section are summarized in Table 1.
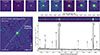 |
Fig. 3. Summary of the JWST observations of J0217−0208 at z = 6.20. Top panels: JWST/NIRCam images centered on J0217−0208 at increasing wavelengths (from F115W to F444W, left to right, each with a 2″ × 2″ size). Bottom panels: JWST/NIRSpec spectroscopy. Bottom left: integrated Hβ + [O III] λλ4960,5008 emission from J0217−0208 obtained with NIRSpec/IFS. Bottom right: two-dimensional (top) and one-dimensional (bottom) spectra of J0217−0208 obtained with NIRSpec/Fixed-slit. The locations of relevant emission lines are marked with dashed lines. |
Properties of J0217−0208.
3.1. Observations and data reduction
J0217−0208 was observed with JWST in three different GO1 programs: PIDs 1840 (PIs: Alvarez-Marquez and T. Hashimoto; Hashimoto et al. 2023; Sugahara et al. 2025; Mawatari et al. 2026; Usui et al. 2025), 1967 (PI: M. Onoue; Ding et al. 2025; Matsuoka et al. 2025b), and 1657 (PI: Y. Harikane; Harikane et al. 2025). These observations consist of NIRCam images with eight filters and NIRSpec spectroscopy with Fixed-Slit (FS) and Integral Field Spectroscopy (IFS) modes that we now describe.
J0217−0208 was observed with NIRCam with F115W, F150W, F200W, F250M, F300M, F356W, F410M, and F444W filters, consisting of relatively short exposure times (343 to 601 s on source), except for F150W and F356W (3264 s on source). NIRCam data were calibrated using a custom strategy based on the JWST calibration pipeline (version 1.17.1; Bushouse et al. 2025) with Calibration Reference Data System (CRDS) context 1321. This procedure includes the removal of snowballs and wisps following the method described in Bagley et al. (2023), as well as a superbackground homogenization with 1/f correction, adopting the approach of Pérez-González et al. (2023) and incorporating the improvements presented in Pérez-González et al. (2025) and Östlin et al. (2025). J0217−0208 is well detected in all NIRcam images, as shown in the top panel of Fig. 3.
NIRSpec observations of J0217−0208 consist of FS and IFS spectroscopy (Böker et al. 2022; Jakobsen et al. 2022), obtained using the medium- (FS) and high-resolution (IFS) grating/filter combination G395/F290LP, delivering a spectral resolving power of R ∼ 1000 and R ∼ 2700, and continuous wavelength coverage from 2.87 to 5.27 μm. J0217−0208 was observed with FS mode with a total on-source exposure time of 3107 s using the S200A2 slit (0.2″ × 3.3″ size). Data were retrieved from MAST and calibrated using the CRDS context version 11.17.19 and file version 1256. The flux density of the FS spectrum was matched to that obtained from photometry in NIRCam F356W to account for slit-losses. IFS observations, totaling 1750 s exposure time, were calibrated with the JWST pipeline release 1.18.0 (Bushouse et al. 2025), using the CRDS context version 12.1.8 and file version 1364. In addition to the standard three-stage reduction, custom steps are introduced to optimize data quality (e.g., Marshall et al. 2023; Übler et al. 2023; Perna et al. 2023). First, we enable the msa_flagging and outlier_detection modules, which are skipped by default by the pipeline, while the ipc correction step is intentionally omitted. Then, we remove the 1/f noise, which produces vertical striping on the detector images (Perna et al. 2023). Finally, we apply a sigma-clipping routine to the count-rate images to generate a temporal bad/hot pixel mask, flagging pixels as “DO_NOT_USE” if identified as outliers in 3 out of 4 dithers. The final spectral cube was produced with the drizzle algorithm. Figure 3 shows the FS spectra and the collapsed IFS Hβ + [O III] λλ4960,5008 image of J0217−0208.
3.2. Emission line measurements
Given the superior S/N of the NIRSpec/FS spectrum compared to the IFS one, we use it to measure the emission line fluxes of J0217−0208. The spectrum reveals strong emission in Hβ, [O III] λλ4960,5008, and Hα, as well as in several other lines that are typically faint, such as [S II] λλ6718,6732 and the temperature-sensitive [O III] λ4363 line (detected with a ≃6σ significance). The continuum emission is also well detected across the spectral coverage of the G395M grating, with a S/N per pixel ranging from ∼3 to 9. Using the Hβ and [O III] λλ4960,5008 emission lines, we determine the systemic redshift of zsys = 6.2038 ± 0.0001.
We measured the fluxes, equivalent widths, and line widths of the emission lines by fitting each line with a single Gaussian component. As a first step, we modeled and subtracted the underlying continuum using spectral windows of Δλrest = 50 Å on either side of each emission line. The fitting was performed using the Python package curvefit, where the amplitude and line width are treated as free parameters. The centroid of each Gaussian was initially set based on the expected observed wavelength, i.e., λobs = λrest × (1 + z), with redshift z also included as a free parameter. To allow for potential uncertainties in line centroids, we permitted small deviations (up to 10%) in the fit central wavelengths. Additionally, the relative flux ratios of the [N II] and [O III] doublets are fixed to 2.94 and 2.98, respectively. To estimate uncertainties, we repeated the fitting process on 500 simulated spectra, introducing random noise to the observed spectrum. The noise was drawn from a Gaussian distribution with a standard deviation set by the 1σ uncertainty in the observed spectrum.
We find that a single Gaussian component generally provides a decent fit to the spectral profiles of most emission lines. The simultaneous fit of Hβ, [O III], Hα, and [N II] emission lines assuming a single Gaussian component yields a reduced  (with six free parameters). The lines appear only marginally resolved, with observed line widths approximately 10−20% larger than the expected instrumental widths. Thus, we conservatively assumed that the lines are not fully resolved, and we did not correct them for the instrumental broadening. However, the brightest emission lines, Hβ, [O III] λλ4960,5008, Hα, and [N II] λλ6549,6585, exhibit prominent broad wings in their profiles, which are not well reproduced by the best-fit single Gaussian models (shown in orange in Fig. 4).
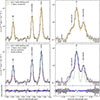 |
Fig. 4. NIRSpec/FS spectrum of J0217−0208 (black) around Hβ + [O III] λλ4960,5008 (left) and Hα + [N II] λλ6549,6585 (right) emission lines. Top panels: best-fit model assuming one Gaussian component for each emission line (orange). Bottom panel: best-fit model assuming two Gaussian components. The total emission is shown as a blue dashed line, while the individual components are shown as dotted lines (green and red for the narrow and broad components). Note that the vertical axes are in logarithmic scales. The gray area represents the ±1σ uncertainty spectrum. The lower subpanels show the residuals of the fits, with yellow and blue points corresponding to the single- and two-component models, respectively. |
To better capture the core and wing components of the Hβ, [O III], Hα, and [N II] lines, we repeat the fitting process using a two-component Gaussian model. The widths of the Gaussian components are constrained to remain consistent across different emission lines, although we take in consideration the variation of the NIRSpec G395M spectral resolution as a function of wavelength (Rigby et al. 2023). As done before, the relative flux ratios of the [N II] and [O III] doublets are fixed to 2.94 and 2.98, respectively, for both the narrow and broad components.
The two-component fit (shown in blue in Fig. 4) provides a significantly improved match to the observed line profiles, particularly in the wings of the lines, with a reduced  (with 12 free parameters). We also calculated the Akaike information criterion (AIC) between the two-component and single-component fits and found that the two-component fit is strongly preferred (ΔAIC = 10.6). The narrow component appears barely resolved only (Δλnarrow = 19.4 ± 3.5 Å). On the other hand, the broad component exhibits a width of FWHMbroad = 595 ± 124 km s−1. We also tested whether a broad component is required to fit the profiles of the fainter emission lines. In these cases, the broad component is not significantly detected, suggesting that the bulk of the emission in the faint lines is well described by a single (narrow) Gaussian component. The flux measurements for the total, narrow, and broad components are listed in Table B.1.
From this point onward, we assumed that the narrow component originates from warm gas tracing the systemic velocity due to virial motions within the galaxy. On the other hand, the broad component (FWHMbroad = 595 ± 124 km s−1, Δv = −34 ± 85 km s−1) is identified with outflowing ionized gas, as it is detected in both Balmer (Hβ and Hα) and metal lines ([O III], [N II]) and is required to explain their broad wings (Fig. 4).
Finally, we also checked the presence of a broad emission in Hα that could be associated with a type-I AGN. We repeated the fitting process but added a broad Hα component with FWHM > 1000 km s−1, hereafter the AGN component, to the narrow and outflow components obtained in the previous fit. We fixed the central wavelengths and line widths of the narrow (Δv = 0 km s−1, FWHMnarrow = 290 km s−1) and outflow (Δv = −34 km s−1, FWHMbroad = 595 km s−1) components while leaving all the amplitudes and the line width of the AGN component as free parameters. Our results indicate that the AGN component is not significantly detected, and we obtain an upper limit of FAGN(Hα)≤6.9 × 10⁻¹⁸ erg s cm−2 (3σ) assuming an AGN FWHM = 1000 km s−1. Our results thus support the lack of type-I AGN activity in J0217−0208 (see also Phillips et al. 2026), or it is heavily obscured.
3.3. Differential dust attenuation and line diagnostics
Thanks to the high S/N of the FS/G395M spectrum of J0217−0208, we could constrain the nebular dust attenuation for the narrow and broad components independently. For the narrow component, we used the flux measurements of Hγ obtained from the single Gaussian fit, along with the narrow components of Hβ and Hα from the two-component fit. For the outflowing gas, we use the broad components of Hβ and Hα.
We assumed Case B recombination for Te = 104 K and ne = 1000 cm−3 (see Sect. 3.4), and we adopted the Cardelli et al. (1989) extinction law with RV = 3.1. We found E(B − V)sys = 0.06 ± 0.05 and E(B − V)out = 0.57 ± 0.26 for the systemic and outflowing components, respectively, which is in excellent agreement with the values reported by Matsuoka et al. (2025b). These values are used to deredden the observed fluxes. For emission lines requiring a two-component fit (Hβ, [O III], Hα, and [N II]), their total dereddened fluxes were obtained by summing the dust-corrected fluxes of the narrow and broad components, each corrected using its respective E(B − V).
Using the total dust-corrected line fluxes, we investigate the nature of the ionizing source in J0217−0208. We first explore the classical Baldwin, Phillips & Terlevich (BPT) diagnostics (Baldwin et al. 1981; Veilleux & Osterbrock 1987), employing the line ratios [O III]/Hβ, [N II]/Hα, [S II]/Hα, and [O I]/Hα. We obtain log([O III]/Hβ) = 0.71 ± 0.08, log([N II]/Hα) = − 0.59 ± 0.07, log([S II]/Hα) = − 1.59 ± 0.05, and log([O I]/Hα)≤ − 2.14 (3σ).
As shown in Fig. 5 and according to Kewley et al. (2006), the derived [O III]/Hβ vs. [S II]/Hα and [O I]/Hα line ratios are consistent with J0217−0208 being powered by star formation, placing it far from the locus of low-z AGNs. However, its position in the [O III]/Hβ vs. [N II]/Hα diagram is more ambiguous, as it lies along the “maximum starburst” curve of Kewley et al. (2001). This could suggest a hard stellar ionizing radiation field (see Steidel et al. 2014), shocks contributing to the line excitation, or a possible non-negligible AGN contribution. Additionally, it may reflect an elevated nitrogen abundance in J0217−0208, similar to that observed in some UV-bright high-z galaxies (Marques-Chaves et al. 2024a; Senchyna et al. 2024; Schaerer et al. 2024; Topping et al. 2024), which could enhance the [N II]/Hα ratio (Stiavelli et al. 2025; Zhang et al. 2026).
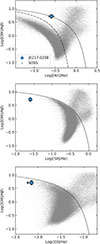 |
Fig. 5. Location of J0217−0208 (blue) on the classic BPT diagnostic diagrams: [O III]/Hβ vs. [N II]/Hα (top), [S II]/Hα (middle) and [O I]/Hα (bottom). The dot-dashed curve in the top panel shows the empirical star-forming/AGN demarcation from Kauffmann et al. (2003), while the dashed curves indicate the maximum starburst lines from Kewley et al. (2001, top) and Kewley et al. (2006, middle and bottom). Gray circles represent local SDSS galaxies for comparison. |
From the non-detection of He IIλ4686, we derived log(He II/Hβ) < − 1.61. According to Shirazi & Brinchmann (2012), this upper limit is consistent with J0217−0208 being powered by star formation, without requiring a hard ionizing source such as an AGN. Finally, we measured [O III]λ4363/Hγ = 0.20 ± 0.03, which aligns with star formation in all models presented by Mazzolari et al. (2024). In short, nearly all line diagnostics examined here indicate that J0217−0208 is a star-forming galaxy with negligible contribution from an AGN.
3.4. Electron density, temperature, and abundances
For the ISM properties, we did not attempt to derive separate physical conditions for the systemic and outflow components and instead focused on the luminosity-weighted properties of the ionized gas. This is because the temperature-sensitive [O III] λ4363 line and the density-sensitive [S II] λλ6716,6731 doublet are only significantly detected in the narrow component, preventing independent measurements of Te and ne for the broad component2. We therefore adopted the electron temperature and density derived from the narrow component and applied them to the total dust-corrected line fluxes when deriving abundances.
Within the spectral coverage of G395M, the [S II] λλ6716/6731 doublet is the only ne-sensitive spectral feature detected with high significance. We obtained [S II] λ6716/λ6731 = 0.88 ± 0.22 and estimated log(ne/cm using the getTemDen task from Pyneb (Luridiana et al. 2015). Assuming log(ne/cm−3) = 3.06 and using the observed [O III] λ4363/λ5008 line ratio of (7.6 ± 0.1)×10−3, we measured Te (O III) = (1.05 ± 0.05)×104 K.
For abundances, we considered O+ and O2+ from [O II] λλ3727,3729 and [O III] λ5008, respectively. While [O II] is not covered by our G395M spectrum, we obtained its flux using the observed line ratio of [O III]/[O II] = 4.39 ± 0.42 from Harikane et al. (2025), and we rescaled and corrected it for dust attenuation. Using the empirical relation of Izotov et al. (2006), we derived an oxygen abundance 12 + log(O/H) = 8.20 ± 0.11, in excellent agreement with that obtained by Harikane et al. (2025). We also relied on Izotov et al. (2006) to derive the nitrogen over oxygen ratio by applying the ionization correction factor ICF(N+) = 6.91, obtaining 12 + log(N/O) = − 0.30. As such, J0217+0208 has a subsolar O/H (≃0.30 Z⊙) and super-solar N/O (≃3.6× solar), as highlighted in Fig. 6.
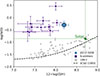 |
Fig. 6. Chemical abundance ratio N/O as a function of O/H. J0217−0208 is shown as a blue circle, while other z ≳ 5 nitrogen emitters are marked by violet squares (compiled by Schaerer et al. 2024; see also Ji et al. 2026 for a more extensive sample). For comparison, low-redshift star-forming galaxies and H II regions from Izotov et al. (2023) are plotted in gray. The dashed line shows the average trend in low-z galaxies, as parameterized by Vila-Costas & Edmunds (1993). |
It is also worth noting that the broad component of [N II] composes a larger fraction of its total flux (≃66% or ≃86% after dust correction) than other lines (Hβ, [O III], Hα; see Fig. 4 and Sect. 3.5). While this may indicate enhanced nitrogen enrichment in the outflowing gas (e.g., Arellano-Córdova et al. 2025; Rizzuti et al. 2025), the lack of independent density and temperature measurements for the broad component prevents us from deriving separate abundances.
3.5. Outflow properties
Section 3.2 shows that the spectral profiles of the Hβ, [O III], Hα, and [N II] emission lines require a narrow and broad components, the latter associated with ionized outflows. This component has a line width of FWHMbroad = 595 ± 124 km s−1 and is centered at Δv = −34 ± 85 km s−1 relative to the systemic velocity. The observed broad-to-narrow flux ratio varies between fout/fsys ≃ 0.25 for [O III] and ≃0.49 for Hα. After correcting for dust attenuation, these values increase by a factor of ∼3 − 5, reaching fout/fsys ≃ 1.25 − 1.64 due to different attenuation levels between the narrow and broad components.
We derive an outflow velocity, defined as vout = |Δv|+FWHMbroad/2, of vout = 331 ± 135 km s−1 (e.g., Arribas et al. 2014). To estimate the total mass of ionized gas in the outflow, Mout, we use the Hα luminosity as a tracer of the ionizing photon production rate (QH), given that Mout ∝ QH/ne, thus Mout ∝ L(Hα)/ne (e.g., Colina et al. 1991). Using the dust-corrected luminosity of the outflowing component, L(Hα) = (3.02 ± 0.4)×1043 erg s−1, and assuming a constant ISM density of ne = 103 cm−3 (Sect. 3.4), we derive log(Mout/M⊙) = 8.07 ± 0.07. The ionized gas mass in the outflow constitutes approximately 62% of the total (systemic + outflowing) ionized gas mass traced by Hα.
To determine the spatial extent of the outflow, reff, out, we use NIRSpec/IFU observations of J0217−0208. Since the IFU data around Hα is noisier and has lower spatial resolution than that around Hβ + [O III], we collapse the 2D emission of Hβ and [O III] λλ4960,5008 using narrow spectral windows of δλrest = ±6 Å centered on these lines. To remove the underlying continuum, we subtract a collapsed IFU spectrum on both sides of the Hβ + [O III] lines, covering λrest = 4400 − 4800 Å and λrest = 5050 − 5450 Å. The resulting NIRSpec/IFU 2D image of Hβ + [O III] emission is shown in Fig. 3.
We fit a 2D Gaussian profile to the Hβ + [O III] emission while masking the region around the faint component ≈0.38″ SW of J0217−0208. We found a circularized FWHM = 0.25″ ± 0.11″. To correct for the instrumental PSF, we used the empirical NIRSpec PSF measurements as a function of wavelength provided by D’Eugenio et al. (2024). At λ = 3.5 − 3.6 μm, the NIRSpec/IFU PSF is around ≃0.11″ − 0.14″ (depending on each method; see D’Eugenio et al. 2024), and we assumed the intermediate value FWHM(PSF) = 0.125″. Thus, the PSF corrected size of the Hβ + [O III] emission is 1.1 ± 0.7 kpc (FWHM), or reff, out = 0.55 ± 0.34 kpc assuming a Gaussian profile. This is consistent with the size derived using the NIRCam/F356W image of J0217−0208, which predominantly traces the Hβ + [O III] emission (Sect. 3.6). We thus assumed a reff, out = 0.55 ± 0.34 kpc for the extension of the outflow. We emphasize, however, that this value should be regarded as an assumption rather than a robust measurement, given the uncertainties in the NIRSpec PSF and the contribution of the narrow component to the ionized gas emission. Considering this size, we obtained an outflowing gas rate,  yr−1, defined as the amount of gas expelled due to the outflow per unit time.
3.6. Morphology and photometry
J0217−0208 shows a compact morphology in the NIRCam images, tracing the rest-UV to optical (top panels of Fig. 3). Additionally, it has a much fainter companion located ≈0.38″ southwest of J0217−0208 (or ≈2.1 kpc proper). A close inspection of the IFS data confirms the same redshift as J0217−0208, suggesting that this faint companion is likely a minor merger. However, we exclude the faint component in this morphological analysis.
We first investigate the light distribution of J0217−0208 using PySersic (Pasha & Miller 2023). PySersic fits the morphology of a source using 2D Sérsic models convolved with a given point-spread function (PSF) and uses a Bayesian framework to understand the degeneracies between different parameters. We generate PSFs for all eight NIRCam filters (F115W to F444W) using WebbPSF. We assume 2D Sérsic profiles with a Sérsic index varying from 0.5 to 6.0, while other parameters such as total flux, ellipticity, and orientation are left free. The fit is performed on a 60 × 60 px cutout centered on J0217−0208, masking the emission from the fainter companion (using a 0.2″-radius aperture).
For the F150W image (λeff, rest ≃ 2000 Å), we obtain an effective radius reff, F150W = 266 ± 10 pc and a Sérsic index n = 1.12 ± 0.10. On the other hand, the morphology in F356W, which traces predominantly the combined emission from Hβ + [O III] lines, shows a more extended profile, with reff, F356W = 575 ± 29 pc and a Sérsic index n = 1.78 ± 0.11, which is in excellent agreement with the size of the Hβ + [O III] emission derived from the NIRSpec/IFU observations (Sect. 3.5).
For the remaining NIRCam bands, the measured sizes are consistent with previous estimates. J0217−0208 exhibits a relatively resolved morphology in bands tracing the stellar continuum, with sizes comparable to those obtained in F150W, albeit with larger uncertainties. In the F444W image, which probes Hα + [N II] emission, J0217−0208 shows a spatial extent similar to that in F356W, with reff, F444W = 646 ± 107 pc. In summary, J0217−0208 shows a compact stellar emission with reff, ★ = 266 ± 10 pc, while its nebular emission appears more extended, with reff, neb = 575 − 650 pc.
Finally, we perform aperture photometry on all NIRCam images. We use relatively large apertures, varying from 0.45″ at shorter wavelengths (F115W) to 0.58″ at longer wavelengths (F444W), to account for the total emission of J0217−0208 and PSF variations across the NIRCam filters. Errors were derived using a circular annulus around the source to estimate the local background noise but include the propagated uncertainties within the photometric aperture. Overall, J02017−0208 shows a steep rest-UV spectral energy distribution (SED), as shown in Fig. 7, with fν(F115W) = 1.42 ± 0.05μJy, fν(F150W) = 1.24 ± 0.03 μJy, and fν(F200W) = 1.02 ± 0.06 μJy, covering the spectral range λrest ≃ 1600 − 2800 Å. A linear fit to these measurements yields a UV slope of βUV = −2.58 ± 0.07. At longer wavelengths, J0217−0208 presents a relatively flat SED, except in NIRCam bands containing bright optical emission lines, Hβ + [O III] (fν(F356W) = 1.78 ± 0.06 μJy) and Hα + [N II] (fν(F444W) = 1.44 ± 0.05 μJy). The aperture photometry agrees well with the fluxes obtained from the PySersic best-fit models, with differences all within ≤1.5σ for all filters (and with a mean of ≃0.9σ).
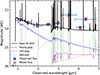 |
Fig. 7. Best-fit SED model (black line) of J0217−0208 using NIRCam photometry (blue squares). The SED is dominated by the emission of a young stellar population characterized by an exponentially declining SFH with an age of 5.5 ± 1.5 Myr (τ = 12.6 ± 6.7 Myr), SFR = 142 ± 24 M⊙ yr−1, and a stellar mass |

3.7. Global properties from SED analysis
We performed SED fitting using the CIGALE code (V.2022.1; Burgarella et al. 2005; Boquien et al. 2019), incorporating photometry from F115W to F444W. The star formation history (SFH) is modeled with two components: one describing the young stellar populations responsible for the observed steep UV slope (βUV = −2.58 ± 0.07), and another accounting for a potential underlying mature stellar population that could contribute to the emission at longer wavelengths. The young stellar component follows an exponentially declining SFH, with τ and age varying from 1 to 20 Myr in 1 Myr steps. The older component assumes a single-burst model with ages from 100 to 500 Myr in 100 Myr steps.
We adopt stellar population models from Bruzual & Charlot (2003), assuming a Chabrier (2003) IMF and metallicities of Z = 0.2 − 0.4 Z⊙, based on our analysis in Sect. 3.4. The ionization parameter ranges from log(U) = −4 to −1 in 1 dex steps. Given the expected differential attenuation between the stellar continuum (βUV ≃ −2.6) and nebular emission, particularly from the outflowing component (E(B − V)out ≃ 0.6), we allowed variations in the ratio of the color excess of the stellar continuum to that of the nebular gas, with E(B − V)★/E(B − V)nebular ranging from 0.1 to 1.0 in 0.1 steps. We adopted the Milky Way dust extinction law from Cardelli et al. (1989) with RV = 3.1 as the dust attenuation law for the nebular emission and the Calzetti et al. (2000) attenuation law for the stellar emission.
Figure 7 shows the best-fit model (black). The emission of J0217−0208 is dominated by a young stellar population in the whole spectral range covered by the NIRCam imaging data (dashed blue line), and it has an age of 5.5 ± 1.5 Myr and τ = 12.6 ± 6.7 Myr. It has a 10 Myr-weighted SFR = 142 ± 24 M⊙ yr−1 and a stellar mass  . We find a stellar color excess of E(B − V)★ = 0.05 ± 0.02 with a E(B − V)★/E(B − V)nebular = 0.6 ± 0.3. On the other hand, the old stellar population is not significantly detected, and its mass should be less than
  (3σ; magenta in Fig. 7). From these results, we obtained a sSFR = 110 ± 15 Gyr−1 assuming only the starburst mass, or sSFR ≥ 32 Gyr−1 (3σ) when the stellar mass of the young and old stellar components are considered. Finally, using the size of reff, ★ derived from the F150W image, we obtain a stellar mass and SFR surface densities of log(ΣM★/M⊙ pc−2) = 3.43 ± 0.37 and log(ΣSFR/M⊙ yr−1 kpc−2) = 2.50 ± 0.08, respectively, which are ∼100× higher than that of typical galaxies at similar redshift (e.g., Calabrò et al. 2024).
4. Discussion
4.1. UV-bright galaxies as young, powerful starbursts with enhanced production of ionizing photons
The young age inferred from the N V P-Cygni profile in the stacked SHELLQs-LAE spectrum,  Myr under the assumption of constant star formation (Sect. 2.3), implies that the bulk of star formation in these systems has taken place within the past ≲15 Myr. This effectively rules out a dominant contribution to the UV luminosity from more extended (≫15 Myr) star formation episodes, indicating that SHELLQs-LAEs are undergoing recent and powerful bursts of star formation. The high specific SFR of one of the SHELLQs-LAEs studied here, J0217−0208 with sSFR = 110 ± 15 Gyr−1 (or sSFR ≥ 32 Gyr−1 if the total mass is considered), corroborates this picture. Furthermore, JWST observations of the few other SHELLQs-LAEs reveal blue UV slopes, βUV ≃ −3.0 (Matsuoka et al. 2025b), indicative of very young (< 5 Myr) star-bursting phases.
These findings imply that UV-bright SHELLQs-LAEs are prolific producers of ionizing photons. We estimated their average ionizing photon production efficiency, defined as  , by integrating the ionizing emission (Qion; i.e., photons with energies > 13.6 eV) from the best-fit BPASS synthetic spectrum and comparing it to the corresponding monochromatic UV luminosity (
 , evaluated at 1600 Å and assumed to be dust-free). We find
  for the averaged population of SHELLQs-LAEs. For J0217−0208, we used its Hα dust-corrected luminosity, LHα = 3.67 × 1043 erg s−1, as a proxy for Qion, and we measured log(ξion, Hα/Hz erg−1) = 25.53 ± 0.04, assuming zero escape fraction of ionizing photons (Fig. 8, but see also Sect. 4.2). For comparison, the best-fit SED of J0217−0208 predicts a log(ξion, SED/Hz erg−1) = 25.64 ± 0.06, i.e., only slightly higher (≃0.11 dex) than that derived using Hα luminosity.
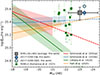 |
Fig. 8. Ionizing photon production efficiency ( |

Figure 8 shows the average ξion obtained for the SHELLQs-LAEs (square), which is approximately 0.34 dex higher than the pre-JWST canonical value reported by Robertson et al. (2015). For comparison, we also include in Fig. 8 measurements of ξion and its relationship with MUV, derived for fainter star-forming galaxies at z ∼ 3 − 9 from recent JWST studies (Simmonds et al. 2024a,b; Llerena et al. 2025, and Pahl et al. 2025; shown in red, blue, green, and orange, respectively, in Fig. 8). While these studies have established ξion − MUV relations for UV-fainter galaxies (solid lines in Fig. 8), we extrapolate those trends to the higher UV luminosities characteristic of the SHELLQs-LAEs (dashed lines). Overall, these extrapolated relations do not fully account for the elevated ξion observed in UV-bright systems such as the SHELLQs-LAEs. That said, the extrapolations from Simmonds et al. (2024b) and Pahl et al. (2025) yield values only slightly lower, around log(ξion/Hz erg−1)≃25.4, but are consistent within our 1σ uncertainties. In contrast, the extrapolated relation from Llerena et al. (2025) predicts significantly lower values, with log(ξion/Hz, erg−1)≲24.7 at MUV ≲ −23, corresponding to a factor of ∼7 lower than what we infer for the SHELLQs-LAEs. For comparison, Fig. 8 also shows the ξion measurements of UV-bright galaxies at z ∼ 6 − 7 from the REBELS survey (green squares; Komarova et al. 2026).
However, potential biases should be considered and discussed. SHELLQs-LAEs are selected for relatively strong Lyα emission (LLyα > 1043 erg s−1; see Sect. 2.1), which may bias the sample toward younger stellar populations with higher ξion. SHELLQs has also identified similarly UV-bright galaxies with weaker Lyα emission (shown in light blue in Fig. 1), whose stacked spectra have been analyzed in previous works (e.g., Harikane et al. 2020a; Matsuoka et al. 2022). However, these spectra show strong damped Lyα absorption that extends into the N Vλ1240 region, preventing reliable estimates of stellar age and ξion. Whether these Lyα-faint counterparts exhibit similarly high ξion remains uncertain and requires further observations. Another source of uncertainty is the stellar metallicity, which remains unconstrained. However, its impact on ξion is expected to be minor: at fixed stellar age, reducing metallicity from 0.5 Z⊙ to 0.05 Z⊙ increases ξion by only ∼0.1 dex (Chisholm et al. 2019). Finally, our best-fit BPASS models assume a standard IMF. Recent evidence (Upadhyaya et al. 2024) suggests that UV-bright galaxies at intermediate redshifts may host very massive stars (VMS; M★ > 100 M⊙), via strong and broad He IIλ1640 emission in their spectra (Crowther et al. 2016; Martins & Palacios 2022; Martins et al. 2025). This could suggest an extended IMF upper mass cutoff  in SHELLQs-LAEs, and their ξion could be boosted by factors of ∼1.5 − 2.0 (Schaerer et al. 2025).
4.2. Strong dusty outflows in J0217−0208
There is compelling evidence of strong, dusty outflows in J0217−0208. First, our analysis of the Hβ, [O III] λλ4960,5008, Hα, and [N II] λλ6549,6585 emission line profiles (Sect. 3.2) clearly reveals a broad component with FWHM = 595 ± 124 km s−1 indicative of high-velocity outflowing gas. Despite known degeneracies in multi-component line fitting, which are accounted for in the uncertainties, the broad component shows a high level of obscuration, with E(B − V)out = 0.57 ± 0.26, significantly higher than that inferred for the systemic narrow-line component, E(B − V)sys = 0.06 ± 0.05 (see also: Rodríguez Del Pino et al. 2024; Crespo Gómez et al. 2025; Parlanti et al. 2025). Furthermore, the stellar continuum of J0217–0208 appears nearly dust-free. Using the UV slope βUV = −2.58 ± 0.07 measured from NIRCam photometry and adopting the Calzetti et al. (2000) extinction law with an intrinsic (dust-free) slope of βUV, 0 = −2.616 (Reddy et al. 2018), we estimate a stellar reddening of E(B − V)★ = 0.01 ± 0.01.
Further support for dusty outflows comes from ALMA observations presented by Harikane et al. (2020b), who detected dust continuum emission at 120 μm and 160 μm. From these measurements, they inferred a dust mass Mdust ≃ 1.8 × 10⁸ M⊙ and a dust temperature Tdust ≃ 25 K (but see Algera et al. 2024). If all dust were confined within the stellar component of J0217–0208 (reff, ★ ≃ 266 pc), the optical depth at 1500 Å would be extreme, of the order of τ1500 ≈ 5000 following Ziparo et al. (2023), and no detectable UV and optical emission from J0217−0208 would be expected. This contradicts observations. Therefore, dust must be physically decoupled from the UV-bright stellar component.
Altogether, our results strongly suggest the presence of strong outflows, carrying and pushing out dust well beyond the stellar emission. Our reanalysis of the ALMA data (Band 7; Fig. 9) shows that the dust emission in J0217–0208 is spatially resolved, with an observed major and minor axis of (1.29″ ± 0.12″)×(0.87″ ± 0.06″) and a beam size 1.10″ × 0.78″ (FWHM). We derive an effective dust radius of reff, dust = 1.37 ± 0.44 kpc, which is substantially more extended than the starlight distribution. This could also explain the relatively low dust temperature measured in J0217–0208 (Tdust ≃ 25 K, Harikane et al. 2020b), which is considerably lower than that for galaxies at similar redshifts (Tdust ≳ 40 K; e.g., Sommovigo et al. 2022; Mitsuhashi et al. 2024) and could result from dust being pushed to the outskirts where the radiation field is weaker. In the following, we investigate possible mechanisms and implications for such dusty outflows.
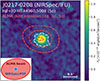 |
Fig. 9. Collapsed Hβ and [O III] λλ4960,5008 map of J0217−0208 from NIRSpec/IFU (5σ, dashed blue contour). The dust continuum emission from ALMA Band 7 is overlaid in red contours (2σ, 3σ, 5σ). The ALMA beam and the NIRSpec/IFU PSF are shown in the lower-left corner. |
Radiative outflows have been recently proposed to explain the overabundance of UV-bright galaxies at z > 10 and their observed steep UV slopes (Ferrara et al. 2023, 2025; Fiore et al. 2023; Ferrara 2024; Nakazato & Ferrara 2025). In this so-called “Attenuation-Free Model” (AFM), strong outflows are driven by radiation pressure onto dust and gas through super-Eddington phases expected in the early phases of a starburst. Specifically, Fiore et al. (2023) and Ferrara et al. (2023) suggest that radiation-driven outflows are efficiently triggered once the sSFR exceeds a critical threshold of sSFR > 25 Gyr−1 (or sSFR > 12 Gyr−1 following Nakazato & Ferrara 2025). This condition is clearly satisfied in J0217–0208 (sSFR ≥ 32 Gyr−1 at 3σ; see Sect. 3.7 for details). However, given the rather extreme compactness and high surface densities of J0217–0208, additional conditions may be required to effectively drive a radiative outflow (e.g., Menon et al. 2023). Following Ziparo et al. (2023), and given the log(ΣSFR/M⊙ yr−1 kpc−2) ≃ 2.50 measured for J0217–0208, radiation pressure exceeds gravitational pressure when the burstiness parameter ks ≥ 12, which quantifies the deviation from the canonical Kennicutt–Schmidt relation (such that  ). This translates to an upper limit on the gas surface density of log(Σgas/M⊙ pc−2) ≤ 3.58. Assuming gas and stars have the same size, this implies a high star-formation efficiency of ϵSF ≥ 0.43 (assuming ϵSF = M★/[M★ + Mgas]) for an efficient radiation-driven outflow. This is somewhat consistent with the numerical radiation hydrodynamic simulations of Menon et al. (2023), who find super-Eddington phases in similarly compact systems once high ϵSF are reached (see also: Menon et al. 2025). The extreme starbursting nature of J0217–0208, able to form M★ ≈ 109 M⊙ in just ≈6 Myr, and its elevated surface densities further suggests that enhanced/high star formation efficiencies are likely at play (Dekel et al. 2023). Therefore, high star formation efficiencies and radiation-driven outflows are likely causally linked, as suggested by recent works (Dessauges-Zavadsky et al. 2025; Somerville et al. 2025).
An alternative explanation is mechanical feedback from supernova (SNe) explosions. Unlike radiative-driven outflows, SNe-driven feedback is inherently delayed by a certain amount of time after the burst of star formation (≃3 − 10 Myr), depending on the upper mass limit for SNe, which is still unconstrained (e.g., Smartt 2015). If all O-type stars explode as SNe, we expect significant mechanical feedback right after the explosion of the most massive stars ( ∼ 100 M⊙), i.e., ≃3 Myr after the onset of star formation. Considering the age derived for J0217–0208 (5.5 ± 1.5 Myr), this would allow a window of ∼1 − 4 Myr for significant SN feedback. On the other hand, if only lower-mass O-type stars (< 20 M⊙) explode as SNe (Sukhbold et al. 2016), the onset of mechanical feedback could be delayed by ≳7 Myr, making significant SNe-driven outflows unlikely at the current evolutionary stage of J0217–0208. However, these estimates are simplified and do not account for cumulative SNe from previous (≫10 Myr) episodes of star formation, which are likely required to explain the large dust mass observed in J0217–0208.
Whether mechanically or radiatively driven, the strong and heavily obscured outflow observed in J0217–0208 appears essential for clearing dust along its line of sight. Because gas and dust are the main sources of LyC opacity, these outflows may also facilitate the escape of a significant fraction of ionizing photons in J0217–0208, given its steep UV slope (βUV = −2.58; Chisholm et al. 2022), but relatively weak nebular emission (EW0 (Hβ) ≃ 57 Å; Zackrisson et al. 2013), the small Lyα offset relative to the systemic velocity (Δv ≃ 250 km s−1; Izotov et al. 2018), and the high SFR surface density (log(ΣSFR/M⊙ yr−1 kpc−2) ≃ 2.50; Naidu et al. 2020), all pointing to a LyC escape fraction between  and ≈75% depending on each indicator.
4.3. Comparison with literature and final remarks on UV-bright systems
Ultraviolet-bright systems such as SHELLQs-LAEs (MUV < −22.0) are rare at any redshift. Here, we compare the properties of SHELLQs-LAEs with other UV-bright sources discovered in wide-area surveys. However, a direct quantitative comparison is challenging because the available datasets differ in several aspects, including wavelength coverage, depth, and spectral resolution, which can bias the inferred physical properties.
The BoRG survey (e.g., Trenti et al. 2011) targeted luminous (MUV ∼ −21) galaxies at z ∼ 8 identified from HST pure-parallel observations. Follow-up JWST observations of a subset of these sources (marked in red in Fig. 1) have revealed steep UV slopes, with all (20) but three showing βUV < −2.0, consistent with negligible dust extinction (Roberts-Borsani et al. 2025). Some BoRG sources, including the brightest ones (MUV ≲ −22.0), exhibit Lyα emission in their NIRSpec/PRISM spectra (Roberts-Borsani et al. 2025), although no quantitative measurements on Lyα properties are available so far. Furthermore, the star-formation histories derived by Rojas-Ruiz et al. (2026) suggest that BoRG galaxies are undergoing major bursts of star formation, consistent with the results obtained for SHELLQs-LAEs.
Another well-studied population of UV-bright galaxies is provided by the REBELS survey (Bouwens et al. 2022, with −21.5 < MUV < −23.0; green in Fig. 1), which identified relatively massive systems (log(M★/M⊙)≃8.5 − 10.0) with short light-weighted ages and high sSFRs, particularly among the UV-brightest members (sSFR ≃ 30 Gyr−1 for MUV < −22.0 systems; Topping et al. 2022). While REBELS galaxies also show relatively steep UV slopes (βUV ∼ −2.0; Bouwens et al. 2022; Bowler et al. 2024; Fisher et al. 2025), they contain, on average, substantial dust reservoirs (log(Mdust/M⊙)≃7.0 − 7.5; Dayal et al. 2022), suggesting that UV- and far-IR–emitting regions of, at least, some of these sources are not cospatial (Ferrara et al. 2022), a scenario that is also seen in the SHELLQs-LAE J0217–0208 (see Sect. 4.2). Whether this segregation is a consequence of strong feedback, as indicated for J0217–0208, remains unclear, but it could partly explain the relatively strong and redshifted Lyα emission detected in several REBELS UV-bright sources (Endsley et al. 2022).
At lower redshifts, UV-bright systems with comparable or even higher luminosities have been discovered in the wide-area SDSS/BOSS survey (Marques-Chaves et al. 2020a, 2021, 2022, 2024b; Upadhyaya et al. 2024; Dessauges-Zavadsky et al. 2025). These systems at z ∼ 2 − 4 are even brighter (−23.0 < MUV < −24.5) than their higher-z counterparts and are characterized by powerful starbursts with young ages (≲10 Myr) and high specific SFRs (∼100 Gyr−1), as revealed by strong stellar winds in rest-frame UV spectra (Fig. 2B2). Similar to REBELS sources and J0217–0208, these z ∼ 2 − 4 UV-bright galaxies also contain large dust masses, log(Mdust/M⊙)≃7.0–8.0 (Dessauges-Zavadsky et al. 2025). In many cases, dust emission appears more extended (by factors of ∼2 − 5) than the UV-optical distribution, which itself shows negligible dust obscuration (βUV ranging from −1.84 to −3.50). Evidence of strong outflows is, however, scarce, being detected in only a few cases (Álvarez-Márquez et al. 2021; Marques-Chaves et al. 2021). Moreover, ALMA observations of their molecular gas reveal short depletion timescales (tdepl ≃ 10 − 70 Myr) and high star-formation efficiencies (ϵSF = 8% to > 40%), indicating that these starbursts are caught at the very beginning of stellar mass build-up, during a phase of efficient gas-to-stars conversion (Dessauges-Zavadsky et al. 2025).
Figure 10 compares the UV slopes and MUV of several SHELLQs-LAEs (circles) with those of BoRG (pentagons), REBELS (squares), and lower-redshift UV-bright galaxies selected from SDSS/BOSS (diamonds). Some of these sources have detections of dust emission (solid symbols), with dust-to-stellar mass ratios ranging from log ξd ≃ − 2.8 to ≃ − 0.9 (Harikane et al. 2020b; Dayal et al. 2022; Dessauges-Zavadsky et al. 2025). Despite this, many exhibit steep UV slopes, consistent with little (βUV ∼ −2.0, or AUV ∼ 1.0 mag) to negligible (βUV ≲ − 2.5, or AUV ∼ 0 mag) dust obscuration, as also seen for some of the UV-brightest systems at z > 10 (gray in Fig. 10). This behavior resembles the scenario proposed by Ferrara et al. (2023), in which strong outflows clear dust along the line of sight, a feature that is observed in J0217−0208 through its powerful and heavily obscured ionized outflow.
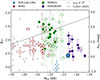 |
Fig. 10. Ultraviolet slope (βUV) as a function of MUV for SHELLQs-LAEs at z ∼ 6 (circles; this work and Matsuoka et al. 2025b), BORG galaxies at z ∼ 8 (pentagons; Roberts-Borsani et al. 2025), REBELS sources at z ∼ 6.5 − 8.5 (squares; Bouwens et al. 2022; Fisher et al. 2025), UV-bright systems from SDSS/BOSS at z ∼ 2 − 4 (diamonds; Dessauges-Zavadsky et al. 2025), and z ≥ 10 sources confirmed with JWST. Sources with detected dust emission are shown with solid symbols, while sources without dust detection or with no dust observations are shown with empty symbols. The dashed line represents the βUV − MUV relationship of Cullen et al. (2023) derived from fainter sources. |
Taken together, these populations of UV-bright galaxies suggest a common physical picture in which UV-luminous systems trace short-lived but intense starburst phases, characterized by rapid stellar mass assembly, efficient ionizing photon production, and complex dust–gas geometries. In light of recent JWST discoveries of unexpectedly UV-luminous galaxies at z > 10, our results emphasize the interplay between very young stellar populations (e.g., Roberts-Borsani et al. 2026), powerful outflows, and likely elevated star formation efficiencies, all of which act to boost the UV luminosities. As a final remark, some of the extreme properties inferred for J0217−0208, such as its steep UV slope, high SFR and stellar mass surface densities, and nitrogen enhancement, closely resemble those of the most UV-luminous systems at z > 10, suggesting a shared mode of star formation and chemical enrichment. Future detailed studies of larger samples of UV-bright galaxies, including SHELLQs-LAEs and sources to be identified in upcoming wide-field surveys such as Euclid and Roman (e.g., Weaver et al. 2025), will be crucial to firmly establishing these connections.
5. Conclusions
In this work, we have investigated the properties of 27 very UV-bright (−22.0 ≲ MUV ≲ −24.4) Lyα emitters (LLyα > 1043.0 erg s−1) at z ∼ 6 drawn from the SHELLQs survey. In the first part of this study, we focused on the average rest-frame UV properties of these sources, referred to as SHELLQs-LAEs. By stacking individual optical spectra from ground-based observations, we constructed a composite rest-UV spectrum and obtained the following key results.
The stacked UV spectrum of SHELLQs-LAEs (Fig. 1) exhibits a narrow Lyα emission line (≃600 km s−1 FWHM) and a prominent N Vλ1240 P-Cygni profile, characterized by blueshifted absorption and redshifted emission. Comparison with BPASS stellar population synthesis models suggests that this feature is well reproduced by a very young stellar population with an age of  Myr under the assumption of constant star formation. We investigated whether AGN activity could explain the observed spectral signatures but concluded that their contribution to the UV luminosity or frequency in the sample is likely small.
These findings imply that the strong UV luminosity of these sources arises from the emission of a large number of massive and hot stars, making SHELLQs-LAEs highly efficient ionizing sources. We derived an average ionizing photon production efficiency of  , which is significantly higher than canonical pre-JWST values and extrapolations from UV-fainter galaxies observed with JWST. Ultraviolet-bright systems such as SHELLQs-LAEs are therefore intense starbursts capable of forming at least ≈109 M⊙ of stars within < 15 Myr, modulo dust attenuation.
In the second part of this work, we analyzed JWST observations of a representative SHELLQs-LAE, J0217−0208, at z = 6.204 with MUV = −23.4. The dataset comprises deep imaging in eight NIRCam filters (from F115W to F444W) as well as NIRSpec integral field and fixed-slit spectroscopy with the G395M grating (λ = 2.8–5.2 μm, R ∼ 1000). From these observations, we derived the following results:
-
Based on NIRCam photometry, we obtained a best-fit SED characterized by a young starburst with an age of 5.5 ± 1.5 Myr (with an e-folding timescale τ = 12.6 ± 6.7 Myr), an SFR of 142 ± 24 M⊙ yr−1, and a stellar mass of
 . The total stellar mass of J0217−0208 can be as high as
  (3σ), owing to the presence of a significant old stellar population that is outshined by the powerful starburst. J0217−0208 thus presents a high sSFR of 110 ± 15 Gyr−1, or sSFR ≥ 32 Gyr−1 (3σ) when the total stellar mass is considered.
 -
J0217−0208 exhibits a compact morphology in the NIRCam bands tracing the rest-frame UV continuum, with an effective radius of reff = 266 ± 10 pc. However, it appears moderately more extended in the F356W and F444W bands, where nebular emission from Hβ+[O III] and Hα + [N II] contributes significantly, respectively. We measured a high stellar mass and SFR surface densities of log(ΣM★/M⊙ pc−2) = 3.43 ± 0.37 and log(ΣSFR/M⊙ yr−1 kpc−2) = 2.50 ± 0.08, respectively.
-
The NIRSpec spectrum revealed a high S/N detection of both the stellar continuum and several optical emission lines. Several line diagnostics suggest that J0217−0208 is powered by star formation without any strong evidence of a dominant AGN. Using the [S II] λλ6716/6731 doublet, we measured a relatively high electron density, log(ne/cm
 . From the Te-sensitive [O III] λ4363 line, we measured Te (O III) = (1.05 ± 0.05)×104 K, for which we obtained log(O/H) = 8.20 ± 0.11. J0217−0208 also shows a supersolar nitrogen abundance of log(N/O) = −0.30.
 -
The brightest rest-optical lines (Hβ, [O III], and Hα, [N II]) require a broad kinematic component with FWHM = 595 ± 124 km s−1, which is indicative of high-velocity outflowing gas. This broad component is heavily obscured, with E(B − V)out = 0.57 ± 0.26, in contrast to the nearly dust-free systemic narrow component, E(B − V)sys = 0.06 ± 0.05, and stellar continuum, E(B − V)★ = 0.01 ± 0.01), which shows a steep UV slope of βUV = −2.58 ± 0.07.
Our results suggest that powerful dusty outflows are key to simultaneously explaining several (a priori inconsistent) properties of J0217–0208, including its nearly dust-free stellar emission and the large dust mass (log(Mdust/M⊙)≃8.3), spatial extension (reff, dust ≃ 1.4 kpc), and low temperature (Tdust ≃ 25 K) inferred from ALMA observations. Whether mechanically or radiatively driven, these outflows appear capable of expelling dust and gas well beyond the stellar core, enabling J0217–0208 to appear exceptionally UV bright. Such strong feedback may also have important implications, including a non-negligible escape of ionizing photons ( ).
).
In short, our results indicate that UV-luminous SHELLQs-LAEs, and likely other similar UV-bright sources, represent intense starburst phases characterized by efficient ionizing photon production and rapid stellar mass growth within only a few megayears. The case of J0217−0208 illustrates how young stellar populations with high sSFRs, feedback-driven outflows, and potentially enhanced star-formation efficiencies can act together to amplify the observed UV luminosities. Moreover, some of the most extreme properties derived for J0217−0208, including supersolar N/O at low O/H, a steep UV slope, compact morphologies, and very high SFR and stellar mass surface densities, closely resemble those of the UV-brightest galaxies at z > 10, suggesting a shared chemical enrichment and galaxy formation pathway. Systematic studies of larger samples of UV-bright galaxies, such as SHELLQs-LAEs and future discoveries from next-generation wide-field surveys with Euclid and Roman, will be essential to establishing whether these mechanisms are ubiquitous among such extreme systems and to evaluating their broader role in early galaxy formation, evolution, and cosmic reionization.
Acknowledgments
We thank the anonymous referee for useful comments. This work is based on observations made with the NASA/ESA/CSA James Webb Space Telescope. The data were obtained from the Mikulski Archive for Space Telescopes at the Space Telescope Science Institute, which is operated by the Association of Universities for Research in Astronomy, Inc., under NASA contract NAS 5-03127 for JWST. These observations are associated with programs #1657, 1840, and 1967. Some of the data products presented herein were retrieved from the Dawn JWST Archive (DJA). DJA is an initiative of the Cosmic Dawn Center (DAWN), which is funded by the Danish National Research Foundation under grant DNRF140. J.A.-M., L.C., C.B.-P., L.C., and S.A. acknowledge support by grant CSIC/BILATERALES2025/BIJSP25022. J.A.M. and C.B.P. acknowledge support by grant PID2024-158856NA-I00 from the Spanish Ministry of Science and Innovation/State Agency of Research MCIN/AEI/10.13039/501100011033 and by “ERDF A way of making Europe”. L.C., J.A.M., and S.A. acknowledge support by grant PIB2021-127718NB-100 from the Spanish Ministry of Science and Innovation/State Agency of Research MCIN/AEI/10.13039/501100011033 and by “ERDF A way of making Europe”. C.B.P. acknowledges the support of the Consejería de Educación, Ciencia y Universidades de la Comunidad de Madrid through grants No. PEJ-2021-AI/TIC-21517 and PIPF-2023/TEC29505. N.Y. acknowledges financial support from JSPS Specially Promoted Research 24H00004. M.H. is supported by Japan Society for the Promotion of Science (JSPS) KAKENHI Grant No. 22H04939. Y.W.R. is supported by JSPS KAKENHI Grant Number 23KJ2052. K.M. is supported by JSPS KAKENHI grant Number 20K14516. K.M. and A.K.I are supported by JSPS KAKENHI grant No. 23H00131. Y.N. is supported by JSPS KAKENHI Grant Number 23KJ0728 and a JSR fellowship. D.C. is supported by research grant PID2021-122603NB-C21 funded by the Ministerio de Ciencia, Innovación y Universidades (MI-CIU/FEDER) and the research grant CNS2024-154550 funded by MI-CIU/AEI/10.13039/501100011033. A.C.G. acknowledges support by JWST contract B0215/JWST-GO-02926. T.H. was supported by Leading Initiative for Excellent Young Researchers, MEXT, Japan (HJH02007) and by JSPS KAKENHI grant Nos. 22H01258, 23K22529, and 25K00020. M.O. is supported by the Japan Society for the Promotion of Science (JSPS) KAKENHI Grant Number 24K22894.
References
- Alexandroff, R., Strauss, M. A., Greene, J. E., et al. 2013, MNRAS, 435, 3306 [NASA ADS] [CrossRef] [Google Scholar]
- Algera, H. S. B., Inami, H., Sommovigo, L., et al. 2024, MNRAS, 527, 6867 [Google Scholar]
- Álvarez-Márquez, J., Marques-Chaves, R., Colina, L., & Pérez-Fournon, I. 2021, A&A, 647, A133 [NASA ADS] [CrossRef] [EDP Sciences] [Google Scholar]
- Álvarez-Márquez, J., Crespo Gómez, A., Colina, L., et al. 2025, A&A, 695, A250 [NASA ADS] [CrossRef] [EDP Sciences] [Google Scholar]
- Arellano-Córdova, K. Z., Berg, D. A., Mingozzi, M., et al. 2025, MNRAS, 544, 1588 [Google Scholar]
- Arrabal Haro, P., Dickinson, M., Finkelstein, S. L., et al. 2023, ApJ, 951, L22 [NASA ADS] [CrossRef] [Google Scholar]
- Arribas, S., Colina, L., Bellocchi, E., Maiolino, R., & Villar-Martín, M. 2014, A&A, 568, A14 [NASA ADS] [CrossRef] [EDP Sciences] [Google Scholar]
- Bagley, M. B., Finkelstein, S. L., Koekemoer, A. M., et al. 2023, ApJ, 946, L12 [NASA ADS] [CrossRef] [Google Scholar]
- Baldwin, J. A., Phillips, M. M., & Terlevich, R. 1981, PASP, 93, 5 [Google Scholar]
- Berg, D. A., James, B. L., King, T., et al. 2022, ApJS, 261, 31 [NASA ADS] [CrossRef] [Google Scholar]
- Böker, T., Arribas, S., Lützgendorf, N., et al. 2022, A&A, 661, A82 [NASA ADS] [CrossRef] [EDP Sciences] [Google Scholar]
- Boquien, M., Burgarella, D., Roehlly, Y., et al. 2019, A&A, 622, A103 [NASA ADS] [CrossRef] [EDP Sciences] [Google Scholar]
- Bouwens, R. J., Illingworth, G. D., van Dokkum, P. G., et al. 2022, ApJ, 927, 81 [NASA ADS] [CrossRef] [Google Scholar]
- Bowler, R. A. A., Jarvis, M. J., Dunlop, J. S., et al. 2020, MNRAS, 493, 2059 [Google Scholar]
- Bowler, R. A. A., Inami, H., Sommovigo, L., et al. 2024, MNRAS, 527, 5808 [Google Scholar]
- Boylan-Kolchin, M. 2025, MNRAS, 538, 3210 [Google Scholar]
- Brotherton, M. S., Tran, H. D., Becker, R. H., et al. 2001, ApJ, 546, 775 [NASA ADS] [CrossRef] [Google Scholar]
- Bruzual, G., & Charlot, S. 2003, MNRAS, 344, 1000 [NASA ADS] [CrossRef] [Google Scholar]
- Bunker, A. J., Saxena, A., Cameron, A. J., et al. 2023, A&A, 677, A88 [NASA ADS] [CrossRef] [EDP Sciences] [Google Scholar]
- Burgarella, D., Buat, V., & Iglesias-Páramo, J. 2005, MNRAS, 360, 1413 [NASA ADS] [CrossRef] [Google Scholar]
- Bushouse, H., Eisenhamer, J., Dencheva, N., et al. 2025, https://doi.org/10.5281/zenodo.15178003 [Google Scholar]
- Calabrò, A., Pentericci, L., Santini, P., et al. 2024, A&A, 690, A290 [NASA ADS] [CrossRef] [EDP Sciences] [Google Scholar]
- Calzetti, D., Armus, L., Bohlin, R. C., et al. 2000, ApJ, 533, 682 [NASA ADS] [CrossRef] [Google Scholar]
- Cardelli, J. A., Clayton, G. C., & Mathis, J. S. 1989, ApJ, 345, 245 [Google Scholar]
- Carniani, S., Hainline, K., D’Eugenio, F., et al. 2024, Nature, 633, 318 [CrossRef] [Google Scholar]
- Castellano, M., Napolitano, L., Fontana, A., et al. 2024, ApJ, 972, 143 [Google Scholar]
- Ceverino, D., Nakazato, Y., Yoshida, N., Klessen, R. S., & Glover, S. C. O. 2024, A&A, 689, A244 [NASA ADS] [CrossRef] [EDP Sciences] [Google Scholar]
- Chabrier, G. 2003, ApJ, 586, L133 [NASA ADS] [CrossRef] [Google Scholar]
- Chisholm, J., Rigby, J. R., Bayliss, M., et al. 2019, ApJ, 882, 182 [Google Scholar]
- Chisholm, J., Saldana-Lopez, A., Flury, S., et al. 2022, MNRAS, 517, 5104 [CrossRef] [Google Scholar]
- Ciesla, L., Elbaz, D., Ilbert, O., et al. 2024, A&A, 686, A128 [NASA ADS] [CrossRef] [EDP Sciences] [Google Scholar]
- Colina, L., Sparks, W. B., & Macchetto, F. 1991, ApJ, 370, 102 [Google Scholar]
- Crespo Gómez, A., Tamura, Y., Colina, L., et al. 2025, A&A, submitted [arXiv:2511.14658] [Google Scholar]
- Crowther, P. A., Caballero-Nieves, S. M., Bostroem, K. A., et al. 2016, MNRAS, 458, 624 [Google Scholar]
- Cullen, F., McLure, R. J., McLeod, D. J., et al. 2023, MNRAS, 520, 14 [NASA ADS] [CrossRef] [Google Scholar]
- Dayal, P., Ferrara, A., Sommovigo, L., et al. 2022, MNRAS, 512, 989 [NASA ADS] [CrossRef] [Google Scholar]
- de Graaff, A., Brammer, G., Weibel, A., et al. 2025, A&A, 697, A189 [NASA ADS] [CrossRef] [EDP Sciences] [Google Scholar]
- Dekel, A., Sarkar, K. C., Birnboim, Y., Mandelker, N., & Li, Z. 2023, MNRAS, 523, 3201 [NASA ADS] [CrossRef] [Google Scholar]
- Dessauges-Zavadsky, M., Marques-Chaves, R., Schaerer, D., et al. 2025, A&A, 693, A17 [NASA ADS] [CrossRef] [EDP Sciences] [Google Scholar]
- D’Eugenio, F., Pérez-González, P. G., Maiolino, R., et al. 2024, Nat. Astron., 8, 1443 [CrossRef] [Google Scholar]
- Ding, X., Onoue, M., Silverman, J. D., et al. 2025, ApJ, 993, 91 [Google Scholar]
- Donnan, C. T., Dickinson, M., Taylor, A. J., et al. 2025, ApJ, 993, 224 [Google Scholar]
- Eldridge, J. J., Stanway, E. R., Xiao, L., et al. 2017, PASA, 34, e058 [Google Scholar]
- Endsley, R., Stark, D. P., Bouwens, R. J., et al. 2022, MNRAS, 517, 5642 [NASA ADS] [CrossRef] [Google Scholar]
- Ferrara, A. 2024, A&A, 684, A207 [NASA ADS] [CrossRef] [EDP Sciences] [Google Scholar]
- Ferrara, A., Sommovigo, L., Dayal, P., et al. 2022, MNRAS, 512, 58 [NASA ADS] [CrossRef] [Google Scholar]
- Ferrara, A., Pallottini, A., & Dayal, P. 2023, MNRAS, 522, 3986 [NASA ADS] [CrossRef] [Google Scholar]
- Ferrara, A., Pallottini, A., & Sommovigo, L. 2025, A&A, 694, A286 [NASA ADS] [CrossRef] [EDP Sciences] [Google Scholar]
- Fiore, F., Ferrara, A., Bischetti, M., Feruglio, C., & Travascio, A. 2023, ApJ, 943, L27 [NASA ADS] [CrossRef] [Google Scholar]
- Fisher, R., Bowler, R. A. A., Stefanon, M., et al. 2025, MNRAS, 539, 109 [Google Scholar]
- Fudamoto, Y., Oesch, P. A., Walter, F., et al. 2024, MNRAS, 530, 340 [NASA ADS] [CrossRef] [Google Scholar]
- Hainline, K. N., Shapley, A. E., Greene, J. E., & Steidel, C. C. 2011, ApJ, 733, 31 [NASA ADS] [CrossRef] [Google Scholar]
- Hamann, F., & Ferland, G. 1999, ARA&A, 37, 487 [Google Scholar]
- Harikane, Y., Laporte, N., Ellis, R. S., & Matsuoka, Y. 2020a, ApJ, 902, 117 [NASA ADS] [CrossRef] [Google Scholar]
- Harikane, Y., Ouchi, M., Inoue, A. K., et al. 2020b, ApJ, 896, 93 [Google Scholar]
- Harikane, Y., Ono, Y., Ouchi, M., et al. 2022, ApJS, 259, 20 [NASA ADS] [CrossRef] [Google Scholar]
- Harikane, Y., Sanders, R. L., Ellis, R., et al. 2025, ApJ, 993, 204 [Google Scholar]
- Hashimoto, T., Álvarez-Márquez, J., Fudamoto, Y., et al. 2023, ApJ, 955, L2 [NASA ADS] [CrossRef] [Google Scholar]
- Heintz, K. E., Watson, D., Brammer, G., et al. 2024, Science, 384, 890 [NASA ADS] [CrossRef] [Google Scholar]
- Hutter, A., Cueto, E. R., Dayal, P., et al. 2025, A&A, 694, A254 [NASA ADS] [CrossRef] [EDP Sciences] [Google Scholar]
- Izotov, Y. I., Stasińska, G., Meynet, G., Guseva, N. G., & Thuan, T. X. 2006, A&A, 448, 955 [CrossRef] [EDP Sciences] [Google Scholar]
- Izotov, Y. I., Worseck, G., Schaerer, D., et al. 2018, MNRAS, 478, 4851 [Google Scholar]
- Izotov, Y. I., Schaerer, D., Worseck, G., et al. 2023, MNRAS, 522, 1228 [NASA ADS] [CrossRef] [Google Scholar]
- Jakobsen, P., Ferruit, P., Alves de Oliveira, C., et al. 2022, A&A, 661, A80 [NASA ADS] [CrossRef] [EDP Sciences] [Google Scholar]
- Ji, X., Belokurov, V., Maiolino, R., et al. 2026, MNRAS, 545, staf2110 [Google Scholar]
- Kannan, R., Springel, V., Hernquist, L., et al. 2023, MNRAS, 524, 2594 [CrossRef] [Google Scholar]
- Kauffmann, G., Heckman, T. M., Tremonti, C., et al. 2003, MNRAS, 346, 1055 [Google Scholar]
- Kerutt, J., Wisotzki, L., Verhamme, A., et al. 2022, A&A, 659, A183 [NASA ADS] [CrossRef] [EDP Sciences] [Google Scholar]
- Kewley, L. J., Dopita, M. A., Sutherland, R. S., Heisler, C. A., & Trevena, J. 2001, ApJ, 556, 121 [Google Scholar]
- Kewley, L. J., Groves, B., Kauffmann, G., & Heckman, T. 2006, MNRAS, 372, 961 [Google Scholar]
- Komarova, L., Stefanon, M., Laza-Ramos, A., et al. 2026, ApJ, 1000, 228 [Google Scholar]
- Konno, A., Ouchi, M., Nakajima, K., et al. 2016, ApJ, 823, 20 [Google Scholar]
- Kravtsov, A., & Belokurov, V. 2024, ArXiv e-prints [arXiv:2405.04578] [Google Scholar]
- Leitherer, C., Byler, N., Lee, J. C., & Levesque, E. M. 2018, ApJ, 865, 55 [NASA ADS] [CrossRef] [Google Scholar]
- Li, Z., Dekel, A., Sarkar, K. C., et al. 2024, A&A, 690, A108 [NASA ADS] [CrossRef] [EDP Sciences] [Google Scholar]
- Llerena, M., Pentericci, L., Napolitano, L., et al. 2025, A&A, 698, A302 [NASA ADS] [CrossRef] [EDP Sciences] [Google Scholar]
- Lovell, C. C., Harrison, I., Harikane, Y., Tacchella, S., & Wilkins, S. M. 2023, MNRAS, 518, 2511 [Google Scholar]
- Luridiana, V., Morisset, C., & Shaw, R. A. 2015, A&A, 573, A42 [NASA ADS] [CrossRef] [EDP Sciences] [Google Scholar]
- Marconcini, C., D’Eugenio, F., Maiolino, R., et al. 2025, A&A, 699, A154 [NASA ADS] [CrossRef] [EDP Sciences] [Google Scholar]
- Marques-Chaves, R., Álvarez-Márquez, J., Colina, L., et al. 2020a, MNRAS, 499, L105 [Google Scholar]
- Marques-Chaves, R., Pérez-Fournon, I., Shu, Y., et al. 2020b, MNRAS, 492, 1257 [Google Scholar]
- Marques-Chaves, R., Schaerer, D., Álvarez-Márquez, J., et al. 2021, MNRAS, 507, 524 [NASA ADS] [CrossRef] [Google Scholar]
- Marques-Chaves, R., Schaerer, D., Álvarez-Márquez, J., et al. 2022, MNRAS, 517, 2972 [CrossRef] [Google Scholar]
- Marques-Chaves, R., Schaerer, D., Kuruvanthodi, A., et al. 2024a, A&A, 681, A30 [NASA ADS] [CrossRef] [EDP Sciences] [Google Scholar]
- Marques-Chaves, R., Schaerer, D., Vanzella, E., et al. 2024b, A&A, 691, A87 [NASA ADS] [CrossRef] [EDP Sciences] [Google Scholar]
- Marques-Chaves, R., Martins, F., Schaerer, D., Dessauges-Zavadsky, M., & Palacios, A. 2026, A&A, in press, https://doi.org/10.1051/0004-6361/202660493 [Google Scholar]
- Marshall, M. A., Perna, M., Willott, C. J., et al. 2023, A&A, 678, A191 [NASA ADS] [CrossRef] [EDP Sciences] [Google Scholar]
- Martins, F., & Palacios, A. 2022, A&A, 659, A163 [NASA ADS] [CrossRef] [EDP Sciences] [Google Scholar]
- Martins, F., Palacios, A., Schaerer, D., & Marques-Chaves, R. 2025, A&A, 698, A262 [NASA ADS] [CrossRef] [EDP Sciences] [Google Scholar]
- Mason, C. A., Trenti, M., & Treu, T. 2023, MNRAS, 521, 497 [NASA ADS] [CrossRef] [Google Scholar]
- Matsuoka, Y., Onoue, M., Kashikawa, N., et al. 2016, ApJ, 828, 26 [Google Scholar]
- Matsuoka, Y., Iwasawa, K., Onoue, M., et al. 2018a, ApJS, 237, 5 [Google Scholar]
- Matsuoka, Y., Onoue, M., Kashikawa, N., et al. 2018b, PASJ, 70, S35 [Google Scholar]
- Matsuoka, Y., Iwasawa, K., Onoue, M., et al. 2019, ApJ, 883, 183 [Google Scholar]
- Matsuoka, Y., Iwasawa, K., Onoue, M., et al. 2022, ApJS, 259, 18 [NASA ADS] [CrossRef] [Google Scholar]
- Matsuoka, Y., Iwasawa, K., Onoue, M., et al. 2025a, ApJS, 280, 68 [Google Scholar]
- Matsuoka, Y., Onoue, M., Iwasawa, K., et al. 2025b, ApJ, 988, 57 [Google Scholar]
- Matthee, J., Sobral, D., Darvish, B., et al. 2017, MNRAS, 472, 772 [Google Scholar]
- Mawatari, K., Costantin, L., Usui, M., et al. 2026, ApJ, 998, 119 [Google Scholar]
- Mazzolari, G., Übler, H., Maiolino, R., et al. 2024, A&A, 691, A345 [NASA ADS] [CrossRef] [EDP Sciences] [Google Scholar]
- Menon, S. H., Federrath, C., & Krumholz, M. R. 2023, MNRAS, 521, 5160 [NASA ADS] [CrossRef] [Google Scholar]
- Menon, S. H., Burkhart, B., Somerville, R. S., Thompson, T. A., & Sternberg, A. 2025, ApJ, 987, 12 [Google Scholar]
- Mignoli, M., Feltre, A., Bongiorno, A., et al. 2019, A&A, 626, A9 [NASA ADS] [CrossRef] [EDP Sciences] [Google Scholar]
- Mitsuhashi, I., Harikane, Y., Bauer, F. E., et al. 2024, ApJ, 971, 161 [NASA ADS] [CrossRef] [Google Scholar]
- Morishita, T., Trenti, M., Stiavelli, M., et al. 2018, ApJ, 867, 150 [NASA ADS] [CrossRef] [Google Scholar]
- Naidu, R. P., Tacchella, S., Mason, C. A., et al. 2020, ApJ, 892, 109 [NASA ADS] [CrossRef] [Google Scholar]
- Naidu, R. P., Oesch, P. A., Brammer, G., et al. 2026, Open J. Astrophys., 9, 56033 [Google Scholar]
- Nakazato, Y., & Ferrara, A. 2025, MNRAS, 544, 4390 [Google Scholar]
- Oesch, P. A., Brammer, G., van Dokkum, P. G., et al. 2016, ApJ, 819, 129 [NASA ADS] [CrossRef] [Google Scholar]
- Onoue, M., Matsuoka, Y., Kashikawa, N., et al. 2021, ApJ, 919, 61 [Google Scholar]
- Östlin, G., Pérez-González, P. G., Melinder, J., et al. 2025, A&A, 696, A57 [NASA ADS] [CrossRef] [EDP Sciences] [Google Scholar]
- Ouchi, M., Ono, Y., Egami, E., et al. 2009, ApJ, 696, 1164 [NASA ADS] [CrossRef] [Google Scholar]
- Pahl, A., Topping, M. W., Shapley, A., et al. 2025, ApJ, 981, 134 [Google Scholar]
- Parlanti, E., Carniani, S., Venturi, G., et al. 2025, A&A, 695, A6 [NASA ADS] [CrossRef] [EDP Sciences] [Google Scholar]
- Pasha, I., & Miller, T. B. 2023, J. Open Source Softw., 8, 5703 [NASA ADS] [CrossRef] [Google Scholar]
- Pérez-González, P. G., Costantin, L., Langeroodi, D., et al. 2023, ApJ, 951, L1 [CrossRef] [Google Scholar]
- Pérez-González, P. G., Östlin, G., Costantin, L., et al. 2025, ApJ, 991, 179 [Google Scholar]
- Perna, M., Arribas, S., Marshall, M., et al. 2023, A&A, 679, A89 [NASA ADS] [CrossRef] [EDP Sciences] [Google Scholar]
- Phillips, C. L., Strauss, M. A., Onoue, M., et al. 2026, ApJ, 1003, 47 [Google Scholar]
- Reddy, N. A., Oesch, P. A., Bouwens, R. J., et al. 2018, ApJ, 853, 56 [NASA ADS] [CrossRef] [Google Scholar]
- Renzini, A. 2025, MNRAS, 536, L8 [Google Scholar]
- Rigby, J., Perrin, M., McElwain, M., et al. 2023, PASP, 135, 048001 [NASA ADS] [CrossRef] [Google Scholar]
- Rizzuti, F., Matteucci, F., Molaro, P., Cescutti, G., & Maiolino, R. 2025, A&A, 697, A96 [NASA ADS] [CrossRef] [EDP Sciences] [Google Scholar]
- Roberts-Borsani, G., Bagley, M., Rojas-Ruiz, S., et al. 2025, ApJ, 983, 18 [Google Scholar]
- Roberts-Borsani, G., Oesch, P. A., Ellis, R., et al. 2026, MNRAS, 548, stag701 [Google Scholar]
- Robertson, B. E., Ellis, R. S., Furlanetto, S. R., & Dunlop, J. S. 2015, ApJ, 802, L19 [Google Scholar]
- Rodríguez Del Pino, B., Perna, M., Arribas, S., et al. 2024, A&A, 684, A187 [NASA ADS] [CrossRef] [EDP Sciences] [Google Scholar]
- Rojas-Ruiz, S., Roberts-Borsani, G., Morishita, T., et al. 2026, ApJ, 1000, 285 [Google Scholar]
- Roman-Duval, J., Proffitt, C. R., Taylor, J. M., et al. 2020, Res. Notes Am. Astron. Soc., 4, 205 [Google Scholar]
- Rowland, L. E., Stefanon, M., Bouwens, R., et al. 2026, MNRAS, 546, staf2023 [Google Scholar]
- Schaerer, D., Marques-Chaves, R., Xiao, M., & Korber, D. 2024, A&A, 687, L11 [NASA ADS] [CrossRef] [EDP Sciences] [Google Scholar]
- Schaerer, D., Guibert, J., Marques-Chaves, R., & Martins, F. 2025, A&A, 693, A271 [NASA ADS] [CrossRef] [EDP Sciences] [Google Scholar]
- Schouws, S., Bouwens, R. J., Ormerod, K., et al. 2025, ApJ, 988, 19 [Google Scholar]
- Senchyna, P., Plat, A., Stark, D. P., et al. 2024, ApJ, 966, 92 [NASA ADS] [CrossRef] [Google Scholar]
- Shapley, A. E., Steidel, C. C., Pettini, M., & Adelberger, K. L. 2003, ApJ, 588, 65 [Google Scholar]
- Shibuya, T., Ouchi, M., Harikane, Y., et al. 2018, PASJ, 70, S15 [Google Scholar]
- Shirazi, M., & Brinchmann, J. 2012, MNRAS, 421, 1043 [NASA ADS] [CrossRef] [Google Scholar]
- Simmonds, C., Tacchella, S., Hainline, K., et al. 2024a, MNRAS, 527, 6139 [Google Scholar]
- Simmonds, C., Tacchella, S., Hainline, K., et al. 2024b, MNRAS, 535, 2998 [NASA ADS] [CrossRef] [Google Scholar]
- Smartt, S. J. 2015, PASA, 32, e016 [NASA ADS] [CrossRef] [Google Scholar]
- Smith, L. J., Oey, M. S., Hernandez, S., et al. 2023, ApJ, 958, 194 [NASA ADS] [CrossRef] [Google Scholar]
- Sobral, D., Matthee, J., Darvish, B., et al. 2015, ApJ, 808, 139 [Google Scholar]
- Somerville, R. S., Yung, L. Y. A., Lancaster, L., et al. 2025, MNRAS, 544, 3774 [Google Scholar]
- Sommovigo, L., Ferrara, A., Pallottini, A., et al. 2022, MNRAS, 513, 3122 [NASA ADS] [CrossRef] [Google Scholar]
- Stefanon, M., Labbé, I., Bouwens, R. J., et al. 2019, ApJ, 883, 99 [NASA ADS] [CrossRef] [Google Scholar]
- Steidel, C. C., Rudie, G. C., Strom, A. L., et al. 2014, ApJ, 795, 165 [Google Scholar]
- Stiavelli, M., Morishita, T., Chiaberge, M., et al. 2025, ApJ, 981, 136 [Google Scholar]
- Sugahara, Y., Ouchi, M., Harikane, Y., et al. 2019, ApJ, 886, 29 [Google Scholar]
- Sugahara, Y., Álvarez-Márquez, J., Hashimoto, T., et al. 2025, ApJ, 981, 135 [Google Scholar]
- Sukhbold, T., Ertl, T., Woosley, S. E., Brown, J. M., & Janka, H. T. 2016, ApJ, 821, 38 [NASA ADS] [CrossRef] [Google Scholar]
- Topping, M. W., Stark, D. P., Endsley, R., et al. 2022, MNRAS, 516, 975 [NASA ADS] [CrossRef] [Google Scholar]
- Topping, M. W., Stark, D. P., Senchyna, P., et al. 2024, MNRAS, 529, 3301 [NASA ADS] [CrossRef] [Google Scholar]
- Torralba-Torregrosa, A., Matthee, J., Naidu, R. P., et al. 2024, A&A, 689, A44 [NASA ADS] [CrossRef] [EDP Sciences] [Google Scholar]
- Trenti, M., Bradley, L. D., Stiavelli, M., et al. 2011, ApJ, 727, L39 [NASA ADS] [CrossRef] [Google Scholar]
- Trinca, A., Schneider, R., Valiante, R., et al. 2024, MNRAS, 529, 3563 [NASA ADS] [CrossRef] [Google Scholar]
- Übler, H., Maiolino, R., Curtis-Lake, E., et al. 2023, A&A, 677, A145 [NASA ADS] [CrossRef] [EDP Sciences] [Google Scholar]
- Upadhyaya, A., Marques-Chaves, R., Schaerer, D., et al. 2024, A&A, 686, A185 [NASA ADS] [CrossRef] [EDP Sciences] [Google Scholar]
- Usui, M., Mawatari, K., Álvarez-Márquez, J., et al. 2025, ApJ, 991, L38 [Google Scholar]
- Veilleux, S., & Osterbrock, D. E. 1987, ApJS, 63, 295 [Google Scholar]
- Verhamme, A., Garel, T., Ventou, E., et al. 2018, MNRAS, 478, L60 [Google Scholar]
- Vila-Costas, M. B., & Edmunds, M. G. 1993, MNRAS, 265, 199 [NASA ADS] [CrossRef] [Google Scholar]
- Weaver, J. R., Taamoli, S., McPartland, C. J. R., et al. 2025, A&A, 697, A16 [NASA ADS] [CrossRef] [EDP Sciences] [Google Scholar]
- Zackrisson, E., Inoue, A. K., & Jensen, H. 2013, ApJ, 777, 39 [NASA ADS] [CrossRef] [Google Scholar]
- Zavala, J. A., Castellano, M., Akins, H. B., et al. 2025, Nat. Astron., 9, 155 [Google Scholar]
- Zhang, Y., Morishita, T., & Stiavelli, M. 2026, ApJ, 998, 141 [Google Scholar]
- Ziparo, F., Ferrara, A., Sommovigo, L., & Kohandel, M. 2023, MNRAS, 520, 2445 [NASA ADS] [CrossRef] [Google Scholar]
Recently, Harikane et al. (2025) found evidence of an inhomogeneous ISM structure in J0217−0208 from a relatively strong far-IR [O III] 88 μm emission that cannot be explained by uniform electron density and temperature. However, their results should not significantly impact our measurements of densities, temperatures, and abundances.
Appendix A: SHELLQs-LAEs sample
Summary of SHELLQs-LAEs.
Appendix B: Emission line measurements
Emission line measurements of J0217−0208.
All Tables
All Figures
|
Fig. 1. Distribution of Lyα luminosity (LLyα), UV absolute magnitude (MUV), and redshift (z) for the SHELLQs-LAEs analyzed in this work (blue circles). Left panel: plane of LLyα–MUV comparing SHELLQs LAEs with other galaxy populations with spectroscopic redshifts, namely, SHELLQs-QSOs at z ∼ 6 (red crosses; Matsuoka et al. 2016, 2018a,b; 2019, 2022, 2025a), bright LAEs at z ∼ 6 (green squares; Ouchi et al. 2009; Sobral et al. 2015; Matthee et al. 2017; Shibuya et al. 2018; Marconcini et al. 2025), UV-bright star-forming galaxies at z ∼ 3 from SDSS/BOSS (violet diamonds; Marques-Chaves et al. 2020a,b, 2021, 2022; Dessauges-Zavadsky et al. 2025), and more typical LAEs at z ∼ 3–6 (gray squares; Kerutt et al. 2022). Right panel: MUV–z distribution of the SHELLQs LAEs together with UV-bright galaxies from SHELLQs lacking or showing weak Lyα emission (light blue circles; Matsuoka et al. 2016, 2018a,b, 2019, 2022), sources from the REBELS (green; Bouwens et al. 2022) and BoRG (red; Roberts-Borsani et al. 2025) surveys, and a compilation of spectroscopically confirmed zspec > 5 objects from the DAWN/DJA archive (gray). |
| In the text | |
|
Fig. 2. Stacked rest-UV spectrum of UV-bright SHELLQs-LAEs. Panel A: median (black) stacked spectrum and 1σ error (green) of SHELLQs-LAEs, which presents strong Lyα emission and a well-developed N Vλ1240 P-Cygni profile (violet-shaded area). The location of low-ionization ISM absorption lines (Si II, O I, and C II) are also marked with dashed orange lines. The BPASS stellar population synthesis model that best reproduces the observed N V profile is shown in violet and is characterized by continuous star formation and an age of |
| In the text | |
|
Fig. 3. Summary of the JWST observations of J0217−0208 at z = 6.20. Top panels: JWST/NIRCam images centered on J0217−0208 at increasing wavelengths (from F115W to F444W, left to right, each with a 2″ × 2″ size). Bottom panels: JWST/NIRSpec spectroscopy. Bottom left: integrated Hβ + [O III] λλ4960,5008 emission from J0217−0208 obtained with NIRSpec/IFS. Bottom right: two-dimensional (top) and one-dimensional (bottom) spectra of J0217−0208 obtained with NIRSpec/Fixed-slit. The locations of relevant emission lines are marked with dashed lines. |
| In the text | |
|
Fig. 4. NIRSpec/FS spectrum of J0217−0208 (black) around Hβ + [O III] λλ4960,5008 (left) and Hα + [N II] λλ6549,6585 (right) emission lines. Top panels: best-fit model assuming one Gaussian component for each emission line (orange). Bottom panel: best-fit model assuming two Gaussian components. The total emission is shown as a blue dashed line, while the individual components are shown as dotted lines (green and red for the narrow and broad components). Note that the vertical axes are in logarithmic scales. The gray area represents the ±1σ uncertainty spectrum. The lower subpanels show the residuals of the fits, with yellow and blue points corresponding to the single- and two-component models, respectively. |
| In the text | |
|
Fig. 5. Location of J0217−0208 (blue) on the classic BPT diagnostic diagrams: [O III]/Hβ vs. [N II]/Hα (top), [S II]/Hα (middle) and [O I]/Hα (bottom). The dot-dashed curve in the top panel shows the empirical star-forming/AGN demarcation from Kauffmann et al. (2003), while the dashed curves indicate the maximum starburst lines from Kewley et al. (2001, top) and Kewley et al. (2006, middle and bottom). Gray circles represent local SDSS galaxies for comparison. |
| In the text | |
|
Fig. 6. Chemical abundance ratio N/O as a function of O/H. J0217−0208 is shown as a blue circle, while other z ≳ 5 nitrogen emitters are marked by violet squares (compiled by Schaerer et al. 2024; see also Ji et al. 2026 for a more extensive sample). For comparison, low-redshift star-forming galaxies and H II regions from Izotov et al. (2023) are plotted in gray. The dashed line shows the average trend in low-z galaxies, as parameterized by Vila-Costas & Edmunds (1993). |
| In the text | |
|
Fig. 7. Best-fit SED model (black line) of J0217−0208 using NIRCam photometry (blue squares). The SED is dominated by the emission of a young stellar population characterized by an exponentially declining SFH with an age of 5.5 ± 1.5 Myr (τ = 12.6 ± 6.7 Myr), SFR = 142 ± 24 M⊙ yr−1, and a stellar mass |
| In the text | |
|
Fig. 8. Ionizing photon production efficiency ( |
| In the text | |
|
Fig. 9. Collapsed Hβ and [O III] λλ4960,5008 map of J0217−0208 from NIRSpec/IFU (5σ, dashed blue contour). The dust continuum emission from ALMA Band 7 is overlaid in red contours (2σ, 3σ, 5σ). The ALMA beam and the NIRSpec/IFU PSF are shown in the lower-left corner. |
| In the text | |
|
Fig. 10. Ultraviolet slope (βUV) as a function of MUV for SHELLQs-LAEs at z ∼ 6 (circles; this work and Matsuoka et al. 2025b), BORG galaxies at z ∼ 8 (pentagons; Roberts-Borsani et al. 2025), REBELS sources at z ∼ 6.5 − 8.5 (squares; Bouwens et al. 2022; Fisher et al. 2025), UV-bright systems from SDSS/BOSS at z ∼ 2 − 4 (diamonds; Dessauges-Zavadsky et al. 2025), and z ≥ 10 sources confirmed with JWST. Sources with detected dust emission are shown with solid symbols, while sources without dust detection or with no dust observations are shown with empty symbols. The dashed line represents the βUV − MUV relationship of Cullen et al. (2023) derived from fainter sources. |
| In the text | |
Current usage metrics show cumulative count of Article Views (full-text article views including HTML views, PDF and ePub downloads, according to the available data) and Abstracts Views on Vision4Press platform.
Data correspond to usage on the plateform after 2015. The current usage metrics is available 48-96 hours after online publication and is updated daily on week days.
Initial download of the metrics may take a while.