


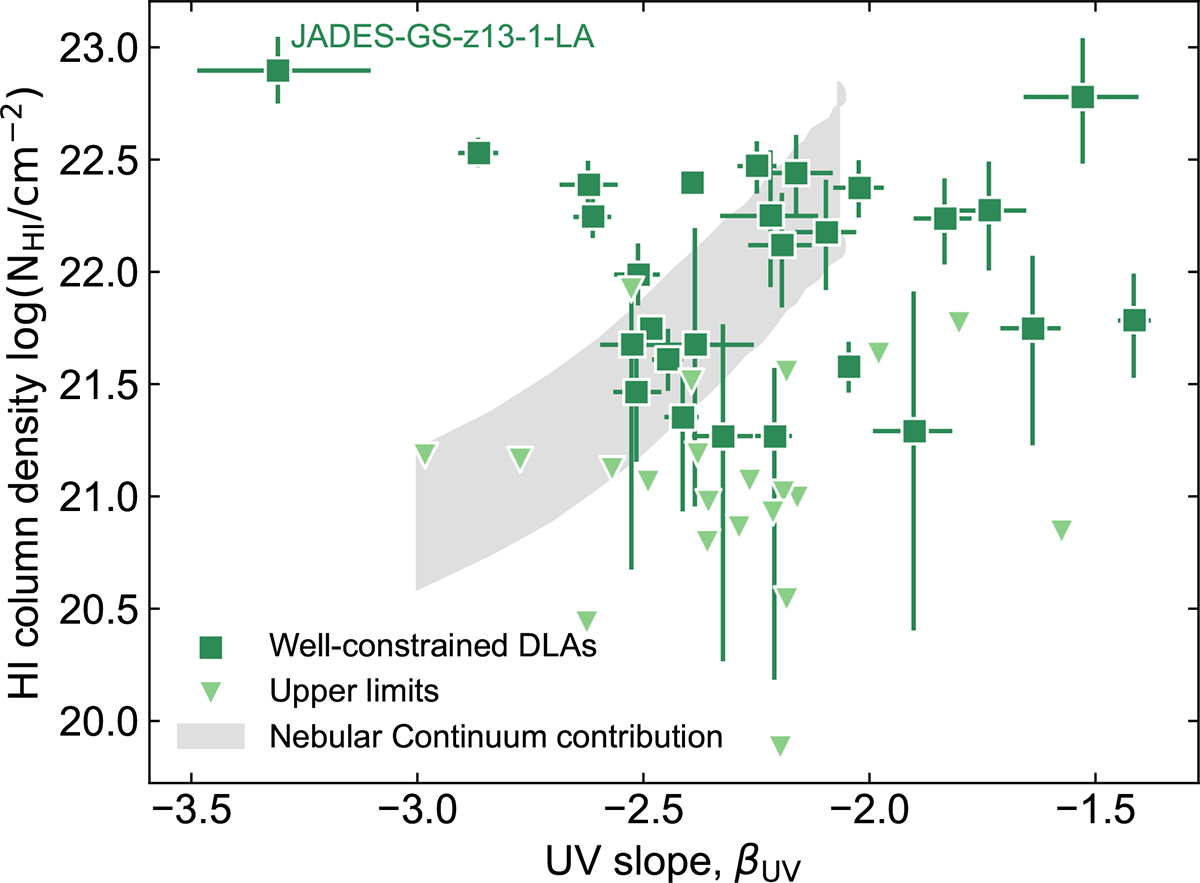
Fig. 3.
Download original image
Measured βUV slope and column density log(NHI/cm−2) for the galaxy sample. The green squares and triangles again represent the well-constrained and upper limits for column density respectively, with the grey shaded region representing possible high nebular continuum where two-photon emission may be masquerading as a DLA (Katz et al. 2025).
Current usage metrics show cumulative count of Article Views (full-text article views including HTML views, PDF and ePub downloads, according to the available data) and Abstracts Views on Vision4Press platform.
Data correspond to usage on the plateform after 2015. The current usage metrics is available 48-96 hours after online publication and is updated daily on week days.
Initial download of the metrics may take a while.