| Issue |
A&A
Volume 709, May 2026
|
|
|---|---|---|
| Article Number | A223 | |
| Number of page(s) | 26 | |
| Section | Planets, planetary systems, and small bodies | |
| DOI | https://doi.org/10.1051/0004-6361/202558126 | |
| Published online | 19 May 2026 | |
A chemical perspective on planet formation in reduced systems
1
Institute of Geochemistry and Petrology, ETH
Zurich,
Switzerland
2
Centre for Star and Planet Formation, Globe Institute, University of Copenhagen,
Copenhagen,
Denmark
★ Corresponding authors: This email address is being protected from spambots. You need JavaScript enabled to view it.
; This email address is being protected from spambots. You need JavaScript enabled to view it.
; This email address is being protected from spambots. You need JavaScript enabled to view it.
Received:
14
November
2025
Accepted:
17
March
2026
Abstract
Context. The relative abundances of refractory elements in planets are widely assumed to reflect those of their host stars. However, because elements are classified according to their behaviour in the solar nebula, this implicitly assumes that condensation is independent of nebular chemistry, despite contradictory evidence in chemically reduced systems with high molar carbon-to-oxygen (C/O) ratios.
Aims. We investigated how variations in stellar C/O ratio and disk pressure modify condensation chemistry, and assessed the reliability of mapping stellar compositions to planetary building blocks in reduced environments.
Methods. For a sample of FGK stars with C/O ratios spanning 0.65–0.95 (solar = 0.59±0.08), we computed the equilibrium phase stability using FactSage over 1900–400 K at total pressures of 10−2, 10−4, and 10−6 bar. We tracked the phase evolution and key chemical transitions across C/O, temperature, and pressure. Bulk planet(esimal) compositions were derived using a stochastic accretion framework that aggregates condensates from temperature-dependent feeding zones.
Results. We identified three distinct condensation regimes: (i) solar-like (C/O ≲ 0.7), (ii) transitional (C/O ~ 0.7–0.91), and (iii) reduced (C/O ≳ 0.92). Relative to solar-like sequences, oxygen-bearing silicates condense at lower temperatures in transitional and reduced regimes, while carbides, silicides, and sulfides appear. Bulk planetesimal Fe/Mg, Fe/Si, and Fe/O ratios deviate substantially from their host stellar values in transitional and reduced sequences, thus producing more diverse rocky building blocks within the same disk, ranging from metal-rich C- and S-bearing bodies to more Earth-like compositions.
Conclusions. Condensation sequences are not universal across stellar compositions. In reduced disks, elemental ratios commonly treated as refractory based on the solar system condensation temperatures may not reliably trace planetary bulk composition. The distinct building blocks produced in high C/O systems thus provide potential formation pathways for metal-enriched super-Mercury analogues and distinct C- and S-rich rocky planets, expanding the diversity of terrestrial compositions beyond solar system analogues.
Key words: planets and satellites: composition / planets and satellites: formation / planets and satellites: interiors / planets and satellites: terrestrial planets / planet-disk interactions / planet-star interactions
© The Authors 2026
 Open Access article, published by EDP Sciences, under the terms of the Creative Commons Attribution License (https://creativecommons.org/licenses/by/4.0), which permits unrestricted use, distribution, and reproduction in any medium, provided the original work is properly cited.
This article is published in open access under the Subscribe to Open model. This email address is being protected from spambots. You need JavaScript enabled to view it. to support open access publication.
1 Introduction
Over the past decade, the focus of exoplanetary science has evolved from merely detecting and classifying exoplanets to a detailed characterisation of their physical and chemical properties. Approximately 20% of the known exoplanets have both radial velocity and transit measurements available (Hinkel et al. 2024; Christiansen et al. 2025), thus enabling the derivation of both planetary radii and (minimum) masses. These parameters allow the estimation of bulk densities and offer first-order insights into internal compositions. Mass–radius relationships for rocky planets assuming a tripartite model, i.e., comprising an iron core, silicate mantle, and a volatile envelope (liquid H2O + H-He gas), are commonly used to model interior structure (Seager et al. 2007; Dorn et al. 2015; Zeng et al. 2016).
However, the modelling of the internal structures and compositions of rocky exoplanets is known to be degenerate with mass-radius measurements alone (Nellis 2002; Stevenson 2002; Khan & Connolly 2008; Dorn et al. 2015). A widely adopted approach to reduce degeneracy in inferring rocky exoplanet compositions is to assume that some key elemental ratios (e.g., Mg/Si and Fe/Mg) in the host star are identical to those of the planet, given that stars and planets form from the same molecular cloud (Dorn et al. 2015; Hinkel & Unterborn 2018; Wang et al. 2019b). This approach has its foundations in the observation that the refractory lithophile elements have abundances in the Earth’s mantle that are in CI-chondritic (quasi-solar) relative proportions (Ringwood 1966). However, extending this practice to elements with higher volatilities is fraught with problems since moderately volatile elemental abundances in the mantles of terrestrial planets are correlated with their 50% nebular condensation temperatures (![Mathematical equation: $\[T_{c}^{50 \%}\]$](/articles/aa/full_html/2026/05/aa58126-25/aa58126-25-eq1.png) ), defined as the temperature at which half of the mass fraction of a given element condenses from the gas phase (O’Neill & Palme 1998; Lodders 2003). These empirical observations imply that, relative to solar (CI-chondritic) composition, moderately volatile elements become increasingly impoverished in Earth’s mantle with increasing volatility (Palme & O’Neill 2014; Wang et al. 2018, 2019a; Braukmüller et al. 2019; Sossi et al. 2022).
), defined as the temperature at which half of the mass fraction of a given element condenses from the gas phase (O’Neill & Palme 1998; Lodders 2003). These empirical observations imply that, relative to solar (CI-chondritic) composition, moderately volatile elements become increasingly impoverished in Earth’s mantle with increasing volatility (Palme & O’Neill 2014; Wang et al. 2018, 2019a; Braukmüller et al. 2019; Sossi et al. 2022).
Such volatility trends are representative of some chondritic meteorites (Braukmüller et al. 2018; Alexander 2019) and rocky bodies such as the Moon (Charnoz et al. 2021) and Mars (Yoshizaki & McDonough 2020; Khan et al. 2022), and are inferred for other planetary systems based on abundances in polluted white dwarf atmospheres (Harrison et al. 2018), thus supporting the notion that devolatilisation is a common feature of rocky planet formation (Wang et al. 2019a; Calogero et al. 2025). As a result, a convenient assumption states that refractory elements (![Mathematical equation: $\[T_{c}^{50 \%}\]$](/articles/aa/full_html/2026/05/aa58126-25/aa58126-25-eq2.png) > 1400 K; Al, Ca, Ti) and major elements (1300 <
> 1400 K; Al, Ca, Ti) and major elements (1300 < ![Mathematical equation: $\[T_{c}^{50 \%}\]$](/articles/aa/full_html/2026/05/aa58126-25/aa58126-25-eq3.png) < 1400 K; Mg, Si, and Fe) are incorporated into planetary compositions in roughly stellar proportions, while the abundances of moderately volatile elements are expected to vary more substantially (Kargel & Lewis 1993; McDonough & Sun 1995; Palme et al. 2014; Wang et al. 2018, 2019a). Spaargaren et al. (2023) and Guimond et al. (2024) explored the chemical diversity of planetary compositions as a function of host star abundances using Sun-Earth devolatilisation factors and showed that the Sun and Earth are close to the medians of bulk compositions of Sun-like (FGK main sequence) stars and postulated terrestrial-type exoplanets around them.
< 1400 K; Mg, Si, and Fe) are incorporated into planetary compositions in roughly stellar proportions, while the abundances of moderately volatile elements are expected to vary more substantially (Kargel & Lewis 1993; McDonough & Sun 1995; Palme et al. 2014; Wang et al. 2018, 2019a). Spaargaren et al. (2023) and Guimond et al. (2024) explored the chemical diversity of planetary compositions as a function of host star abundances using Sun-Earth devolatilisation factors and showed that the Sun and Earth are close to the medians of bulk compositions of Sun-like (FGK main sequence) stars and postulated terrestrial-type exoplanets around them.
However, in stellar systems with abundances that differ markedly from solar values, condensation sequences are not mandated to follow solar patterns. Timmermann et al. (2023) systematically varied elemental abundances of Sun-like stars and, by performing equilibrium condensation calculations, showed that, at a given total pressure, the metallicity, Z (defined as all elements heavier than H and He), and the molar C/O ratio of the gas have the highest influence on ![Mathematical equation: $\[T_{c}^{50 \%}\]$](/articles/aa/full_html/2026/05/aa58126-25/aa58126-25-eq4.png) , and hence on the plausible compositions of the resulting planets. Both quantities vary significantly among Sun-like stars: The metallicity, [Fe/H] (used as a proxy for Z), spans roughly between −1 and 1 dex (Buder et al. 2019; Hinkel et al. 2014), and relative variations in elemental abundances, particularly C and O, produce stellar C/O ratios typically between 0.1 and 1 in the solar neighbourhood (Pignatari et al. 2023; Brewer & Fischer 2016).
, and hence on the plausible compositions of the resulting planets. Both quantities vary significantly among Sun-like stars: The metallicity, [Fe/H] (used as a proxy for Z), spans roughly between −1 and 1 dex (Buder et al. 2019; Hinkel et al. 2014), and relative variations in elemental abundances, particularly C and O, produce stellar C/O ratios typically between 0.1 and 1 in the solar neighbourhood (Pignatari et al. 2023; Brewer & Fischer 2016).
Previous studies have shown that in protoplanetary disks, carbon monoxide (CO(g)) is predicted to be the most thermodynamically stable oxygen-bearing gas molecule (Larimer 1975; Larimer & Bartholomay 1979). The solar C/O ratio of ~0.59 ± 0.08 (Lodders 2003; Asplund et al. 2021; Lodders 2021) results in small quantities of CO(g), and the excess O forms H2O(g) via
![Mathematical equation: $\[\mathrm{H}_{2(\mathrm{g})}+\frac{1}{2} \mathrm{O}_{2(\mathrm{g})}=\mathrm{H}_2 \mathrm{O}_{(\mathrm{g})}.\]$](/articles/aa/full_html/2026/05/aa58126-25/aa58126-25-eq5.png) (1)
(1)
The resulting fO2 is sufficient to allow the condensation of Al-, Ca-, Ti-, and Mg-bearing oxides and silicates, such as corundum, perovskite, and forsterite.
On the other hand, as C/O increases, oxygen becomes progressively tied up in CO(g). With C/O approaching 0.8, the fugacities of other oxygen-bearing gas species (e.g., SiO(g) and H2O(g)) decline accordingly. When the partial pressure of CO(g), p(CO), exceeds that required for graphite activity to reach unity, C-bearing species condense (Larimer 1975; Adams & Lodders 2025). Such sequences lead to lower fO2 than in Sun-like sequences and suppress the formation of oxide or silicate condensates in favour of reduced phases such as other sulfides, nitrides, and silicides. Consequently, the condensation sequence, and hence the bulk composition of the ensemble of condensed phases at any given P − T, diverges markedly from those produced from a solar composition (Timmermann et al. 2023; Spaargaren et al. 2025).
Determining how these compositionally distinct condensates affect bulk planet(esimal) compositions was undertaken by Bond et al. (2010), who combined equilibrium condensation calculations with N-body simulations, linking specific pressure-temperature (P–T) conditions in disks to planetesimal composition. Their simulations show that disks with C/O > 0.8 yield carbon-rich solids, such as graphite, silicon carbide (SiC), and titanium carbide (TiC), dominating in the inner regions. In extreme cases (C/O ~ 1–2), planet(esimal)s may contain up to 75 wt% carbon (Bond et al. 2010). In a similar vein, Moriarty et al. (2014) introduced a sequential condensation model in which the composition of the residual bulk gas used in the subsequent (i.e., down-temperature) P − T step changes upon cooling via the step-wise removal of condensed solids from the system. This model predicts that carbon-rich planet(esimal)s can form even in initially oxygen-rich environments starting from C/O ~ 0.65.
Building upon this framework, Shakespeare et al. (2025) implemented a dynamic, viscously evolving protoplanetary disk model coupled with sequential condensation. Holding all elemental abundances constant except for C and O, they identify three regimes of disk chemistry: silicate-dominated (C/O ≲ 0.6), transitional (C/O ~ 0.6–0.9), and carbide-dominated (C/O ≳ 0.9) based on the type and amount of condensates present. Their results show that small changes in C/O within the transitional regime lead to non-linear shifts in condensate identity, with reduced phases such as graphite and SiC becoming dominant.
Furthermore, Spaargaren et al. (2025) sampled about 1000 FGK dwarf stars and parametrised ![Mathematical equation: $\[T_{c}^{50 \%}\]$](/articles/aa/full_html/2026/05/aa58126-25/aa58126-25-eq6.png) across a wide range of initial disk compositions, enabling disk-dependent devolatilisation trends to be incorporated when estimating the bulk composition of rocky exoplanets. They find that Earth-like planets are expected to form in disks with C/O ≤ 0.75, whereas more reduced planets emerge at C/O > 0.75.
across a wide range of initial disk compositions, enabling disk-dependent devolatilisation trends to be incorporated when estimating the bulk composition of rocky exoplanets. They find that Earth-like planets are expected to form in disks with C/O ≤ 0.75, whereas more reduced planets emerge at C/O > 0.75.
Although existing models broadly reproduce consistent, increasingly carbide-, nitride-, and silicide-rich condensation sequences to higher C/O ratios, they do not focus on the underlying chemical pathways that control condensate stability in protoplanetary disks. Moreover, Spaargaren et al. (2025) highlighted the infeasibility of determining a ![Mathematical equation: $\[T_{c}^{50 \%}\]$](/articles/aa/full_html/2026/05/aa58126-25/aa58126-25-eq7.png) for O (and other similarly behaving elements) that condense partially over a wide range of temperatures, thereby undermining the use of
for O (and other similarly behaving elements) that condense partially over a wide range of temperatures, thereby undermining the use of ![Mathematical equation: $\[T_{c}^{50 \%}\]$](/articles/aa/full_html/2026/05/aa58126-25/aa58126-25-eq8.png) as a robust proxy for predicting the compositions of rocky planets (see also Lodders et al. 2025 and Sossi et al. 2025). Consequently, a more fundamental approach to understanding the thermodynamic stability of these reactions is essential both for linking element availability to disk gradients and compositions, and for developing future models that incorporate non-equilibrium processes such as kinetic activation energies for gas-solid reactions. Moreover, most models neglect solid solutions and exotic condensates, including iron silicides and sinoite, which are absent under solar-like compositions but become critically important in reduced environments. Addressing these gaps requires a systematic investigation of high C/O systems within a framework that also enables direct tracking of how these variations map onto the bulk compositions of accreting planet(esimal)s, which cannot be inferred from condensation temperatures alone.
as a robust proxy for predicting the compositions of rocky planets (see also Lodders et al. 2025 and Sossi et al. 2025). Consequently, a more fundamental approach to understanding the thermodynamic stability of these reactions is essential both for linking element availability to disk gradients and compositions, and for developing future models that incorporate non-equilibrium processes such as kinetic activation energies for gas-solid reactions. Moreover, most models neglect solid solutions and exotic condensates, including iron silicides and sinoite, which are absent under solar-like compositions but become critically important in reduced environments. Addressing these gaps requires a systematic investigation of high C/O systems within a framework that also enables direct tracking of how these variations map onto the bulk compositions of accreting planet(esimal)s, which cannot be inferred from condensation temperatures alone.
For this study, we aimed to:
identify the temperature- and pressure-dependent condensation reactions as a function of the C/O ratio;
examine how the star–planet chemical link varies over the same range of C/O ratios;
quantify the impact of these condensates on the bulk composition and redox state of rocky planetary building blocks formed in chemically reduced environments.
2 Data and methodology
2.1 Stellar chemistry
We used a set of measured stellar abundances with varied C/O values as proxies for initial disk compositions. This approach preserves nucleosynthetic correlations between elements, in contrast to arbitrarily modifying solar values. The stellar abundance data of Sun-like stars (FGK dwarfs) measured on the HARPS GTO spectrograph and compiled from Adibekyan et al. (2012) and subsequent works (Delgado Mena et al. 2017; Costa Silva et al. 2020; Delgado Mena et al. 2021), are collectively referred to as the Portuguese Group Dataset (PGD) here. The authors derived the abundances in this dataset using a local thermodynamic equilibrium analysis, adopting the Sun as the reference and employing the spectral synthesis code MOOG together with a grid of Kurucz ATLAS9 model atmospheres (Adibekyan et al. 2012). For further details, see the references cited above. The selection of this dataset is further rationalised in Appendix A.
We then excluded stars with log g ≤ 3.5 to avoid giant stars and filter out stars with effective temperatures Teff < 5000 K due to systematic trends in certain elements (S, Si, Na, and Al) at lower temperatures (see Adibekyan et al. (2012) and Appendix A). We further excluded stars without abundance measurements for any of the elements within the Ni-Fe-Cr-Ti-Ca-S-Si-Al-Mg-Na-O-C system, totalling a sample of 532 stars.
From this subset, we included all available stars with C/O > 0.8 since this is the threshold recognised as marking a major shift in disk chemistry (Larimer 1975; Bond et al. 2010; Shakespeare et al. 2025). In addition to these, we also sampled several stellar compositions in the range of C/O= 0.65–0.8 at varying metallicity to explore the behaviour of disks approaching the reduced regime. The full dataset and the selected samples used in this study are shown in Figure 1.
The PGD lacks nitrogen abundances. Nitrogen is important for such modelling because, although it does not condense below 400 K in solar-like disks, it is expected to condense into nitrides in high C/O systems. We therefore estimated N by scaling it relative to O, based on the argument made by Nicholls et al. (2017), who showed that N does not scale linearly with metallicity due to its mixed origins from primary core-collapse and secondary dredge-up processes in stars. We used two independent datasets containing nitrogen and oxygen abundances (Magrini et al. (2018) and Da Silva et al. (2024)) to derive second-order polynomial relationships between absolute abundances A(O) and A(N) using orthogonal distance regression (ODR), where absolute abundances are defined on the standard astronomical logarithmic scale, A(X) = log10(NX/NH) + 12. Applying the polynomial fit to the selected dataset for this study, the two fits differ by a mean offset (bias) of +0.03 dex and a root-mean-square error of 0.18 dex. We used the fit obtained from Magrini et al. (2018) dataset, as shown in Equation (2), to estimate absolute nitrogen abundances because it reproduces the solar nitrogen abundances from Lodders (2003) with better consistency than the other dataset:
![Mathematical equation: $\[A(N)=-1.6665 \cdot A(O)^2+31.2043 \cdot A(O)-137.4157.\]$](/articles/aa/full_html/2026/05/aa58126-25/aa58126-25-eq9.png) (2)
(2)
We converted the resulting nitrogen abundances to elemental number fractions (mol %) and incorporated them into the dataset along with the remaining elements. The final composition of the stars considered in this study is provided in Table A.1.
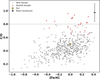 |
Fig. 1 Distribution of our adopted dataset of elemental abundances of Sun-like stars (FGK dwarfs) on the [Fe/H]-C/O diagram. A sample of stars selected for this study is highlighted in red. The solar reference (Lodders 2003) is indicated by a star marker. The typical error bars for the dataset in the [Fe/H] - C/O plane are shown in the upper right corner. |
2.2 Gibbs free energy minimisation
To calculate the stability and abundances of gas species and condensed phases (liquid, solid) in thermodynamic equilibrium, we used the Equilib module of FactSage 8.2 (Bale et al. 2016). We performed the calculations for a given composition at a constant total pressure over the temperature range 1900–400 K. To accurately capture condensation and gas-mineral reactions, we used a small temperature step of 5 K. We determined the equilibrium phase assemblage for each temperature step by Gibbs energy minimisation. We incorporated often-neglected solid species such as Fe3C, FexSi (x = 1, 3), Al4C3, and Si2N2O, which do not condense in the solar nebula but may condense in reduced systems. In total, the calculations involved a selection of 199 gases, 50 solids, and 38 solid solutions, as provided in Appendix B.
2.3 Synthetic planet(esimal) model
Sossi et al. (2022) demonstrate that, for Earth and Vesta, the abundance of an element i correlates with its ![Mathematical equation: $\[T_{c}^{50 \%}\]$](/articles/aa/full_html/2026/05/aa58126-25/aa58126-25-eq10.png) in a manner that a logistic-shaped cumulative distribution function can approximate. For example, Earth and Vesta differ in the mean temperatures experienced by their building blocks (parametrised by the inflexion point of the logistic curve, T0) and in the range of temperatures from which material was collected (characterised by the steepness of the logistic function, σ).
in a manner that a logistic-shaped cumulative distribution function can approximate. For example, Earth and Vesta differ in the mean temperatures experienced by their building blocks (parametrised by the inflexion point of the logistic curve, T0) and in the range of temperatures from which material was collected (characterised by the steepness of the logistic function, σ).
Building on this empirical model, we estimated the bulk compositions of synthetic planet(esimal)s by integrating the equilibrium condensates derived from our nebular condensation calculations over a range of temperatures. This could be related to a temperature gradient across the disk, or phases condensed over a range of times at a given location in a cooling disk.
For each element i, we calculated the mole fraction by integrating the product of the condensed material fraction and the normalised probability density function at each temperature point within the range of 400–1900 K, centred around a specified T0 with a specified σ.
For a given T0 and σ, the probability density function of a normal distribution, f(T), over the temperature range T is
![Mathematical equation: $\[f(T)=\frac{1}{\sigma ~\sqrt{2 \pi}} \exp \left(-\frac{\left(T-T_0\right)^2}{2 \sigma^2}\right).\]$](/articles/aa/full_html/2026/05/aa58126-25/aa58126-25-eq11.png) (3)
(3)
The normalised PDF, ϕ(T), is given by
![Mathematical equation: $\[\phi(T)=\frac{f(T)}{\sum_{T_c} f(T)},\]$](/articles/aa/full_html/2026/05/aa58126-25/aa58126-25-eq12.png) (4)
(4)
where the summation (∑Tc f(T)) is performed over the temperature range, Tc, defined by a given T0 and σ that represents a Gaussian-like feeding zone.
The molar planetary abundances of an element i, denoted by Xi, are calculated as
![Mathematical equation: $\[X_i=\sum_T \eta_i(T) \cdot \phi(T),\]$](/articles/aa/full_html/2026/05/aa58126-25/aa58126-25-eq13.png) (5)
(5)
where ηi(T) represents the condensed molar fraction of element i at temperature T, and ϕ(T) is the normalised PDF.
Sossi et al. (2022) report a mean temperature for the Earth of T0 = 1144 K with σ = 225 K. In our study, we examined the effect of varying T0 across 650, 900, 1150, and 1400 K, while keeping σ = 225 K fixed, to model the accretion of Earth-mass planetary bodies around these exotic stars. The effect of varying σ on planetary composition is also examined, confirming that our principal conclusions are not contingent on this choice.
3 Results
3.1 General behaviour and classification
The equilibrium condensation sequences calculated at a disk pressure of 10−4 bar for our selected stellar compositions (with C/O ranging from 0.6 to 0.95) reveal three distinct regimes of condensate mineralogy:
(i) Solar-like sequence (C/O ≤ 0.7) - Condensation proceeds through reactions analogous to those in the solar nebula. The assemblage consists exclusively of oxides and silicates.
(ii) Transitional sequence (C/O ~ 0.7–0.91) - Reducing phases, primarily graphite but also iron silicides, sulfides, carbides, and nitrides, begin to appear alongside the oxides and silicates present in the solar-like sequences. Their presence leads to the onset of silicate and oxide condensation at lower temperatures.
(iii) Reduced sequence (C/O ≥ 0.92) - characterised by little-to-no silicate or oxide formation in the refractory temperature range (T > 1400 K at 10−4 bar), and defined by the first appearance of SiC(s) as a direct condensate (here at ~1510 K). The other highest temperature refractory condensates are TiC(s), or graphite. The specific reactions responsible for this behaviour are discussed in Section 3.2.4.
These results indicate that the transitions between solar-like, transitional and reduced sequences occur near C/O ratios of ~0.7 and ~0.92, respectively. While the C/O ratio provides the primary classification metric, we note that, for a fixed C/O, higher metallicity generally promotes the earlier condensation of reducing phases. This is because additional metals consume oxygen, leaving less O available to form silicates and oxides (Larimer 1967; Adams & Lodders 2025).
As archetypes of condensation sequences in non-solar compositions, we highlight HD 94151 (C/O = 0.89) for the transitional sequences and HD 24633 (C/O = 0.95) for the reduced sequences. We note that not all transitional sequences necessarily condense every reduced phase in addition to graphite, as this depends on both metallicity and C/O ratio. To illustrate reactions, we use the sequence HD 94151 (C/O = 0.89) as an example, since its relatively high C/O ratio and metallicity lead to the condensation of all phases relevant to transitional sequences. HD 24633 was used for the reduced sequence because it has the highest C/O ratio in our dataset. Both sequences are compared with our model of solar nebula condensation, using the composition of Lodders (2003), as described in Section 3.2, to demonstrate the evolving nature of disk chemistry and, hence, the condensation sequence across these regimes.
In Section 3.3, we explore the variation in composition due to changes in total pressure, constant as a function of T at 10−6 bar, 10−4 bar, or 10−2 bar. Finally, the resultant bulk planetary compositions arising from variations in both composition and pressure are presented in Section 3.4.
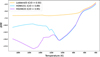 |
Fig. 2 Variation in oxygen fugacity with respect to the iron–wüstite buffer (ΔIW) as a function of disk mid-plane temperature for three representative cases: Lodders03 (solar-like sequence), HD 94151 (transitional sequence), and HD 24633 systems (reduced sequence). |
3.2 Condensate mineralogies with varying C/O ratios
The chemical differences due to the system’s C/O ratio are reflected in its oxygen fugacity (fO2) at a given pressure and temperature. Oxygen fugacity is primarily set by the H2O(g)/H2(g) ratio (Equation (1)), and hence is higher at lower C/O.
Figure 2 illustrates the variation in oxygen fugacity (fO2) relative to the Iron–Wüstite buffer (ΔIW) for three representative cases: Lodders03 (C/O = 0.50; solar-like sequence), HD 94151 (C/O = 0.89; transitional sequence), and HD 24633 (C/O = 0.95; reduced sequence). The fO2 of iron-wüstite is evaluated as a function of temperature using the standard thermodynamic parametrisation for the Fe-FeO equilibrium from O’Neill & Pownceby (1993) (their Eq. (8)). At higher temperatures, HD 94151 and HD 24633 exhibit lower fO2 than that calculated for a solar gas at the same pressure and temperature. The troughs in the graph correspond to points at which the fH2O/fH2 ratio decreases due to condensation reactions detailed in the subsequent subsections. Because these reactions differ among the three canonical sequences, the ΔIW values span a range of 10 orders of magnitude at high temperatures (>1400 K). By ~1100 K, the ΔIW values of the transitional and reduced sequences become indistinguishable from one another. Notably, at temperatures below 700 K, the ΔIW values of all three systems converge similarly, suggesting comparable redox conditions independent of C/O ratio below this temperature.
Figure 3 shows the instantaneous condensed fraction of each element j (![Mathematical equation: $\[f_{c}^{j}\]$](/articles/aa/full_html/2026/05/aa58126-25/aa58126-25-eq14.png) ), in a monotonically cooling system (Ti−1 > Ti), calculated as
), in a monotonically cooling system (Ti−1 > Ti), calculated as
![Mathematical equation: $\[f_c^j=x_{solid}^j(T_i)-x_{solid}^j(T_{i-1}).\]$](/articles/aa/full_html/2026/05/aa58126-25/aa58126-25-eq15.png) (6)
(6)
Here, ![Mathematical equation: $\[x_{solid}^{j}(T)\]$](/articles/aa/full_html/2026/05/aa58126-25/aa58126-25-eq16.png) is the cumulative molar fraction of element j present in condensed phases at temperature T. The positive peaks represent the initial condensation of major phases directly from the gas phase, while the troughs indicate the re-evaporation of a condensed solid. It is important to note that these curves do not account for the transformation of one solid to another through subsequent solid-state reactions, but rather only the fraction of the element condensed from the gas phase.
is the cumulative molar fraction of element j present in condensed phases at temperature T. The positive peaks represent the initial condensation of major phases directly from the gas phase, while the troughs indicate the re-evaporation of a condensed solid. It is important to note that these curves do not account for the transformation of one solid to another through subsequent solid-state reactions, but rather only the fraction of the element condensed from the gas phase.
Table 1 lists the peak temperatures (i.e, ![Mathematical equation: $\[\frac{\mathrm{d} f_{c}^{2}}{\mathrm{~d} T^{2}}=0\]$](/articles/aa/full_html/2026/05/aa58126-25/aa58126-25-eq17.png) ) associated with the initial condensation of distinct condensate phases in the solar-like (Lodders03; C/O= 0.50), transitional (HD 94151; C/O= 0.89), and reduced (HD 24633; C/O= 0.95) systems, calculated at the canonical pressure of 10−4 bar. Only the first major condensation peaks are included; secondary peaks corresponding to the recondensation of previously condensed phases are not reported here. Peaks with fc < 0.04 have been omitted, as they do not represent significant contributions, except in the case of nitrogen, which is retained to emphasise the partial condensation of N in high C/O systems.
) associated with the initial condensation of distinct condensate phases in the solar-like (Lodders03; C/O= 0.50), transitional (HD 94151; C/O= 0.89), and reduced (HD 24633; C/O= 0.95) systems, calculated at the canonical pressure of 10−4 bar. Only the first major condensation peaks are included; secondary peaks corresponding to the recondensation of previously condensed phases are not reported here. Peaks with fc < 0.04 have been omitted, as they do not represent significant contributions, except in the case of nitrogen, which is retained to emphasise the partial condensation of N in high C/O systems.
In solar-like systems, most elements exhibit a single, well-defined condensation peak corresponding to most of their incorporation into solid(s). Exceptions to this generality include Ca, Si, and O, which display more complex condensation behaviour. Notably, N and C do not condense above 400 K in the solar nebula, while S condenses only below 700 K, predominantly in the form of troilite (FeS(s)). In transitional and reduced systems, N (as sinoite and TiN) and C (as SiC and C) condense, and S condenses not only into troilite, but also at higher temperatures via oldhamite and niningerite ((Ca, Mg)S(s)). Sulfur peaks show complex behaviour due to multi-stage condensation–evaporation cycles. In the following subsections, we discuss the condensation sequence and disk chemistry that reflect these elemental condensation peaks, as well as variations in oxygen fugacity across systems with varying C/O.
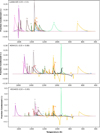 |
Fig. 3 Instantaneous fraction condensed (fc) of each element as a function of temperature in solar-like (Lodders 03; C/O= 0.50), transitional (HD 94151; C/O= 0.89), and reduced (HD 24633; C/O= 0.95) systems at 10−4 bar total pressure (for the relevant reactions corresponding to the condensation peaks, see Sects. 3.2.1–3.2.5). |
Instantaneous fraction condensed (fc) and condensation temperatures (T) for solar-like (Lodders03; C/O= 0.50), transitional (HD 94151; C/O= 0.89), and reduced (HD 24633; C/O= 0.95) systems, calculated at disk pressure of 10−4 bar.
3.2.1 Oxide phases
In solar-like nebular environments, refractory elements (here Ca, Al, and Ti) mostly condense as oxide phases. As shown in Figure 4a, corundum (cor*) – Al2O3 – initiates the condensation sequence (Al fc peak: 1670 K) via the net chemical reaction
![Mathematical equation: $\[2 ~\mathrm{Al}_{(\mathrm{g})}+3 ~\mathrm{H}_2 \mathrm{O}_{(\mathrm{g})} \longrightarrow \mathrm{Al}_2 \mathrm{O}_{3(\mathrm{s})}+3 ~\mathrm{H}_{2(\mathrm{g})},\]$](/articles/aa/full_html/2026/05/aa58126-25/aa58126-25-eq18.png) (7)
(7)
or equivalently
![Mathematical equation: $\[2 ~\mathrm{Al}_{(\mathrm{g})}+\frac{3}{2} ~\mathrm{O}_{2(\mathrm{g})} \longrightarrow \mathrm{Al}_2 \mathrm{O}_{3(\mathrm{s})}.\]$](/articles/aa/full_html/2026/05/aa58126-25/aa58126-25-eq19.png) (8)
(8)
As the gas cools, Ca(g) reacts with condensed corundum to produce Ca-rich hibonite (hib*) – CaAl12O19 (Ca fc peak: 1610 K) via net chemical reaction:
![Mathematical equation: $\[6 \mathrm{Al}_2 \mathrm{O}_{3(\mathrm{s})}+\mathrm{Ca}_{(\mathrm{g})}+\frac{1}{2} \mathrm{O}_{2(\mathrm{g})}=\mathrm{CaAl}_{12} \mathrm{O}_{19(\mathrm{s})}.\]$](/articles/aa/full_html/2026/05/aa58126-25/aa58126-25-eq20.png) (9)
(9)
Hibonite is then consumed to form Ca-rich grossite (gro*) - CaAl4O10 (Ca fc peak: 1575 K) via the net chemical reaction
![Mathematical equation: $\[\mathrm{CaAl}_{12} \mathrm{O}_{19(\mathrm{s})}+2 \mathrm{Ca}_{(\mathrm{g})}+\mathrm{O}_{2(\mathrm{g})}=3 \mathrm{CaAl}_4 \mathrm{O}_{7(\mathrm{s})}.\]$](/articles/aa/full_html/2026/05/aa58126-25/aa58126-25-eq21.png) (10)
(10)
Titanium, present primarily as TiO(g), first condenses as CaTiO3(s) – Ca-perovskite (prv*) with Ti fc peak: 1575 K, through the net chemical reaction
![Mathematical equation: $\[\mathrm{TiO}_{(\mathrm{g})}+\mathrm{Ca}_{(\mathrm{g})}+\mathrm{O}_{2(\mathrm{g})} \longrightarrow \mathrm{CaTiO}_{3(\mathrm{s})}.\]$](/articles/aa/full_html/2026/05/aa58126-25/aa58126-25-eq22.png) (11)
(11)
Below ~1400 K, further condensation proceeds through heterogeneous gas–solid reactions, leading to the formation of additional oxide phases including (Mg, Al, Ti, Fe)3O4(s) – Ti-spinel (Ti-spl*), (Fe, Mg, Al, Ti) (Fe, Al, Ti) O3(s) – ilmenite (ilm*), and (Fe, Mg, Ni, Cr, Al) (Fe, Al, Cr, Ni, Mg)2O4 – Cr-bearing spinel (spi*).
Transitional sequences (Figure 4b) exhibit a comparable phase assemblage to solar-like sequences, but are shifted to lower temperatures. Condensation of corundum (Al fc peak: 1525 K) is followed by perovskite (Ti fc peak: 1515 K), hibonite (Ca fc peak: 1470 K), and grossite (Ca fc peak: 1435 K). TiO(g) remains the dominant titanium-bearing gas at and below the temperature of the appearance of the first condensate, but Ti(g) predominates at higher temperatures. Ti-spinel is stable over a wider temperature range here (1200–1000 K) than in solar-like cases. In solar-like systems, these elements normally combine with Si to make silicates. Here, however, Si instead forms iron silicides (Section 3.2.3) due to the lower fO2, since less Si is incorporated into silicates. Below 900 K, phases Ti-spinel, ilmenite, and spinel form in a manner reminiscent of the solar-like sequences.
Figure 4c highlights the reduced sequences, where no oxides and silicates condense in the temperature range of refractory phases in the solar sequences (>1400 K). As Ti(g) overtakes TiO(g) as the primary titanium-bearing gas, Ti condenses as a carbide phase instead of Ca-perovskite due to low TiO(g) partial pressure (for more details, see Section 3.2.4). Ca- and Al-bearing oxides condense similarly to the other two sequences, but at still lower temperatures: corundum condensation (Al fc peak: 1335 K) is followed by hibonite (Ca fc peak: 1320 K), and grossite (Ca fc peak: 1300 K). Similar to transitional sequences, Ti-spinel is stable over a wide temperature range, whereas oxides forming below 900 K mirror those in other sequences (again due to converging fO2-T paths, cf. Figure 2).
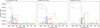 |
Fig. 4 Condensation of (refractory) oxides (Al, Ca, Ti, O ± Mg, Fe, Cr, Ni) in solar-like (Lodders03; C/O= 0.50), transitional (HD 94151; C/O= 0.89), and reduced (HD 24633; C/O= 0.95) systems at a disk pressure of 10−4 bar. Species marked with an asterisk (*) are treated as solid solution phases in the calculations. |
3.2.2 Major silicates
While numerous minor silicate species condense, we focus here on the major silicates that remain stable over a temperature range of at least 200 K. The major silicate bearing gas in sun-like sequences is SiO(g), followed by SiS(g). Figure 5a illustrates that silicate condensation in solar-like sequences begins with Ca(Mg, Fe, Al)Si2O6(s) – Ca-rich clinopyroxene (cpx*), and CaAl2Si2O8(s) – anorthitic feldspar (fsp*) – (Si fc peak: 1405 K). The dominant solid solution components of silicate minerals are shown in Figure C.1. Next, Mg2SiO4(s) – forsteritic olivine (ol*) condenses (Si fc peak: 1350 K) through the net chemical reaction
![Mathematical equation: $\[2~\mathrm{Mg}_{(\mathrm{g})}+\mathrm{SiO}_{(\mathrm{g})}+3 ~\mathrm{H}_2 \mathrm{O}_{(\mathrm{g})} \longrightarrow \mathrm{Mg}_2 \mathrm{SiO}_{4(\mathrm{s})}+3 \mathrm{H}_{2(\mathrm{g})}.\]$](/articles/aa/full_html/2026/05/aa58126-25/aa58126-25-eq23.png) (12)
(12)
Subsequently, MgSiO3(s), enstatitic orthopyroxene (opx*), forms (Si fc peak: 1280 K) at the expense of olivine via the net chemical reaction
![Mathematical equation: $\[\mathrm{Mg}_2 \mathrm{SiO}_{4(\mathrm{s})}+\mathrm{SiO}_{(\mathrm{g})}+\mathrm{H}_2 \mathrm{O}_{(\mathrm{g})} \longrightarrow 2 ~\mathrm{MgSiO}_{3(\mathrm{s})}+\mathrm{H}_{2(\mathrm{g})}.\]$](/articles/aa/full_html/2026/05/aa58126-25/aa58126-25-eq24.png) (13)
(13)
As shown in Figure C.1, the feldspar (fsp*) becomes more albitic (NaAlSi3O8) at cooler temperatures (Na fc peak: 1050 K).
Similarly, as established in Grossman (1972) and Mokhtari & Bourdon (2025), the fayalite component of olivine (Fe2SiO4(s)) increases below ~600 K via the net chemical reaction:
![Mathematical equation: $\[\begin{aligned}2 ~\mathrm{Fe}_{(\mathrm{s})}+2 ~\mathrm{MgSiO}_{3(\mathrm{s})}+ & 2 ~\mathrm{H}_2 \mathrm{O}_{(\mathrm{g})} \longrightarrow \\& \mathrm{Mg}_2 \mathrm{SiO}_{4(\mathrm{s})}+\mathrm{Fe}_2 \mathrm{SiO}_{4(\mathrm{s})}+2 ~\mathrm{H}_{2(\mathrm{g})}.\end{aligned}\]$](/articles/aa/full_html/2026/05/aa58126-25/aa58126-25-eq25.png) (14)
(14)
Figure 5b shows that in transitional sequences, the most abundant gas is still SiO(g), followed by an increased stability of SiS(g) at higher temperatures. Condensation begins with clinopyroxene ((Ca, Al, Mg)Si2O6(s); Mg fc peak: 1200 K) and anorthite (CaAl2Si2O8(s)). Compared to solar-like sequences, anorthite stability decreases in both the abundance and the temperature of its first appearance Figure C.1a, b. This is because some of the Ca is now sequestered in (Ca, Mg) S due to the lower fO2 (see Section 3.2.5).
The next silicate phases to condense are forsteritic olivine (Si fc peak: 1195 K) and enstatitic orthopyroxene (O fc peak: 930 K) via Eqs. (12) and (13). The plagioclase becomes more albitic (Na fc peak: 935 K). Enstatite breaks down to olivine + clinopyroxene at ~900 K. Fayalitic olivine becomes stable below ~600 K, similar to solar-like sequences (Figure C.1). Notably, NaAlSiO4(s) – nepheline (nph*) replaces feldspar below 500 K Figure C.1. The fc peaks of the condensed silicates in transitional sequences are lower compared to those in solar-like sequences.
As observed in Figure 5c, reduced sequences exhibit a further decline in SiO(g) stability, with SiS(g) being more abundant at higher temperatures than was the case for transitional sequences. The first major silicate to condense is olivine (Si fc peak: 1130 K), followed by limited condensation of plagioclase feldspar that contains both Ca and Na (Na fc peak: 940 K). The olivine solid solution becomes more fayalitic only below 500 K. Clinopyroxene and nepheline form via the breakdown of olivine and feldspar below ~850 K. Orthopyroxene does not condense in the system HD 24633 due to its high Mg/Si ratio, but is observed in the other reduced system: HD 68607. This behaviour is consistent with that reported by Jorge et al. (2022) for Star 3 (HIP 63048), where orthopyroxene is likewise absent at a comparable Mg/Si ratio.
It is important to note that the presence of nepheline in the systems HD 94151 and HD 24633 is not determined by C/O but by the stability of feldspar, which cannot coexist with nepheline. The relative stability of olivine versus orthopyroxene is primarily governed by the system’s Mg/Si ratio. In systems exhibiting elevated Mg/Si ratios (e.g., HD 24633, Mg/Si = 1.59), olivine predominates; conversely, both olivine and orthopyroxene are stable in systems with moderate Mg/Si ratios, such as HD 94151 (Mg/Si = 1.11) and Lodders03 (Mg/Si = 1.02). Here, we also report the Mg# (MgO/(MgO + FeO)) at 500 K across all three systems. In Lodders03, the Mg# at 500 K is 0.69, while in HD 94151 and HD 24633 it reaches 0.77 and 0.96, respectively. These values reflect both the fraction of oxidised Fe available for incorporation into the olivine solid solution and the Mg/Fe ratio of the host star. In both transitional and reduced sequences, the main change is that silicate condensation occurs at lower temperatures, since at higher temperatures, oxides and silicates are replaced by metals, carbides, nitrides, and silicides (see below).
3.2.3 Metals and silicides
Figure 6a shows that in solar-like sequences, iron primarily condenses as a metallic alloy, Fe(s) with a face-centred cubic (fcc) structure (Fe fc peak: 1350 K) via the reaction
![Mathematical equation: $\[\mathrm{Fe}_{(\mathrm{g})}=\mathrm{Fe}_{(\mathrm{s})}^{\mathrm{fcc}}.\]$](/articles/aa/full_html/2026/05/aa58126-25/aa58126-25-eq26.png) (15)
(15)
At temperatures below 1130 K, it transforms via a solid-state reaction into Fe(s) with a body-centred cubic (bcc) structure.
Ni(s) and Cr(s) primarily condense into solid Fe-alloy solutions from their gaseous forms, Ni(g) and Cr(g). Their fc peaks occur at 1360 K for Ni and 1325 K for Cr, respectively. In Figure C.3 we highlight the variation in ![Mathematical equation: $\[T_{c}^{50 \%}\]$](/articles/aa/full_html/2026/05/aa58126-25/aa58126-25-eq27.png) values for different elements when condensation is modelled with and without the incorporation of solid solutions. Notably, the largest differences are observed for Ni and Cr (~100 K higher when solid solutions are included), since their condensation into the Fe fcc alloy phase as dilute components is more energetically favourable than condensing pure metallic Cr(s) or Ni(s).
values for different elements when condensation is modelled with and without the incorporation of solid solutions. Notably, the largest differences are observed for Ni and Cr (~100 K higher when solid solutions are included), since their condensation into the Fe fcc alloy phase as dilute components is more energetically favourable than condensing pure metallic Cr(s) or Ni(s).
Figure 6b shows that, in transitional sequences, iron initially condenses as Fe(s) (Fe fc peak: 1365 K) via Equation (15). Elements Cr and Ni are incorporated into the iron alloy phase (Fe(s)), similar to solar-like sequences. Cr has fc peak at 1340 K and Ni at 1370 K. Eventually, Fe(s) reacts with gaseous SiO(g) to form Fe3Si(s) (Si fc peak: 1230 K) through the net reaction
![Mathematical equation: $\[2 ~\mathrm{SiO}_{(\mathrm{g})}+6 ~\mathrm{Fe}_{(\mathrm{s})} \longrightarrow 2 ~\mathrm{Fe}_3 \mathrm{Si}_{(\mathrm{s})}+\mathrm{O}_{2(\mathrm{g})}.\]$](/articles/aa/full_html/2026/05/aa58126-25/aa58126-25-eq28.png) (16)
(16)
At cooler temperatures, FeSi(s) consumes further SiO(g) and Fe3Si(s) at ~1150 K by
![Mathematical equation: $\[\mathrm{Fe}_3 \mathrm{Si}_{(\mathrm{s})}+2 ~\mathrm{SiO}(\mathrm{g}) \longrightarrow 3 ~\mathrm{FeSi}_{(\mathrm{s})}+\mathrm{O}_2(\mathrm{g}).\]$](/articles/aa/full_html/2026/05/aa58126-25/aa58126-25-eq29.png) (17)
(17)
Iron silicides remain stable only down to ~ 930 K. Below this temperature, Fe is stable as Fe-bcc alloy, whereas the Si is incorporated into feldspar solid solution, pyroxene, and olivine (Figure 5b).
In reduced sequences, iron condenses as FeSi(s) (Fe and Si fc peak: 1445 K) through the reaction of Fe(g) and SiO(g) with silicon carbide:
![Mathematical equation: $\[2~\mathrm{Fe}_{(\mathrm{g})}+\mathrm{SiO}_{(\mathrm{g})}+\mathrm{SiC}_{(\mathrm{s})} \longrightarrow 2 ~\mathrm{FeSi}_{(\mathrm{s})}+\mathrm{CO}_{(\mathrm{g})}.\]$](/articles/aa/full_html/2026/05/aa58126-25/aa58126-25-eq30.png) (18)
(18)
The presence of SiC(s) in the refractory region of the disk (>1400 K), which is involved in Equation (18) is discussed in Section 3.2.4.
As the sequence progresses, additional reactions with FeSi(s), SiO(g) and Fe(g) lead to the formation of Fe3Si(s) (Fe fc peak: 1370 K), and the condensation of additional FeSi(s) via reaction 17, and finally the breakdown of Fe3Si(s) into Mg2SiO4(s) and Fe(s) in fcc structure (Fe fc peak: 1335 K) coincident with the condensation of Mg(g). Cr and Ni condense into the iron alloy in accordance with the solar-like and transitional sequences.
Hence, iron silicides (FexSi(s)), which are absent in solar-like systems, act as the dominant carriers of Si and Fe in systems with elevated C/O ratios at intermediate temperatures (~1400–1000 K). The formation of these phases limits the amount of Si available to form SiC(s) in high C/O sequences. This effect is shown in Figure C.5, which compares Gibbs energy minimisation with and without iron silicides. Thus, computations that ignore FexSi(s) as a stable phase grossly overpredict the amount of C that can condense in reducing, high C/O sequences.
 |
Fig. 7 Same as Figure 4, but for condensation of carbide and nitride phases. The inset shows the minor C-bearing phases on a log scale. |
3.2.4 Carbides and nitrides
As seen in Figure 7a, in solar-like sequences, carbon remains in the gas form at all temperatures >400 K. At ~650 K and 10−4 bar, the mole fractions of CO(g) and CH4(g) become equal. Below this temperature, CH4(g) becomes the predominant carbon-bearing gas, facilitated by the reaction
![Mathematical equation: $\[2 ~\mathrm{CO}_{(\mathrm{g})}+4 ~\mathrm{H}_{2(\mathrm{g})} \longrightarrow 2 ~\mathrm{CH}_{4(\mathrm{g})}+\mathrm{O}_{2(\mathrm{g})}.\]$](/articles/aa/full_html/2026/05/aa58126-25/aa58126-25-eq31.png) (19)
(19)
We note, however, that the kinetics of this reaction are likely too slow for equilibrium to have been reached during typical nebular lifetimes (Fegley 2000).
Figure 7b demonstrates that transitional sequences result in the condensation of SiC(s) followed by C(s), both of which are absent in solar-like sequences. The former condenses at ~1100 K via heterogeneous reactions in which some Si from previously formed FeSi(s) is consumed:
![Mathematical equation: $\[\mathrm{FeSi}_{(\mathrm{s})}+\mathrm{CO}_{(\mathrm{g})}=\mathrm{Fe}_{(\mathrm{s})}^{\mathrm{fcc}}+\mathrm{SiC}_{(\mathrm{s})}+\frac{1}{2} \mathrm{O}_{2(\mathrm{g})}.\]$](/articles/aa/full_html/2026/05/aa58126-25/aa58126-25-eq32.png) (20)
(20)
The SiC(s) abundances are vanishingly low, of the order of 10−4 mol %, due to iron silicide condensation, as described previously and illustrated in Figure C.5.
Graphite is the most abundant C-bearing phase, and condenses from ~1050 K (C fc peak: 930 K) via the net reaction:
![Mathematical equation: $\[2 ~\mathrm{CO}_{(\mathrm{g})} \longrightarrow 2 ~\mathrm{C}_{(\mathrm{s})}+\mathrm{O}_{2(\mathrm{g})}.\]$](/articles/aa/full_html/2026/05/aa58126-25/aa58126-25-eq33.png) (21)
(21)
A distinctive feature is the emergence of TiN(s) (N fc peak: 1195 K), which condenses via the reaction of N2(g) with perovskite. TiN(s) transitions to TiC(s) through net reaction:
![Mathematical equation: $\[2 ~\mathrm{TiN}_{(\mathrm{s})}+2 ~\mathrm{CO}_{(\mathrm{g})} \longrightarrow 2 ~\mathrm{TiC}_{(\mathrm{s})}+\mathrm{N}_{2(\mathrm{g})}+\mathrm{O}_{2(\mathrm{g})}.\]$](/articles/aa/full_html/2026/05/aa58126-25/aa58126-25-eq34.png) (22)
(22)
The conversion of TiN(s) to TiC(s), and the evaporation of nitrogen followed by the subsequent recondensation of TiN(s), are shown in Figure C.4.
Minor carbide phases such as Cr4C(s) (Cr fc peak: 1220 K) and Cr3C2(s) occur as Cr(s) dissolved in iron alloy reacts with CO(g) via the following reactions:
![Mathematical equation: $\[8 ~\mathrm{Cr}_{(\mathrm{s})}+2 ~\mathrm{CO}_{(\mathrm{g})} \longrightarrow 2 ~\mathrm{Cr}_4 \mathrm{C}_{(\mathrm{s})}+\mathrm{O}_{2(\mathrm{g})},\]$](/articles/aa/full_html/2026/05/aa58126-25/aa58126-25-eq35.png) (23)
(23)
![Mathematical equation: $\[3 ~\mathrm{Cr}_{(\mathrm{s})}+2 ~\mathrm{CO}_{(\mathrm{g})} \longrightarrow \mathrm{Cr}_3 \mathrm{C}_{2(\mathrm{s})}+\mathrm{O}_{2(\mathrm{g})}.\]$](/articles/aa/full_html/2026/05/aa58126-25/aa58126-25-eq36.png) (24)
(24)
Figure 7c illustrates that reduced sequences display condensed phases similar to transitional sequences, but differ in two particular respects:
-
TiC(s) (Ti fc peak: 1655 K) condenses directly from gaseous Ti(g) via Equation (25), replacing corundum as the most refractory phase
![Mathematical equation: $\[2 ~\mathrm{Ti}+2 ~\mathrm{CO}_{(\mathrm{g})} \longrightarrow 2 ~\mathrm{TiC}_{(\mathrm{s})}+\mathrm{O}_{2(\mathrm{g})}.\]$](/articles/aa/full_html/2026/05/aa58126-25/aa58126-25-eq37.png) (25)
(25)Here TiN(s) forms via a solid state reaction sequentially from TiC(s). This is followed by the TiN(s) – TiC(s) conversion dynamic as was observed in transitional sequences (Figure C.4).
-
Direct condensation of SiC(s) at ~1510 K (refractory region) from the gas phase through the reaction
![Mathematical equation: $\[\mathrm{Si}_{(\mathrm{g})}+\mathrm{CO}_{(\mathrm{g})} \longrightarrow \mathrm{SiC}_{(\mathrm{s})}+\mathrm{SiO}_{(\mathrm{g})}.\]$](/articles/aa/full_html/2026/05/aa58126-25/aa58126-25-eq38.png) (26)
(26)SiC subsequently disintegrates at ~1470 K such that the Si enters FeSi(s) and C forms CO(g) via Equation (18). SiC condenses again at ~1085 K from Equation (20), similar to the condensation we observe in transitional sequences. Graphite condenses via Equation (21) (C fc peak: 1060), Cr4C(s) forms via Equation (23), and Cr3C2(s) forms via Equation (24).
Furthermore, although not present in HD 94151 ([Fe/H] = 0.04) and HD 24633 ([Fe/H] = −0.04), in both transitional and reduced sequences, at elevated [Fe/H], silicon oxynitride (SiNO*) phases – mainly sinoite – condense around ~1000 K but do so over a very narrow temperature range between 900 and 800 K at vanishingly low abundances (order of 10−4 mol %).
3.2.5 Sulfide phases
As observed in Figure 8, in solar-like sequences, sulfur is predominantly present in the gas phase, with H2S(g) being the major sulfur-bearing species, followed by HS(g) and SiS(g). At temperatures above 700 K, sulfur remains in the gas phase before condensing directly as FeS(s) – pyrrhotite (pyh*) with S fc peak: 680 K, which also incorporates Ni (Figure C.2 via the reaction
![Mathematical equation: $\[(\mathrm{Fe}, \mathrm{Ni})_{(\mathrm{s})}+\mathrm{H}_2 \mathrm{S}_{(\mathrm{g})} \longrightarrow(\mathrm{Fe}, \mathrm{Ni}) \mathrm{S}_{(\mathrm{s})}+\mathrm{H}_{2(\mathrm{g})}.\]$](/articles/aa/full_html/2026/05/aa58126-25/aa58126-25-eq39.png) (27)
(27)
At lower temperatures, smaller amounts of ((Fe, Ni)9S8), pentlandite (pn*), stabilise.
In transitional sequences, the lower oxygen fugacity leads to a significant fraction of silicon being sequestered in the gas phase as SiS(g) as opposed to SiO(g). The higher partial pressure of SiS(g) compared to the solar-like sequences results in the condensation of CaS(s) (Ca fc peak: 1395 K) before it re-evaporates at ~1280 K and MgS(s) (S fc peak: 1125 K) between 1400 and 800 K. As illustrated in Figure C.2, CaS(s) and MgS(s) form through two distinct reactions: condensation directly from the gas phase (s1) and via a heterogeneous gas-solid reaction (s2), where s 1 and s 2 are the compositions of two immiscible CaS-MgS solid solution phases that coexist within the miscibility gap below 1100°C.
At lower temperatures, the partial pressure of H2S(g) increases, facilitating the formation of pyrrhotite (S fc peak: 670 K) via Equation (27), pentlandite and ((Fe, Ni)9S8(s)). These phases dominate sulfur chemistry below 680 K, consistent with solar-like sequences. Sulfide phases in reduced sequences are the same as transitional sequences: condensing in sequence CaS(s) (Ca fc peak: 1290 K), MgS(s) (S fc peak: 1180 K), FeS(s) (S fc peak: 655 K), ((Fe, Ni)9S8(s)).
3.3 Condensate mineralogies with varying pressure
As the total pressure at which the computations were performed increases, the partial pressures of stable gas species tend to increase in accordance with Dalton’s law. This leads to a systematic increase in the ![Mathematical equation: $\[T_{c}^{50 \%}\]$](/articles/aa/full_html/2026/05/aa58126-25/aa58126-25-eq40.png) temperatures of most elements as a function of P, notably those with condensation reactions depending on pM (where M is a metal), such as Eq. 15. Table 2 lists the
temperatures of most elements as a function of P, notably those with condensation reactions depending on pM (where M is a metal), such as Eq. 15. Table 2 lists the ![Mathematical equation: $\[T_{c}^{50 \%}\]$](/articles/aa/full_html/2026/05/aa58126-25/aa58126-25-eq41.png) values for elements in three representative systems: Lodders03 (solar-like), HD 94151 (transitional), and HD 24633 (reduced) – evaluated at total pressures of 10−2, 10−4, and 10−6 bar, also illustrated in Figure C.6.
values for elements in three representative systems: Lodders03 (solar-like), HD 94151 (transitional), and HD 24633 (reduced) – evaluated at total pressures of 10−2, 10−4, and 10−6 bar, also illustrated in Figure C.6.
Exceptions to this trend arise, including, importantly, the substantial decrease in the amount of graphite and SiC(s) with pressure from 10−6 to 10−2 bar (Figures 9 and C.7) resulting in decrease in amount of condensed C. At 10−2 bar, these species no longer condense in our simulations. This behaviour can be attributed to the pressure-dependent reaction:
![Mathematical equation: $\[\mathrm{CO}(\mathrm{g})+3 ~\mathrm{H}_2(\mathrm{g}) \longrightarrow \mathrm{CH}_4(\mathrm{g})+\mathrm{H}_2 \mathrm{O}(\mathrm{g}).\]$](/articles/aa/full_html/2026/05/aa58126-25/aa58126-25-eq42.png) (28)
(28)
As pressure increases, the equilibrium shifts toward the product side due to the reduction in the number of gas molecules. Consequently, the temperature at which xCO(g)/xCH4(g) = 1 shifts to higher values with increasing pressure (Fig. 9). As CO(g) is consumed in the formation of methane, the partial pressure of CO(g) decreases below the saturation threshold required for the condensation of C(s) and SiC(s).
Another important observation pertains to sulfide condensates (Fig. 10). For the solar-like sequence (e.g., the Lodders03 system), Table 2 indicates that sulfur ![Mathematical equation: $\[T_{c}^{50 \%}\]$](/articles/aa/full_html/2026/05/aa58126-25/aa58126-25-eq43.png) remains constant at 645 K. The condensation of FeS(s) occurs via Equation (27), but this reaction is pressure-independent as the number of gas molecules remains equal between the reactants and products (Lewis 1972). Since, in the solar-like sequence, FeS(s) is the only sulfur-bearing condensed phase, the condensation temperature of S is independent of pressure. In contrast, for transitional and reduced sequences (e.g., HD 94151 and HD 24633), Table 2 shows that sulfur
remains constant at 645 K. The condensation of FeS(s) occurs via Equation (27), but this reaction is pressure-independent as the number of gas molecules remains equal between the reactants and products (Lewis 1972). Since, in the solar-like sequence, FeS(s) is the only sulfur-bearing condensed phase, the condensation temperature of S is independent of pressure. In contrast, for transitional and reduced sequences (e.g., HD 94151 and HD 24633), Table 2 shows that sulfur ![Mathematical equation: $\[T_{c}^{50 \%}\]$](/articles/aa/full_html/2026/05/aa58126-25/aa58126-25-eq44.png) changes with pressure. The condensation of (Ca, Mg)S(s) at these temperatures is governed by a pressure-dependent reaction.
changes with pressure. The condensation of (Ca, Mg)S(s) at these temperatures is governed by a pressure-dependent reaction.
Furthermore, although the condensation of (Ca, Mg)S(s) in both transitional and reduced sequences shifts towards higher temperatures with increasing pressure, the total amount of condensed (Ca, Mg)S(s) decreases. This occurs because condensation is controlled by the partial pressure of SiS(g), which is progressively converted to H2S(g) at higher temperatures under elevated pressures.
3.4 Bulk compositions of hypothetical planet(esimal)s
As described in Section 2.3, we employed the stochastic accretion model of Sossi et al. (2022) to accrete condensates within a given feeding zone defined by the inflexion point T0 and steepness σ of a logistic curve. Higher T0 values favour the incorporation of refractory elements that condense at high temperatures, whereas lower T0 values allow greater proportions of volatile elements to accrete. It follows that larger σ values allows integration of material across broader temperature and pressure gradients. In comparison, smaller σ values restrict accretion of solids that condensed over a narrower temperature interval, thereby preserving localised chemical signatures tied closely to the specific T0 Figure C.9.
To assess the compositional changes in planet(esimal)s formed through the accretion of condensates, we focus the results discussed here on the T0-dependent variations in their bulk composition across three systems (Lodders03, HD 94151, and HD 24633) within an Earth-like feeding zone (σ = 225) at a disk pressure of 10−4 bar. We also discuss the influence of disk pressure on planetesimal composition by comparing accretion of solids in sequences at 10−6, 10−4, and 10−2 bar.
Shown in Figures 11 and 12a, planet(esimal)s modelled based on the solar-like sequence (here Lodders03; C/O = 0.50) exhibit a narrow compositional range in molar Fe, Mg and Si abundances independent of the T0 of the planet(esimal)s. Furthermore, their Fe/Mg, Mg/Si and Fe/O ratio are nearly indistinguishable across the temperature regimes from which they accreted.
In contrast, for transitional and reduced systems (here HD 94151 and HD 24633), the highest molar Fe/Mg ratio (~4–5) and Fe/O ratio (~ 1.4–2) occur at T0 = 1400 K, at which only small fractions of the total Mg and Si budgets have accreted. The Fe/Mg ratio decreases with decreasing T0, approaching their host star’s ratio only at T0 ~ 650 K (Figure 12a). The Fe/O ratio also decreases with T0, reflecting progressive condensation of oxygen-bearing phases as the system cools (Figure 12b). Even planet(esimal)s formed with T0 of 650 K do not converge to the oxygen content of their host star, because a large fraction of the oxygen budget remains gaseous above 400 K. This is also evident for the solar system planets shown (Earth and Mars), whose O budgets are clearly lower than that of the Sun. The Mg/Si ratio, on the other hand, increases with decreasing T0, which reflects the relatively refractory nature of Si over Mg in these C/O rich disks, mainly due to its sequestration into FexSi(s) as shown in Section 3.2.3.
As shown in Figure 13, the behaviour of volatile elements such as sulfur (S) and carbon (C) also varies significantly. In the solar-like system (here Lodders03), S is incorporated into planet(esimal)s only at much lower temperatures (<700 K), with C essentially remaining volatile throughout. In contrast, in high C/O systems, S and C-bearing condensates occur at higher temperatures, leading to higher fractions of them compared to solar system planets, even at T0 ≥ 1400 K.
We note that, although we adopt σ = 225 as an agnostic feeding-zone width informed by an Earth accretion scenario, the effective feeding zone of exoplanets may vary with their dynamical history, migration, or final planetary mass. To evaluate the sensitivity of our results to this assumption, we repeat the calculations for both narrower (σ = 50) and broader (σ = 300) feeding zones, as shown in Figure C.9. The more pronounced systematic variations in Fe/O, Fe/Mg, and Mg/Si ratios, together with the enhanced S and C abundances highlighted above, persist across these cases. Our conclusions are therefore not contingent on the specific choice of feeding zone width.
Table 3 shows the bulk compositions of planet(esimal)s forming at T0 = 1150 K (T0 assumed for Earth; Sossi et al. 2022). Relative to the solar-like sequence, bodies forming in C/O-enriched systems are markedly enriched in Fe and Ti, while depleted in Mg, O, Si, and Na. Refractory elements such as Ca and Al accrete in comparable amounts across all systems. In contrast, volatile elements, including S, C, and N – which condense only minimally (or not at all) above 400 K in solar-like sequences, contribute up to a few wt % in high C/O systems.
The variability in these trends is further influenced by total pressure. Figure 13 shows that for a given system, planet(esimal)s formed at 10−2 bar contain up to ~100× lower carbon mass fractions relative to those formed at 10−6 bar. In contrast, an increase in pressure leads to condensation of sulfurbearing CaS(s) and MgS(s) at increasingly higher temperatures in transitional and reduced systems. However, because these phases condense and re-evaporate over a relatively narrow temperature interval, their influence on the corresponding S budget of a hypothetical planet(-esimal)s is limited. In the solar-like system, sulfur condenses only via the pressure-independent reaction, resulting in the formation of troilite at ~680 K, and hence, its incorporation into planet(esimal)s is roughly independent of pressure. These calculations highlight the contrasting effects of pressure on carbon and sulfur overall: higher pressures suppress the amount of carbon-bearing condensates but have minimal impact on that of sulfur-bearing condensates, regardless of the system’s C/O ratio.
Condensation temperatures, ![Mathematical equation: $\[T_{c}^{50 \%}\]$](/articles/aa/full_html/2026/05/aa58126-25/aa58126-25-eq45.png) (K) for elements in solar-like (Lodders03; C/O= 0.50), transitional (HD 94151; C/O= 0.89), and reduced (HD 24633; C/O= 0.95) systems at three different disk pressures.
(K) for elements in solar-like (Lodders03; C/O= 0.50), transitional (HD 94151; C/O= 0.89), and reduced (HD 24633; C/O= 0.95) systems at three different disk pressures.
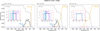 |
Fig. 9 Stability of carbon-bearing phases in system HD 94151 at pressures of (a) 10−6bar, (b) 10−4bar, and (c) 10−2bar. |
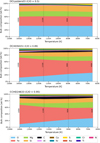 |
Fig. 11 Bulk composition of accreted planet(esimal)s at various T0 marked as dotted lines, with a feeding zone of 225 K around Lodders 03 (a), around HD 94151 (b), and around HD 24633 (c). |
4 Discussion
4.1 Disk chemistry and redox conditions
As detailed in Section 3, we identify three distinct regimes of disk chemistry governed by nebular carbon-to-oxygen (C/O) ratios. For C/O ≲ 0.7, condensation follows a solar-like sequence dominated by silicates and oxides. In the transitional regime (0.7 ≲ C/O ≲ 0.91), reduced species appear alongside these common phases. At C/O > 0.92, reduced condensates such as TiC(s) and SiC(s) dominate the high-temperature chemistry, with a corresponding reduction in silicate and oxide stability.
This classification aligns with the regime boundaries of Shakespeare et al. (2025), who distinguish silicate-dominant, intermediate, and carbide-dominant systems in a dynamic disk framework. Our results demonstrate that these compositional regimes can also be reproduced with equilibrium condensation alone. Transitions between them are fundamentally controlled by the disk’s oxygen budget relative to other elements (Figure 2).
Adams & Lodders (2025) investigated presolar grain formation in AGB outflows of carbon stars, focusing on how carbon chemistry governs the condensation of TiC(s), C(s), and SiC(s). In their models, where C/O > 1, graphite condenses over ~2200–1100 K through pathways such as
![Mathematical equation: $\[\mathrm{C}_{(\mathrm{g})} \rightarrow \mathrm{C}_{(\mathrm{s})}\]$](/articles/aa/full_html/2026/05/aa58126-25/aa58126-25-eq46.png) (29)
(29)
and
![Mathematical equation: $\[\mathrm{C}_2 \mathrm{H}_{2(\mathrm{g})} \rightarrow 2 \mathrm{C}_{(\mathrm{s})}+\mathrm{H}_{2(\mathrm{g})},\]$](/articles/aa/full_html/2026/05/aa58126-25/aa58126-25-eq47.png) (30)
(30)
thus enabling it to condense up to very high temperatures (2200 K). In contrast, in our stellar sample with C/O < 1, graphite does not condense via these mechanisms, since nearly all carbon remains locked in CO(g), and the partial pressures of C(g) and C2H2(g) are negligible. Therefore, graphite condenses only by reaction 21 at modest temperatures (~1000 K at 10−4 bar).
Their results and those reported here both emphasise that, in addition to C/O, total pressure regulates gas chemistry. This regulation is non-linear: not all condensation temperatures (![Mathematical equation: $\[T_{c}^{50 \%}\]$](/articles/aa/full_html/2026/05/aa58126-25/aa58126-25-eq48.png) ) simply shift uniformly with pressure (as expected from Dalton’s law and the Clausius-Clapeyron equation), but are mediated by specific gas-phase reactions. Notably, increasing pressure stabilises CH4(g) relative to CO(g), suppressing the formation of SiC(s) and C(s) (Section 3.3). This mechanistic link explains the findings of Bond et al. (2010), who noted that even moderately carbon-rich systems (e.g., GI777, C/O = 0.78) develop carbon-dominated chemistries when modelled at very low pressure (10−5 bar). Together, these insights highlight that while C/O is the primary control on condensation regimes, pressure and metallicity exert important influences on the stability and abundance of condensates.
) simply shift uniformly with pressure (as expected from Dalton’s law and the Clausius-Clapeyron equation), but are mediated by specific gas-phase reactions. Notably, increasing pressure stabilises CH4(g) relative to CO(g), suppressing the formation of SiC(s) and C(s) (Section 3.3). This mechanistic link explains the findings of Bond et al. (2010), who noted that even moderately carbon-rich systems (e.g., GI777, C/O = 0.78) develop carbon-dominated chemistries when modelled at very low pressure (10−5 bar). Together, these insights highlight that while C/O is the primary control on condensation regimes, pressure and metallicity exert important influences on the stability and abundance of condensates.
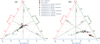 |
Fig. 12 Ternary diagram (a) Mg-Fe-Si (mol %) and (b) Mg-Fe-O displaying high C/O stars and modelled planet(esimal)s. The Sun (Lodders 2003), Earth (Fischer et al. 2020), and Mars (Yoshizaki & McDonough 2020) are included for reference. |
Bulk composition (wt %) of planet(esimal)s forming at T0 = 1150 K from an Earth-sized feeding zone (σ = 225 K) for systems Lodders03 (C/O = 0.50), HD 94151 (C/O = 0.89), and HD 24633 (C/O = 0.95).
4.2 Star-planet chemical connection: refractory and volatile elements
Our results show that condensation temperatures derived for the solar nebula are not reliable proxies for element volatility in non-solar-like systems, consistent with the conclusions of Timmermann et al. (2023) and the recent work of Spaargaren et al. (2025). As shown in Table 1, solar-like sequences yield single, well-defined ![Mathematical equation: $\[T_{c}^{50 \%}\]$](/articles/aa/full_html/2026/05/aa58126-25/aa58126-25-eq49.png) values for most elements (except O, see below), whereas transitional and reduced sequences often result in condensation and re-evaporation phenomena, making the definition of a single
values for most elements (except O, see below), whereas transitional and reduced sequences often result in condensation and re-evaporation phenomena, making the definition of a single ![Mathematical equation: $\[T_{c}^{50 \%}\]$](/articles/aa/full_html/2026/05/aa58126-25/aa58126-25-eq50.png) for a given element a poor descriptor of its volatility (e.g., S, C, and Mg). Moreover, while the
for a given element a poor descriptor of its volatility (e.g., S, C, and Mg). Moreover, while the ![Mathematical equation: $\[T_{c}^{50 \%}\]$](/articles/aa/full_html/2026/05/aa58126-25/aa58126-25-eq51.png) of major rock-forming elements such as Mg, Ca, and Al decreases with increasing C/O, metallic elements such as Fe and Ni are comparatively insensitive, except where they are sequestered into silicides. Reduced phases, including TiC(s) and TiN(s), render Ti, C, and N more refractory.
of major rock-forming elements such as Mg, Ca, and Al decreases with increasing C/O, metallic elements such as Fe and Ni are comparatively insensitive, except where they are sequestered into silicides. Reduced phases, including TiC(s) and TiN(s), render Ti, C, and N more refractory.
Another simplification arises from the assumption that refractory element ratios (Fe/Si, Mg/Si) in planets reflect those of their host stars (Thiabaud et al. 2015; Jorge et al. 2022). While this 1:1 correspondence holds in solar-like disks where refractory species condense fully at high temperature (Moriarty et al. 2014), our models show significant divergence in transitional and reduced sequences. As illustrated in Figure 12, planetary Fe/Si and Mg/Si ratios deviate strongly from stellar values at higher T0, converging only at lower T0.
A similar increase in Fe/O with increasing condensation temperature is also seen in Jorge et al. (2022). In their case, however, the enrichment primarily reflects the intrinsically higher refractory nature of Fe relative to O, assuming in situ planetesimal formation without radial mixing. If material in their disk were radially mixed over a finite feeding zone, this local Fe enrichment would be averaged out. In contrast, in our reduced and high C/O sequences, the condensation of oxygen-bearing minerals is delayed to significantly lower temperatures. As a result, even with radial mixing, Fe-rich solids are incorporated before substantial oxide and silicate condensation, amplifying Fe/O variability with T0. Because the T0 of a given exoplanet cannot be predicted a priori, this adds a degree of freedom to the inference of planetary compositions from stellar abundances alone. Moreover, there is no mandate that the C/O ratio of the region of the disk from which the planet formed reflects that of the bulk star, as evidenced by the variety in the chemistry of chondritic meteorites and, in particular, the enstatite chondrites (Keil 1968; Ebel & Alexander 2011). Consequently, using host-star compositions as direct proxies for planetary compositions is tenuous.
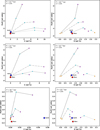 |
Fig. 13 Planetary C (wt %) and S (wt %) against stellar Fe/O wt % ratio for disk pressures of 10−6 bar (top), 10−4 bar (middle), and 10−2 bar (bottom). The Sun (Lodders 2003), Earth (Fischer et al. 2020), and Mars (Yoshizaki & McDonough 2020) are included for reference. |
4.3 Implications for bulk planet compositions
Since our study does not explicitly adopt a physical disk model (see Section 4.5 for further information), direct comparison with previous works, such as Bond et al. (2010), Moriarty et al. (2014), Shakespeare et al. (2025), and Spaargaren et al. (2025) is limited. However, a common outcome across these studies is the predicted compositional gradient from silicate-dominated to carbon-enriched or carbide-dominated planet(esimal)s as a function of increasing disk C/O ratio. In our dataset, the highest C/O value is associated with the star HD 24633 (C/O = 0.95). At σ = 225 K, the planetesimal formed at T0 = 900 K in this system exhibits the highest carbon abundance, with carbon reaching nearly 10 wt %, a value consistent with the predictions of Bond et al. (2010) reporting carbon enrichment of up to 9.8 wt % for planet forming in disks with C/O between 0.8 and 1.
Shakespeare et al. (2025) further emphasised that planetesimal compositions in high C/O disks are more sensitive to their orbital location than those in lower C/O environments. This sensitivity is echoed in our results: as shown in Section 3.4, the variation in bulk composition as a function of T0 is modest (≤4 wt %) in solar-like sequences. However, in transitional and reduced regimes, particularly for major rock-forming elements such as Fe, Si, Mg, and O, this variability increases significantly depending on T0 (Figure 11).
In solar-like systems, sulfur condenses below 700 K; hence its abundance in planet(esimal)s is strongly dependent on T0, and coincides with the temperature at which already condensed iron is oxidised from metal alloy to form troilite and fayalite, meaning that the S mole fraction in the bulk condensate is anti-correlated with T0 (see also Sossi et al. 2025). On the other hand, C and S are present at all T0 in these high C/O systems (Figure 13), suggesting that even planet(esimal)s forming closer to the host star can acquire substantial volatile inventories, a result that departs from expectations based on solar-nebula analogues.
Spaargaren et al. (2025) use the devolatilisation trend defined for the Earth-Sun (Wang et al. 2019a) to deduce distinct planetary populations. Compared to their host star abundances, planets formed in disks with C/O > 1.04 are depleted in Mg (i.e., Mgplanet/Mgstar < 1), those between 0.84-1.04 are depleted in both Mg and Si, whereas broadly solar-like sequences with C/O ≤ 0.84 have planets with roughly solar (stellar) Fe, Mg, and Si relative abundances. Compared to the approach of Spaargaren et al. (2025) that uses ![Mathematical equation: $\[T_{c}^{50 \%}\]$](/articles/aa/full_html/2026/05/aa58126-25/aa58126-25-eq52.png) and thus cannot accurately account for the abundances of O, C, and S in accreting material, we modify the value of T0. Consequently, we find that in reduced disks, a large range of planetary compositions can also form as a function of T0 in a single system of fixed C/O. For example, Figure 11b,c shows Mg- and Si-depleted planets at high T0, contrasting with planets that have Mg, Fe, and Si in the same relative abundances as those in the star at T0 of 650 K.
and thus cannot accurately account for the abundances of O, C, and S in accreting material, we modify the value of T0. Consequently, we find that in reduced disks, a large range of planetary compositions can also form as a function of T0 in a single system of fixed C/O. For example, Figure 11b,c shows Mg- and Si-depleted planets at high T0, contrasting with planets that have Mg, Fe, and Si in the same relative abundances as those in the star at T0 of 650 K.
Although we do not model this explicitly, it is worth noting that pressure and temperature are not static parameters and evolve both radially and temporally. Radially, both temperature and pressure decrease with distance from the central star, following approximate power laws in viscously heated regions and shallower gradients in irradiation-dominated outer regions (Moriarty et al. 2014; Shakespeare et al. 2025). Qualitatively, because P and T are positively correlated in viscous disks (Dullemond & Monnier 2010; Bitsch et al. 2015), the condensation temperatures of most metals will increase relative to C (whose condensation in graphite and SiC is not favoured at higher P due to the stability of CH4(g) relative to CO(g)). As a result, condensation at small heliocentric distances where P is high may result in sulfur and metal-rich planets with only modest carbon contents, despite the high C/O ratios in exoplanetary systems whose planets orbit close to their host star, presuming they formed in situ (i.e., in the absence of Type I migration). Such chemically driven enrichment of metallic compounds provides a natural pathway toward forming planets with large core-mass fractions, characteristic of the growing population of Super-Mercuries inferred from mass-radius measurements (Adibekyan et al. 2021). In this context, Mah & Bitsch (2023) demonstrated that variations in stellar Mg/Si ratio can similarly promote iron-rich pebbles and the formation of Mercury-like planets. Our results extend this chemical framework by showing that super-Mercuries may also arise in high C/O environments.
Temporally, as the disk cools and accretion slows, the P–T conditions at any given radial location decline, shifting condensation fronts inwards and altering the stability of key condensates (Bond et al. 2010). Under such conditions, C condensation reactions are promoted relative to those of metals at lower total pressures (ref. Section 3.3). The carbon enrichment in these systems arises through equilibrium condensation during nebular cooling. Our results show that bulk compositions enriched in C, S, and N are produced in otherwise oxidised planet(esimal)s in transitional and reduced systems, specifically for formation temperatures below ~900 K (Figure 11). This mechanism is fundamentally distinct from the carbon-rich ‘soot-planet’ scenario proposed by Li et al. (2026), which has been put forward as an alternative explanation for the observed population of low-density sub-Neptunes in place of commonly assumed H2-He envelopes (Owen & Wu 2017). Their scenario proposes carbon enrichment through inheritance and survival of interstellar organic material (CHON-rich dust), largely independent of the disk C/O ratio. Planet(esimal)s forming at later, cooler stages of disk evolution in C/O-rich systems may, therefore, give rise to comparatively C- and S-rich planets relative to their solar system counterparts. Quantifying the extent to which such compositional differences influence planetary bulk density will require dedicated mass-radius modelling tailored to these compositions.
4.4 Planetary differentiation
The partitioning behaviour of elements in planetary interiors is governed by a combination of the system’s oxygen budget (and bulk composition more broadly), the intrinsic chemical potentials of the stable compounds of each of the elements (broadly classified as lithophile, chalcophile, or siderophile), and the thermodynamic stability of phases at the relevant P − T conditions. As noted in Sossi et al. (2019), the generalised order of oxygen consumption follows the sequence: Ca > Al > Mg > Si > Fe. Thermodynamic modelling by Unterborn et al. (2014) suggests that, across a wide range of pressures and temperatures relevant to planetary interiors, iron oxidises preferentially before carbon. However, subsequent experimental work paints a more equivocal picture, with C solubility in the metallic phase indicated to strongly (Fischer et al. 2020) or modestly (Blanchard et al. 2022) decline with increasing pressure up to ~70 GPa, and potentially with H content of the system (Gaillard et al. 2022). Consequently, the precise C budget of terrestrial planetary cores remains poorly constrained.
Planetary oxidation state can be crudely estimated by its Figure C.11, the (O − Mg − 2Si)/Fe ratio (Wang et al. 2022). For nearly all planet(esimal)s examined in our study, this value is negative, indicating that even Si remains partially in its metallic form in most cases, with the extreme case of a planetesimal formed in system HD 24633 at high To = 1400 K having about 96% of Si unoxidised. In practice, this result is unlikely to hold because, for compositions in which there is sufficient O to produce SiO2-rich mantles, its dissolution into metallic iron proceeds as
![Mathematical equation: $\[\mathrm{SiO}_{2(\mathrm{l})}+2 \mathrm{Fe}_{(\mathrm{l})}=\mathrm{Si}_{(\mathrm{l})}+2 \mathrm{FeO}_{(\mathrm{l})},\]$](/articles/aa/full_html/2026/05/aa58126-25/aa58126-25-eq53.png) (31)
(31)
thus leading to a self-limiting process in which the increasing FeO activity in the mantle stifles further partitioning of Si into the core, particularly at high pressure and temperature (Gessmann et al. 2001; Rubie et al. 2011; Siebert et al. 2013). However, in many reduced sequences, Si is already present in reduced form (as is Fe), meaning these planets cannot undergo auto-oxidation as implied by Equation (31). Moreover, the incorporation of oxygen into the cores of the terrestrial planets occurs by dissociation of FeO into Fe and O (O’Neill et al. 1998), the progress of which is again limited by the paucity of FeO in reduced bulk compositions. Consequently, the cores of reduced planet(esimal)s will be massive (i.e., the core mass fraction is high) and rich in Si while being poor in O. A feature common to all sequences is that only planet(esimal)s formed at lower T0 display more oxidised compositions similar to solar-like planet(esimal)s, as expected given the convergence of fO2 (Figure 2). These results imply that, for the majority of planet(esimal)s modelled here with T0 > 400 K, both Fe and C are expected to remain in reduced form, with very low activity in the silicate portion of the planet. However, the metallic core may not be a single, homogeneous phase, because experimental studies have highlighted that light elements influence phase equilibria:
Fe–S–Si system: a liquid–liquid immiscibility gap between S-rich and Si-rich melts has been reported up to ~12 GPa, above which it is expected to close (Sanloup & Fei 2004; Siebert et al. 2004; Morard et al. 2008; Tateno et al. 2018).
Fe–C–S system: sulfide-carbide immiscibility is observed, with the gap closing near ~5.5 GPa (Corgne et al. 2008). Ternary experiments up to ~6 GPa further show that the solubility of C in Fe-rich melts decreases with added S, and that immiscible Fe-carbide-rich and Fe-sulfide-rich liquids can coexist. Above ~5–6 GPa, however, C and S become mutually soluble, suppressing super-liquidus immiscibility in volatile-rich systems (Sanloup & Fei 2004).
It is important to note that most of these experimental constraints were obtained under conditions approximating terrestrial fO2. In contrast, the highly reducing, volatile-rich environments expected in some exoplanetary systems may significantly alter light-element solubility ranges, shifting miscibility boundaries, or generating new phase regimes. Dedicated high-pressure experiments at low fO2 are therefore essential to constrain stable phase assemblages, as well as C, S, and Si partitioning during core formation in such planetary contexts. Beyond experimental constraints, additional modelling developments are required to translate bulk composition and core-mantle differentiation outcomes into observable planetary properties. In particular, robust equations-of-state are necessary to model planetary interiors self-consistently and to reliably predict the degree to which variation in mineralogy affects the mass-radius relationship for comparison with observed exoplanets (Unterborn et al. 2016; Baumeister et al. 2025). Finally, coupling interior and differentiation models with atmospheric evolution and degassing models will be required to predict the composition of secondary atmospheres expected from such reducing interiors, enabling direct comparison with current and future observations (Bower et al. 2025).
4.5 Limitations and outlook
While we restrict this study to FGK dwarfs (with Teff > 5000 K), it is important to consider how such compositional diversity may extend to cooler stars, particularly M dwarfs, which are favourable targets for exoplanet detection via transit and radial-velocity techniques (Nutzman & Charbonneau 2008; Trifonov et al. 2018). However, reliable elemental abundance determinations for M dwarfs remain challenging due to their faintness and strong molecular line blending (Reiners et al. 2018). Recent comparative analyses have nevertheless shown that abundance trends of major rock-forming elements in M dwarfs may differ systematically from those of GK dwarfs, suggesting that scaling M-dwarf abundances from GK-dwarf trends is not preferred (Wang et al. 2024). Ongoing improvements in atomic and molecular line lists, atmospheric modelling (Hejazi et al. 2024; Olander et al. 2025), and emerging data-driven approaches based on large spectroscopic surveys (Behmard et al. 2025) are expected to significantly improve abundance constraints, making it feasible to translate the implications of this work to the M-dwarf regime.
A key assumption made in this study is that the system attains thermodynamic equilibrium at any P − T, thereby neglecting reaction kinetics, metastable phases, or the dynamical temporal evolution of the disk. This choice is motivated by both scope and tractability. Our framework isolates the first-order chemical controls, notably the C/O ratio, pressure, and metallicity, on condensation without combining them with dynamical transport effects. Imposing thermodynamic equilibrium also provides a direct means of comparison with the classical solar condensation sequence (Grossman 1972; Lodders 2003). More realistic models might consider the intrinsic kinetic inhibition to the progress of condensation reactions that become more marked down-temperature (Fegley 2000) and lead to mineralogies distinct from those predicted at equilibrium (Charnoz et al. 2026). The chemical reaction timescale must be shorter than the nebular lifetime (105–107) years. As noted for Equation (19), the reduction of CO(g) to CH4(g) is severely kinetically inhibited over the lifetime of the solar nebula (Lewis & Prinn 1980). The progress of solid-gas reactions is highly sensitive to grain size and temperature, and they often follow a parabolic, diffusion-controlled kinetic rate. For example, the degree of enstatite formation from forsterite (Equation (13)) is expected to be very small during nebular timescales (Imae et al. 1993), whereas sulfidation of iron to troilite (Equation (27)) occurs on laboratory timescales of order 102 years at 700 K and 10−3 bar (Lauretta et al. 1996). Exploring non-equilibrium kinetics for condensates of reduced systems would therefore refine the mapping between stellar abundances and planetary building blocks, and represents an important direction for future work.
In addition, recent work has highlighted the role of grain-scale microphysical processes, showing that the desorption of volatile species can depend sensitively on species-specific binding energies, and grain surface properties. This can allow volatile species to remain adsorbed onto grain surfaces and be released at temperatures that differ from their single equilibrium condensation temperatures, thereby complicating the mapping between disk condensates and the bulk compositions of accreted planet(esimal)s (Tinacci et al. 2023; Boitard-Crépeau et al. 2025). These non-equilibrium processes represent an important direction for future work.
The approach is also constrained by the scope of the FactSage thermochemical database (Bale et al. 2016), which is limited to the species defined as pure phases and a finite set of solid solutions. For example, in the present calculations, iron silicides were treated as pure compounds; incorporating solid solution behaviour could further alter the condensation of elements soluble in these phases.
5 Conclusions
In this study, we modelled condensation sequences across a range of stellar C/O ratios assumed to be representative of primordial protoplanetary disks, focusing on identifying the chemical reactions and redox pathways that govern solid formation. By explicitly including solid solutions and reduced species (silicides, carbides, nitrides, and sulfides), we captured a broader set of condensates relevant to chemically reduced environments than previously considered. Our model also tracked changes in oxygen fugacity, pressure effects, and how variations in model parameters (T0 and σ) of stochastic accretion influence the bulk compositions of planet(esimal)s.
The key findings are as follows:
We define three regimes based on the formation of reduced condensates and their effect on disk chemistry: solar-like (C/O < 0.7), transitional (C/O= 0.7–0.91), and reduced (C/O > 0.92). Each regime exhibits distinct condensation sequences and fO2 evolution with temperature.
Solid solutions and FexSi(s) phases significantly influence the partitioning of Fe and Si between solid and gas, and hence their condensation temperatures relative to solar-like sequences. Relative to earlier studies that neglected these phases, their inclusion at the same C/O ratio suppresses silicate- and SiC formation at high temperatures, especially in reduced systems.
Disk pressures and temperatures both regulate the stability of volatiles and reduced condensates. Higher pressures suppress graphite and SiC condensation due to the increasing stability of CH4(g) relative to CO(g), while sulfide formation is promoted.
With increasing C/O, nebular condensation temperatures of metals (Fe, Ni) remain constant, whereas those of nominally refractory elements that condense into oxides (Al, Ca) decrease. The stability of TiC above C/O > 0.92 causes a sharp increase in its condensation temperature. Both S and particularly C become more refractory (higher condensation temperature) as C/O increases, owing to the stability of (Fe, Mg, Ca)S and graphite.
Owing to the non-negligible fractions of Si, O, C, and S that condense over a wide temperature range without necessarily reaching 50% by mass, the use of
![Mathematical equation: $\[T_{c}^{50 \%}\]$](/articles/aa/full_html/2026/05/aa58126-25/aa58126-25-eq54.png) for determining bulk planetary compositions is limited, particularly in high C/O ratio compositions.
for determining bulk planetary compositions is limited, particularly in high C/O ratio compositions.Planet(esimal)s forming in high C/O environments exhibit substantial variability in Fe/Si, Fe/Mg, Fe/O, and volatile content as a function of T0. At higher T0, compositions are Fe-enriched, consistent with elevated core mass fractions and potential Si partitioning into the core. At lower T0, bulk compositions approach more Earth-like major-element ratios while retaining enhanced volatile inventories. This compositional diversity provides plausible building blocks for metal-enriched super-Mercury analogues and volatile-bearing rocky planets, underscoring the broader range of terrestrial outcomes possible in non-solar disk environments.
By explicitly linking disk redox conditions to planetary bulk composition, this work provides a chemical framework that complements efforts to resolve the mass–radius degeneracy problem. We show that planets forming in low fO2 environments can acquire bulk compositions that diverge systematically from those implied by stellar abundances. Interpreting stellar compositions in a physically meaningful way, therefore, requires accounting for system specifics.
Acknowledgements
This work was supported by the Swiss National Science Foundation (SNSF) through an Eccellenza Professorship (#203668) and the Swiss State Secretariat for Education, Research and Innovation (SERI) under contract No. MB22.00033, a SERI-funded ERC Starting grant “2ATMO” to P.A.S. Parts of this work have been carried out within the framework of the National Centre of Competence in Research (NCCR) PlanetS, supported by the SNSF under grant 51NF40_205606.
References
- Adams, G. M., & Lodders, K. 2025, ApJ, 985, 35 [Google Scholar]
- Adibekyan, V. Z., Sousa, S. G., Santos, N. C., et al. 2012, A&A, 545, A32 [NASA ADS] [CrossRef] [EDP Sciences] [Google Scholar]
- Adibekyan, V., Santos, N. C., Dorn, C., et al. 2021, Commun. Byurakan Astrophys. Observ., 68, 447 [NASA ADS] [CrossRef] [Google Scholar]
- Alexander, C. M. O. 2019, Geochim. Cosmochim. Acta, 254, 277 [CrossRef] [Google Scholar]
- Asplund, M., Amarsi, A. M., & Grevesse, N. 2021, A&A, 653, A141 [NASA ADS] [CrossRef] [EDP Sciences] [Google Scholar]
- Bale, C. W., Bélisle, E., Chartrand, P., et al. 2016, Calphad: Computer Coupling of Phase Diagrams and Thermochemistry, 54, 35 [Google Scholar]
- Baumeister, P., Miozzi, F., Guimond, C. M., et al. 2025, Space Sci. Rev., 221, 123 [Google Scholar]
- Behmard, A., Ness, M. K., Casey, A. R., et al. 2025, ApJ, 982, 13 [Google Scholar]
- Bitsch, B., Lambrechts, M., & Johansen, A. 2015, A&A, 582, A112 [NASA ADS] [CrossRef] [EDP Sciences] [Google Scholar]
- Blanchard, I., Rubie, D. C., Jennings, E. S., et al. 2022, Earth Planet. Sci. Lett., 580, 117374 [Google Scholar]
- Boitard-Crépeau, L., Ceccarelli, C., Beck, P., Vacher, L., & Ugliengo, P. 2025, ApJ, 987, L25 [Google Scholar]
- Bond, J. C., O’Brien, D. P., & Lauretta, D. S. 2010, ApJ, 715, 1050 [Google Scholar]
- Bower, D. J., Thompson, M. A., Hakim, K., Tian, M., & Sossi, P. A. 2025, ApJ, 995, 59 [Google Scholar]
- Braukmüller, N., Wombacher, F., Hezel, D. C., Escoube, R., & Münker, C. 2018, Geochim. Cosmochim. Acta, 239, 17 [Google Scholar]
- Braukmüller, N., Wombacher, F., Funk, C., & Münker, C. 2019, Nat. Geosci., 12, 564 [CrossRef] [Google Scholar]
- Brewer, J. M., & Fischer, D. A. 2016, ApJ, 831, 20 [CrossRef] [Google Scholar]
- Buder, S., Lind, K., Ness, M. K., et al. 2019, A&A, 624, A19 [NASA ADS] [CrossRef] [EDP Sciences] [Google Scholar]
- Calogero, M. A., Nimmo, F., & Hin, R. C. 2025, Earth Planet. Sci. Lett., 669, 119580 [Google Scholar]
- Charnoz, S., Sossi, P. A., Lee, Y.-N., et al. 2021, Icarus, 364, 114451 [NASA ADS] [CrossRef] [Google Scholar]
- Charnoz, S., Jérôme, A., Chaussidon, M., et al. 2026, Nature, 652, 925 [Google Scholar]
- Christiansen, J. L., McElroy, D. L., Harbut, M., et al. 2025, psj, 6, 186 [Google Scholar]
- Corgne, A., Wood, B. J., & Fei, Y. 2008, Geochim. Cosmochim. Acta, 72, 2409 [Google Scholar]
- Costa Silva, A. R., Delgado Mena, E., & Tsantaki, M. 2020, A&A, 634, A136 [EDP Sciences] [Google Scholar]
- Da Silva, R., Danielski, C., Delgado Mena, E., et al. 2024, A&A, 688, A193 [NASA ADS] [CrossRef] [EDP Sciences] [Google Scholar]
- Delgado Mena, E., Tsantaki, M., Adibekyan, V. Z., et al. 2017, A&A, 606, A94 [NASA ADS] [CrossRef] [EDP Sciences] [Google Scholar]
- Delgado Mena, E., Adibekyan, V., Santos, N. C., et al. 2021, A&A, 655, A99 [NASA ADS] [CrossRef] [EDP Sciences] [Google Scholar]
- Dorn, C., Khan, A., Heng, K., et al. 2015, A&A, 577, A83 [NASA ADS] [CrossRef] [EDP Sciences] [Google Scholar]
- Dullemond, C. P., & Monnier, J. D. 2010, ARA&A, 48, 205 [NASA ADS] [CrossRef] [Google Scholar]
- Ebel, D. S., & Alexander, C. M. 2011, Planet. Space Sci., 59, 1888 [Google Scholar]
- Fegley, B. 2000, Space Sci. Rev., 92, 177 [NASA ADS] [CrossRef] [Google Scholar]
- Fischer, R. A., Cottrell, E., Hauri, E., Lee, K. K. M., & Le Voyer, M. 2020, Proc. Natl. Acad. Sci., 117, 8743 [Google Scholar]
- Fortney, J. J. 2012, ApJ, 747, L27 [NASA ADS] [CrossRef] [Google Scholar]
- Gaillard, F., Malavergne, V., Bouhifd, M. A., & Rogerie, G. 2022, Earth Planet. Sci. Lett., 577, 117266 [Google Scholar]
- Gessmann, C., Wood, B., Rubie, D., & Kilburn, M. 2001, Earth Planet. Sci. Lett., 184, 367 [CrossRef] [Google Scholar]
- Grossman, L. 1972, Geochim. Cosmochim. Acta, 36, 597 [NASA ADS] [CrossRef] [Google Scholar]
- Guimond, C. M., Wang, H., Seidler, F., et al. 2024, Rev. Mineral. Geochem., 90, 259 [Google Scholar]
- Harrison, J. H. D., Bonsor, A., & Madhusudhan, N. 2018, MNRAS, 479, 3814 [NASA ADS] [CrossRef] [Google Scholar]
- Hejazi, N., Crossfield, I. J. M., Souto, D., et al. 2024, ApJ, 973, 31 [Google Scholar]
- Hinkel, N. R., & Unterborn, C. T. 2018, ApJ, 853, 83 [NASA ADS] [CrossRef] [Google Scholar]
- Hinkel, N. R., Timmes, F. X., Young, P. A., Pagano, M. D., & Turnbull, M. C. 2014, AJ, 148, 54 [NASA ADS] [CrossRef] [Google Scholar]
- Hinkel, N. R., Youngblood, A., & Soares-Furtado, M. 2024, Rev. Mineral. Geochem., 90, 1 [Google Scholar]
- Imae, N., Tsuchiyama, A., & Kitamura, M. 1993, Earth Planet. Sci. Lett., 118, 21 [Google Scholar]
- Jorge, D. M., Kamp, I. E. E., Waters, L. B. F. M., Woitke, P., & Spaargaren, R. J. 2022, A&A, 660, A85 [NASA ADS] [CrossRef] [EDP Sciences] [Google Scholar]
- Kargel, J., & Lewis, J. 1993, Icarus, 105, 1 [Google Scholar]
- Keil, K. 1968, J. Geophys. Res., 73, 6945 [NASA ADS] [CrossRef] [Google Scholar]
- Khan, A., & Connolly, J. A. 2008, J. Geophys. Res., 113, E7 [Google Scholar]
- Khan, A., Sossi, P. A., Liebske, C., Rivoldini, A., & Giardini, D. 2022, Earth Planet. Sci. Lett., 578, 117330 [CrossRef] [Google Scholar]
- Larimer, J. W. 1967, Geochim. Cosmochim. Acta, 31, 1215 [NASA ADS] [CrossRef] [Google Scholar]
- Larimer, J. W. 1975, Geochim. Cosmochim. Acta, 39, 389 [Google Scholar]
- Larimer, J. W., & Bartholomay, M. 1979, Geochim. Cosmochim. Acta, 43, 1455 [Google Scholar]
- Lauretta, D. S., Kremser, D. T., & Fegley, Jr., B. 1996, Icarus, 122, 288 [Google Scholar]
- Lewis, J. S. 1972, Icarus, 16, 241 [Google Scholar]
- Lewis, J. S., & Prinn, R. G. 1980, ApJ, 238, 357 [NASA ADS] [CrossRef] [Google Scholar]
- Li, J., Bergin, E. A., Hirschmann, M. M., et al. 2026, ApJ, 997, L29 [Google Scholar]
- Lodders, K. 2003, ApJ, 591, 1220 [Google Scholar]
- Lodders, K. 2021, Space Sci. Rev., 217, 44 [NASA ADS] [CrossRef] [Google Scholar]
- Lodders, K., Fegley, B., Mezger, K., & Ebel, D. 2025, Space Sci. Rev., 221, 54 [Google Scholar]
- Luck, R. E. 2017, AJ, 153, 21 [Google Scholar]
- Luck, R. E. 2018, AJ, 155, 111 [Google Scholar]
- Magrini, L., Vincenzo, F., Randich, S., et al. 2018, A&A, 618, A102 [NASA ADS] [CrossRef] [EDP Sciences] [Google Scholar]
- Mah, J., & Bitsch, B. 2023, A&A, 673, A17 [NASA ADS] [CrossRef] [EDP Sciences] [Google Scholar]
- McDonough, W. F., & Sun, S.-S. 1995, Chem. Geol., 120, 223 [Google Scholar]
- Mokhtari, M., & Bourdon, B. 2025, Icarus, 444, 116801 [Google Scholar]
- Morard, G., Sanloup, C., Guillot, B., et al. 2008, J. Geophys. Res., 113, B10 [Google Scholar]
- Moriarty, J., Madhusudhan, N., & Fischer, D. 2014, ApJ, 787, 81 [NASA ADS] [CrossRef] [Google Scholar]
- Nellis, W. J. 2002, in High Pressure Phenomena (Oxford: IOS Press), 607 [Google Scholar]
- Nicholls, D. C., Sutherland, R. S., Dopita, M. A., Kewley, L. J., & Groves, B. A. 2017, MNRAS, 466, 4403 [Google Scholar]
- Nissen, P. E. 2013, A&A, 552, A73 [NASA ADS] [CrossRef] [EDP Sciences] [Google Scholar]
- Nutzman, P., & Charbonneau, D. 2008, Design Considerations for a Ground-Based Transit Search for Habitable Planets Orbiting M Dwarfs, Technical Report, Harvard-Smithsonian Center for Astrophysics, 60 Garden St., Cambridge, MA 02138 [Google Scholar]
- Olander, T., Gent, M. R., Heiter, U., et al. 2025, A&A, 696, A62 [NASA ADS] [CrossRef] [EDP Sciences] [Google Scholar]
- O’Neill, H. S. C., Canil, D., & Rubie, D. C. 1998, J. Geophys. Res., 103, 12239 [Google Scholar]
- O’Neill, H. S. C., & Pownceby, M. I. 1993, Contrib. Mineral. Petrol., 114, 296 [Google Scholar]
- Owen, J. E., & Wu, Y. 2017, ApJ, 847, 29 [Google Scholar]
- O’Neill, H. S. C., & Palme, H. 1998, in The Earth’s mantle: Composition, Structure, and Evolution (Cambridge: Cambridge University Press), 3 [Google Scholar]
- Palme, H., & O’Neill, H. 2014, in Treatise on Geochemistry (Amsterdam: Elsevier), 1 [Google Scholar]
- Palme, H., Lodders, K., & Jones, A. 2014, in Treatise on Geochemistry, ed. A. M. Davis (Amsterdam: Elsevier), 2, 15 [Google Scholar]
- Pignatari, M., Trueman, T. C. L., Womack, K. A., et al. 2023, MNRAS, 524, 6295 [Google Scholar]
- Reiners, A., Zechmeister, M., Caballero, J. A., et al. 2018, A&A, 612, A49 [NASA ADS] [CrossRef] [EDP Sciences] [Google Scholar]
- Ringwood, A. 1966, Geochim. Cosmochim. Acta, 30, 41 [Google Scholar]
- Rubie, D. C., Frost, D. J., Mann, U., et al. 2011, Earth Planet. Sci. Lett., 301, 31 [CrossRef] [Google Scholar]
- Sanloup, C., & Fei, Y. 2004, Phys. Earth Planet. Interiors, 147, 57 [Google Scholar]
- Seager, S., Kuchner, M., Hier-Majumder, C. A., & Militzer, B. 2007, ApJ, 669, 1279 [NASA ADS] [CrossRef] [Google Scholar]
- Shakespeare, C. J., Li, M., Huang, S., Zhu, Z., & Steffen, J. H. 2025, AJ, 169, 180 [Google Scholar]
- Siebert, J., Malavergne, V., Guyot, F., Combes, R., & Martinez, I. 2004, Phys. Earth Planet. Interiors, 143, 433 [Google Scholar]
- Siebert, J., Badro, J., Antonangeli, D., & Ryerson, F. J. 2013, Science, 339, 1194 [Google Scholar]
- Sossi, P. A., Klemme, S., O’Neill, H. S., Berndt, J., & Moynier, F. 2019, Geochim. Cosmochim. Acta, 260, 204 [NASA ADS] [CrossRef] [Google Scholar]
- Sossi, P. A., Stotz, I. L., Jacobson, S. A., Morbidelli, A., & O’Neill, H. S. C. 2022, Nat. Astron., 6, 951 [NASA ADS] [CrossRef] [Google Scholar]
- Sossi, P. A., Hin, R. C., Kleine, T., Morbidelli, A., & Nimmo, F. 2025, Space Sci. Rev., 221, 118 [Google Scholar]
- Spaargaren, R. J., Wang, H. S., Mojzsis, S. J., Ballmer, M. D., & Tackley, P. J. 2023, ApJ, 948, 53 [CrossRef] [Google Scholar]
- Spaargaren, R. J., Herbort, O., Wang, H. S., Mojzsis, S. J., & Sossi, P. 2025, A&A, 703, A218 [NASA ADS] [CrossRef] [EDP Sciences] [Google Scholar]
- Stevenson, D. J. 2002, in High Pressure Phenomena (Oxford: IOS Press), 587 [Google Scholar]
- Tateno, S., Hirose, K., Sinmyo, R., et al. 2018, Am. Mineral., 103, 742 [Google Scholar]
- Thiabaud, A., Marboeuf, U., Alibert, Y., Leya, I., & Mezger, K. 2015, A&A, 580, A30 [NASA ADS] [CrossRef] [EDP Sciences] [Google Scholar]
- Timmermann, A., Shan, Y., Reiners, A., & Pack, A. 2023, A&A, 676, A52 [NASA ADS] [CrossRef] [EDP Sciences] [Google Scholar]
- Tinacci, L., Germain, A., Pantaleone, S., et al. 2023, ApJ, 951, 32 [CrossRef] [Google Scholar]
- Trifonov, T., Kürster, M., Zechmeister, M., et al. 2018, A&A, 609, A117 [NASA ADS] [CrossRef] [EDP Sciences] [Google Scholar]
- Unterborn, C. T., Kabbes, J. E., Pigott, J. S., Reaman, D. M., & Panero, W. R. 2014, ApJ, 793, 124 [Google Scholar]
- Unterborn, C. T., Dismukes, E. E., & Panero, W. R. 2016, ApJ, 819, 32 [Google Scholar]
- Wang, H. S., Lineweaver, C. H., & Ireland, T. R. 2018, Icarus, 299, 460 [CrossRef] [Google Scholar]
- Wang, H. S., Lineweaver, C. H., & Ireland, T. R. 2019a, Icarus, 328, 287 [Google Scholar]
- Wang, H. S., Liu, F., Ireland, T. R., et al. 2019b, MNRAS, 482, 2222 [Google Scholar]
- Wang, H. S., Quanz, S. P., Yong, D., et al. 2022, MNRAS, 513, 5829 [NASA ADS] [Google Scholar]
- Wang, H. S., Quanz, S. P., Mahadevan, S., & Deal, M. 2024, A&A, 688, A225 [NASA ADS] [CrossRef] [EDP Sciences] [Google Scholar]
- Yoshizaki, T., & McDonough, W. F. 2020, Geochim. Cosmochim. Acta, 273, 137 [NASA ADS] [CrossRef] [Google Scholar]
- Zeng, L., Sasselov, D. D., & Jacobsen, S. B. 2016, ApJ, 819, 127 [Google Scholar]
Appendix A Stellar abundance dataset
Several abundance measurement studies (for e.g., Luck (2018) and Luck (2017)), which constitute databases like Hypatia Catalogue (Hinkel et al. 2014) show systematic biases in the abundances of a few elements, including [Si/H] and [S/H], such that they have higher abundance with lower effective temperature (Figure A.1). These biases may arise from strong line blending and inadequate log g values for stars at cooler temperatures (Adibekyan et al. 2012).
In this study, we adopt elemental abundances of FGK dwarfs from the Portugal Group Dataset (Adibekyan et al. 2012; Delgado Mena et al. 2017; Costa Silva et al. 2020; Delgado Mena et al. 2021), which correct these systematic trends for various elements. The corrections were applied by fitting a cubic polynomial and adding a constant term such that the correction is zero at solar temperature (Adibekyan et al. 2012).
Additionally, recent studies have highlighted errors in the calculation of oxygen abundances in stellar photospheres derived from the forbidden oxygen line at 6300 Å, which can lead to the overestimation of C/O ratios (Nissen 2013; Fortney 2012). To address this, we use carbon abundances derived from the lines at 5052 Å and 5390 Å. For oxygen, we use abundances derived from the O I line at 6158 Å, which provides a more conservative estimate compared to the forbidden line at 6300 Å (Delgado Mena et al. 2021). Furthermore, we adopt a conservative approach by modelling only systems with C/O < 1, ensuring that our analysis focuses on systems where oxygen dominates over carbon in the gas phase.
 |
Fig. A.1 Elemental abundance vs Teff (K) for FGK dwarf stars from Luck (2017) and Luck (2018) |
Elemental abundances (number fractions, mol %) for the PGD stellar sample used in this study.
Appendix B Chemical species included from FactSage
Ideal gas species used in equilibrium calculations.
Solid solutions used in equilibrium calculations.
Solid solutions used in equilibrium calculations.
Pure solid species used in equilibrium calculations.
Appendix C Supplementary figures
The figures in this appendix support and extend specific results from Sects. 3.2–3.4.
Appendix C.1 Supplementary plots corresponding to Section 3.2
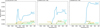 |
Fig. C.1 Solid solution of olivine and feldspar at a disk pressure of 10−4 bar. |
 |
Fig. C.2 Solid solution components of (Ca, Mg)S(s) at a disk pressure of 10−4 bar. |
 |
Fig. C.3 50% condensation temperatures of systems HD94151 and HD24633 shown for condensation calculations with and without solid solutions. |
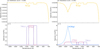 |
Fig. C.4 Comparison of nitrogen-bearing species in transitional (HD94151; C/O= 0.89) and reduced (HD24633; C/O= 0.95) environments at 10−4 bar. The upper panels show N2(g); the lower panels display condensed TiN(s) and TiC(s), with HCN(g) additionally present in the reduced model. The opposing trends of TiN(s) and TiC(s) reflect the conversion between these condensates. |
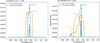 |
Fig. C.5 Condensation curve for FeSi, Fe3Si, and SiC in systems HD 24633 and HD 94151 to compare the stability of SiC with and without iron silicides in condensation calculations. |
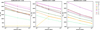 |
Fig. C.6 Condensation temperatures ( |
![Mathematical equation: $\[T_{c}^{50 \%}\]$](/articles/aa/full_html/2026/05/aa58126-25/aa58126-25-eq55.png)
Appendix C.2 Supplementary plots corresponding to Section 3.3
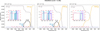 |
Fig. C.7 Stability of carbon-bearing phases in system HD24633 (C/O = 0.95) at different pressures. |
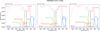 |
Fig. C.8 Stability of sulfur-bearing phases in system HD24633 (C/O = 0.95) at different pressures. |
Appendix C.3 Supplementary plots corresponding to Section 3.4
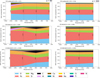 |
Fig. C.9 Same as Figure 11, but for σ = 50 (left column) and σ = 300 (right column). The vertical dashed lines indicate the T0 values adopted in the accretion calculations. |
Figure C.10 illustrates that the stars exhibit a wide variation in the Ca/Al ratios, which is proportionally reflected in the resultant planet(esimal)s, with (Ca/Al)star being approximately proportional to (Ca/Al)planet. On average, the Ca/Al ratio is 0.79 ± 0.16 for stars and 0.72 ± 0.17 for planet(esimal)s. Within a given system, the Ca/Al ratio remains relatively constant but increases at lower T0. Notably, the Ca/Al ratio of planet(esimal)s aligns with the stellar ratio at formation temperatures between 650 K and 900 K. Sodium, as a moderately volatile element, is significantly depleted at higher T0 values. This trend is consistent for both the solar-like systems and high C/O ratio systems.
Figure C.11(a) illustrates the (O − Mg − 2 * Si)/Fe ratio for planet(esimal)s as a function of the stellar C/O ratio. In the Lodders03 system (C/O = 0.50), this ratio shows a subtle increase with higher T0, indicating that oxygen availability increases at higher T0. This trend reflects the oxygen-rich nature of solar-like systems, where Fe is predominantly oxidised, and the condensation sequence favours the incorporation of oxygen into silicates and oxides. In contrast, high C/O systems (HD 94151 with C/O = 0.89 and HD 24633 with C/O = 0.95) exhibit a reverse trend, with the ratio decreasing at higher T0. The spread in values also correlates with the C/O ratio, with high C/O systems showing a broader range of (O − Mg − 2 * Si)/Fe ratios, reflecting greater variability in their oxidation states.
Figure C.11(b) showing the O/(N + C + Fe + Ni + S) ratio, further highlights the differences between these systems. In the Lodders03 system, oxygen remains relatively abundant, with the ratio exceeding 3 even at high T0. This abundance ensures that Fe and other rock-forming elements are largely oxidised, resulting in smaller metallic cores. In high C/O systems, however, the oxygen availability decreases significantly with increasing C/O ratio, dropping below 2 at higher T0.
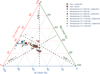 |
Fig. C.10 Ternary diagram Ca-Al-Na (mol %) displaying high C/O stars and modelled planet(esimal)s. The Sun (Lodders 2003), Earth (Fischer et al. 2020), and Mars (Yoshizaki & McDonough 2020) are shown for reference. |
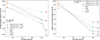 |
Fig. C.11 (a) Factor (O − Mg − 2Si)/Fe for planet(esimal)s (mol%) and (b) Factor O/(N + C + Fe + Ni + S) for planet(esimal)s (mol%) against C/O ratio of the star for disk pressure of 10−4 bar and σ = 225 K. |
All Tables
Instantaneous fraction condensed (fc) and condensation temperatures (T) for solar-like (Lodders03; C/O= 0.50), transitional (HD 94151; C/O= 0.89), and reduced (HD 24633; C/O= 0.95) systems, calculated at disk pressure of 10−4 bar.
Condensation temperatures, (K) for elements in solar-like (Lodders03; C/O= 0.50), transitional (HD 94151; C/O= 0.89), and reduced (HD 24633; C/O= 0.95) systems at three different disk pressures.
Bulk composition (wt %) of planet(esimal)s forming at T0 = 1150 K from an Earth-sized feeding zone (σ = 225 K) for systems Lodders03 (C/O = 0.50), HD 94151 (C/O = 0.89), and HD 24633 (C/O = 0.95).
Elemental abundances (number fractions, mol %) for the PGD stellar sample used in this study.
All Figures
|
Fig. 1 Distribution of our adopted dataset of elemental abundances of Sun-like stars (FGK dwarfs) on the [Fe/H]-C/O diagram. A sample of stars selected for this study is highlighted in red. The solar reference (Lodders 2003) is indicated by a star marker. The typical error bars for the dataset in the [Fe/H] - C/O plane are shown in the upper right corner. |
| In the text | |
|
Fig. 2 Variation in oxygen fugacity with respect to the iron–wüstite buffer (ΔIW) as a function of disk mid-plane temperature for three representative cases: Lodders03 (solar-like sequence), HD 94151 (transitional sequence), and HD 24633 systems (reduced sequence). |
| In the text | |
|
Fig. 3 Instantaneous fraction condensed (fc) of each element as a function of temperature in solar-like (Lodders 03; C/O= 0.50), transitional (HD 94151; C/O= 0.89), and reduced (HD 24633; C/O= 0.95) systems at 10−4 bar total pressure (for the relevant reactions corresponding to the condensation peaks, see Sects. 3.2.1–3.2.5). |
| In the text | |
|
Fig. 4 Condensation of (refractory) oxides (Al, Ca, Ti, O ± Mg, Fe, Cr, Ni) in solar-like (Lodders03; C/O= 0.50), transitional (HD 94151; C/O= 0.89), and reduced (HD 24633; C/O= 0.95) systems at a disk pressure of 10−4 bar. Species marked with an asterisk (*) are treated as solid solution phases in the calculations. |
| In the text | |
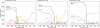 |
Fig. 5 Same as Figure 4, but for condensation of major silicate phases. |
| In the text | |
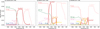 |
Fig. 6 Same as Figure 4, but for condensation of major metal and silicide phases. |
| In the text | |
|
Fig. 7 Same as Figure 4, but for condensation of carbide and nitride phases. The inset shows the minor C-bearing phases on a log scale. |
| In the text | |
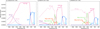 |
Fig. 8 Same as Figure 4, but for condensation of sulfide phases. |
| In the text | |
|
Fig. 9 Stability of carbon-bearing phases in system HD 94151 at pressures of (a) 10−6bar, (b) 10−4bar, and (c) 10−2bar. |
| In the text | |
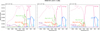 |
Fig. 10 Same as Figure 9, but for condensation of sulfide phases. |
| In the text | |
|
Fig. 11 Bulk composition of accreted planet(esimal)s at various T0 marked as dotted lines, with a feeding zone of 225 K around Lodders 03 (a), around HD 94151 (b), and around HD 24633 (c). |
| In the text | |
|
Fig. 12 Ternary diagram (a) Mg-Fe-Si (mol %) and (b) Mg-Fe-O displaying high C/O stars and modelled planet(esimal)s. The Sun (Lodders 2003), Earth (Fischer et al. 2020), and Mars (Yoshizaki & McDonough 2020) are included for reference. |
| In the text | |
|
Fig. 13 Planetary C (wt %) and S (wt %) against stellar Fe/O wt % ratio for disk pressures of 10−6 bar (top), 10−4 bar (middle), and 10−2 bar (bottom). The Sun (Lodders 2003), Earth (Fischer et al. 2020), and Mars (Yoshizaki & McDonough 2020) are included for reference. |
| In the text | |
|
Fig. A.1 Elemental abundance vs Teff (K) for FGK dwarf stars from Luck (2017) and Luck (2018) |
| In the text | |
|
Fig. C.1 Solid solution of olivine and feldspar at a disk pressure of 10−4 bar. |
| In the text | |
|
Fig. C.2 Solid solution components of (Ca, Mg)S(s) at a disk pressure of 10−4 bar. |
| In the text | |
|
Fig. C.3 50% condensation temperatures of systems HD94151 and HD24633 shown for condensation calculations with and without solid solutions. |
| In the text | |
|
Fig. C.4 Comparison of nitrogen-bearing species in transitional (HD94151; C/O= 0.89) and reduced (HD24633; C/O= 0.95) environments at 10−4 bar. The upper panels show N2(g); the lower panels display condensed TiN(s) and TiC(s), with HCN(g) additionally present in the reduced model. The opposing trends of TiN(s) and TiC(s) reflect the conversion between these condensates. |
| In the text | |
|
Fig. C.5 Condensation curve for FeSi, Fe3Si, and SiC in systems HD 24633 and HD 94151 to compare the stability of SiC with and without iron silicides in condensation calculations. |
| In the text | |
|
Fig. C.6 Condensation temperatures ( |
| In the text | |
|
Fig. C.7 Stability of carbon-bearing phases in system HD24633 (C/O = 0.95) at different pressures. |
| In the text | |
|
Fig. C.8 Stability of sulfur-bearing phases in system HD24633 (C/O = 0.95) at different pressures. |
| In the text | |
|
Fig. C.9 Same as Figure 11, but for σ = 50 (left column) and σ = 300 (right column). The vertical dashed lines indicate the T0 values adopted in the accretion calculations. |
| In the text | |
|
Fig. C.10 Ternary diagram Ca-Al-Na (mol %) displaying high C/O stars and modelled planet(esimal)s. The Sun (Lodders 2003), Earth (Fischer et al. 2020), and Mars (Yoshizaki & McDonough 2020) are shown for reference. |
| In the text | |
|
Fig. C.11 (a) Factor (O − Mg − 2Si)/Fe for planet(esimal)s (mol%) and (b) Factor O/(N + C + Fe + Ni + S) for planet(esimal)s (mol%) against C/O ratio of the star for disk pressure of 10−4 bar and σ = 225 K. |
| In the text | |
Current usage metrics show cumulative count of Article Views (full-text article views including HTML views, PDF and ePub downloads, according to the available data) and Abstracts Views on Vision4Press platform.
Data correspond to usage on the plateform after 2015. The current usage metrics is available 48-96 hours after online publication and is updated daily on week days.
Initial download of the metrics may take a while.