| Issue |
A&A
Volume 699, July 2025
|
|
|---|---|---|
| Article Number | L11 | |
| Number of page(s) | 8 | |
| Section | Letters to the Editor | |
| DOI | https://doi.org/10.1051/0004-6361/202555635 | |
| Published online | 24 July 2025 | |
Letter to the Editor
The CHIMERA Survey: The first CO detection in Leo T, the lowest mass known galaxy still hosting cold molecular gas
1
Departamento de Astronomía, Universidad de Concepción, Avenida Esteban Iturra s/n, Casilla 160-C, Concepción, Chile
2
Vicerrectoría de Investigación y Postgrado, Universidad de La Serena, La Serena 1700000, Chile
3
Department of Astronomy, University of Maryland, College Park, MD 20742, USA
4
Departamento de Astronomía, Universidad de Chile, Casilla 36-D, Santiago, Chile
5
Space Telescope Science Institute, 3700 San Martin Drive, Baltimore, MD 21218, USA
6
Max-Planck-Institut für extraterrestrische Physik, Gießenbachstraße 1, D-85748 Garching bei München, Germany
7
Universitäts-Sternwarte, Fakultät für Physik, Ludwig-Maximilians-Universität München, Scheinerstraße 1, D-81679 München, Germany
8
Excellence Cluster ORIGINS, Boltzmannstr 2, D-85748 Garching bei München, Germany
9
Instituto de Astrofísica e Ciências do Españo, Universidade do Porto, CAUP, Rua das Estrelas, 4150-762 Porto, Portugal
10
Department of Physics, University of Surrey, Guildford GU2 7XH, UK
11
Instituto de Astrofísica, Pontificia Universidad Católica de Chile, Vicuña Mackenna 4860, 7820436 Macul, Santiago, Chile
12
Departamento de Astronomía, Facultad de Ciencias, Universidad de La Serena. Av. Raul Bitran 1305, La Serena, Chile
13
Max-Planck-Institut für Astrophysik, Karl-Schwarzschild-Straße 1, 85748 Garching, Germany
14
Instituto de Alta Investigación, Universidad de Tarapacá, Casilla 7D, Arica, Chile
15
Millennium Nucleus for Galaxies (MINGAL), Chile
16
Departamento de Física e Astronomía, Faculdade de Ciências, Universidade do Porto, Rua do Campo Alegre 687, PT4169-007 Porto, Portugal
⋆⋆ Corresponding authors: vvillanueva@astro-udec.cl; matias.blana.astronomy@gmail.com
Received:
22
May
2025
Accepted:
1
July
2025
We report the first CO detection in Leo T, representing the most extreme observation of carbon monoxide molecules in the lowest stellar mass gas-rich dwarf galaxy (M⋆ ∼ 105 M⊙) known to date. We acquired and present new Atacama Compact Array (ACA) 12CO(J = 1–0) data within our CHIMERA Survey project for the central region of Leo T, a metal-poor ([M/H] ∼ −1.7) dwarf in the Milky Way (MW) outskirts. We identified three compact molecular clouds (< 13 pc) with estimated upper limit virial masses of Mmol ∼ 5 × 10³ M⊙ each and a total of 1.4 ± 0.4 × 10⁴ M⊙, corresponding to ∼3% of the total gas mass. We obtained CO-to-H2 conversion factors (αCO) as high as ∼ 155 M⊙(K km s−1 pc2)−1 and mean molecular gas surface densities of Σmol ∼ 9 M⊙ pc−2 that are consistent with values found in dwarf galaxies with extremely low metal content. All CO clouds are shifted (∼60 pc) from the stellar population centers, and only one cloud appears within the densest HI region. Two clouds have velocity offsets with the HI of Δvlos ∼ + 13 km s−1 being within twice the velocity dispersion (Δvlos/σHI, los ∼ 2) and probably bound. However, the northern cloud is faster (Δvlos ∼ + 57 km s−1); our models with low halo masses (Mh ≲ 109 M⊙) result in unbound orbits, suggesting that this material is likely being expelled from the dwarf, providing evidence for molecular gas depletion. These properties reveal a perturbed dynamics intertwined with star formation processes in low-mass dwarf galaxies, supporting a scenario of episodic bursts until they are fully quenched by the MW environment.
Key words: galaxies: dwarf / galaxies: evolution / galaxies: ISM / Local Group
© The Authors 2025
 Open Access article, published by EDP Sciences, under the terms of the Creative Commons Attribution License (https://creativecommons.org/licenses/by/4.0), which permits unrestricted use, distribution, and reproduction in any medium, provided the original work is properly cited.
This article is published in open access under the Subscribe to Open model. Subscribe to A&A to support open access publication.
1. Introduction
Dwarf galaxies are the building blocks of massive galaxies and the most abundant galaxy type, and where feedback processes can have very strong effects because of their shallow gravitational potentials. They have stellar masses below M⋆ ≲ 109 M⊙ and dark-matter halos masses within Mh ≲ 1011 M⊙ (e.g. Revaz et al. 2018; Collins & Read 2022). The smallest dwarfs, which probably inhabit halos within Mh ≲ 109 M⊙ (Read et al. 2006a; Rey et al. 2022; Kim et al. 2024; Rey et al. 2025), struggle to hold onto their ISM (Appendix H) material after a starburst, driving metal expulsion, and even self-quenching (Agertz et al. 2020; Gray et al. 2025). For dwarfs, the environment also plays a key role. They can lose material or even accrete gas from the IGM and CGM (Appendix H) as they move through these media (Ricotti 2008; Rey et al. 2022). If they fall into massive host galaxies or clusters, they can have their ISM stripped away (e.g. Mori & Burkert 2000; Gatto et al. 2013; Emerick et al. 2016) or experience tidal mass stripping (e.g. Read et al. 2006b; Fellhauer et al. 2007; Smith et al. 2013; Blaña et al. 2015). Furthermore, the metal-poor ISM environments in dwarf galaxies are extreme laboratories to probe the limits of the molecular cloud scaling relations (e.g. Bolatto et al. 2008; Wong et al. 2011; Rubio et al. 2015; Filho et al. 2016), and as proxies for high-redshift studies. Gas-rich dwarf galaxies have very low metallicities and yet have high star formation efficiencies in very compact molecular clouds, such as in the dwarf galaxy WLM Appendix H that has dense CO cloud cores detected with ALMA Appendix H (Rubio et al. 2015). In addition, CO emission in metal-poor ISMs can change the traceability of the molecular gas, resulting in conversion factors that are much higher than in massive galaxies (Bolatto et al. 2013).
In this Letter we present new ACA 12CO(J = 1–0) line emission data in Leo T as part of the CHIMERA survey. This dwarf has a low luminosity (MV = −8.0 mag; Irwin et al. 2007; de Jong et al. 2008) (−7.60 ± 0.14 mag; Muñoz et al. 2018), a stellar mass of M⋆ ∼ 1.4 × 10⁵ M⊙ (Weisz et al. 2012; Zoutendijk et al. 2021), and is extremely metal-poor with [M/H] ∼ −1.7 (Weisz et al. 2012, HST-WFPC2), or [Fe/H] = −1.53 ± 0.05, σFe/H = 0.21 (Vaz et al. 2023, MUSE). It is currently in the outskirts of the MW ( ; Clementini et al. 2012), although it is unclear whether it is on its first in-fall or second (i.e., backsplash galaxy; Blaña et al. 2020, hereafter B20; McConnachie et al. 2021). This dwarf is HI gas rich (Ryan-Weber et al. 2008) with the atomic gas dominating the baryonic budget with MHI + He ∼ 5.2 × 10⁵ M⊙ (Adams & Oosterloo 2018, hereafter AO18). Although no massive young stars have been detected in Leo T, observational evidence suggests recent star formation episodes (< 200 Myr, de Jong et al. 2008; Vaz et al. 2023). However, it is unclear whether this galaxy will undergo another star formation event or if it has already stopped forming new stars and is transitioning into a quenched dwarf spheroidal (dSph) galaxy as it sinks into the MW. The massive HI reservoir means that the production of m. gas that fuels star formation is a feasible scenario, although until now no CO detections have been reported that could confirm the presence of H2. Here we present the first detection candidates of CO in Leo T.
2. Observational data and products
We used ACA to obtain new CO(J = 1–0) data in Leo T during the ALMA Cycle 11 program 2024.1.00951.S (P.I. V. Villanueva) within the CHIMERA survey (Co H2-Ism Molecular gas ExploRAtion). This pilot survey aims at conducting a detailed study of the ISM of galaxies at the low-mass (M⋆ ≲ 107 M⊙) and metal-poor ([Z/H] < −1]) regimes. CO observations were taken on January 24, 2025, in three execution blocks, spending a total of ∼126 minutes on-source. The galaxy was observed with a single pointing using the 7 m ACA configuration, with a field of view (FoV) of ∼2.2 × 2.2 arcmin2. We set a spectral bandwidth of ≈117 MHz (centered at 115.257 GHz), and a raw spectral resolution of ∼0.12 MHz ≈0.32 km s−1. The scheduling blocks were designed to detect the CO(1–0) emission line down to an rms ∼12 mJy/beam at 3 km s−1 channel width.
Our ALMA data were calibrated by the observatory pipeline (Hunter et al. 2023, version 2024.1.0.8). Both calibration and imaging used CASA 6.6.1.17 (Bean 2022). Briefly, the pipeline combined all the uv data for the given target on a common spectral grid, subtracted the continuum emission, and then carried out a deconvolution. The last included a cleaning procedure using the task tclean, which was set to stop at 6000 iterations or when a threshold of 10 mJy was reached. The cleaning routine considered a Briggs weighting (robust = 0.5; Briggs 1995), with a good compromise between the synthesized beam and the signal-to-noise ratio (S/N). This yielded a CO data cube with a beam size θmin × θmaj = 9.″45 × 13.″18 (position angle PA = −75°), a channel width of 0.62 km s−1, and a median rms ∼20 mJy beam−1 (for more details, see Appendix A). The resulting angular resolution allowed us to recover physical scales of ∼26 pc, with a conversion of 1 [arcsec] = 1.98 pc at Leo T distance.
3. Results and discussion
Figure 1 shows the CO detections of three molecular clouds; the black contours in the intensity maps are the 4.5, 5.5, and 6.5σ levels, providing detection reliability. To confirm this, we also performed a statistical analysis of the peak S/N per spaxel in the CO field, resulting in the S/N distribution shown in Fig. B.1. The spaxels within the detected regions correspond to the red, green and blue bars, which refer to those within the north, west, and south CO clouds; they are well characterized by the highest S/N values of the distribution (≳4.5 − 6.0). The limited angular resolution of the CO(1–0) data does not allow us to fully resolve the sources. When fitting the emission by a 2D Gaussian function, we find full width at half maxima of FWHMCO ∼ 10″–14″, which are similar to the beam major axis. We adopted these values to define the physical sizes of the CO structures assuming that they have a spherical shape with a radius  FWHMCO. We adopted rCO to set a circular aperture and extract the main molecular cloud physical properties (which should be considered as upper limits); they are reported in Table C.1.
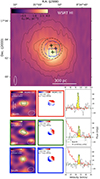 |
Fig. 1. Top panel: atomic gas surface density map derived from the HI data (Adams & Oosterloo 2018). The black-dashed circle marks the ACA CO(1–0) data FoV. Each square marks a cloud detection region: north (red), west (green), and south (blue). The old and younger stellar population distributions are shown with red and light blue circles (corresponding to their respective half-light radii of 145 pc and 102 pc de Jong et al. 2008). Bottom nine subpanels: zoomed-in images of the ACA CO emission maps (MOM0), velocity fields (MOM1), and spectra of the three CO clouds identified in this work. The spectra are taken within the apertures shown by the green dashed circles in the MOM0 panels (i.e., rCO in Table C.1). The CO and HI spectra are in heliocentric frame (rightmost subpanels). The beam sizes are the white ellipses. |
We obtained the luminosity of the CO(1–0) line by integrating both its emission within rCO (dashed green circles in bottom left panels of Fig. 1), and in the velocity range defined in Appendix A (yellow areas in spectra of Fig. 1). Then we used Eq. (1) from Solomon & Vanden Bout (2005), after replacing the relevant terms with those of the CO(1–0) emission line; we obtained  , where SCOΔv is the integrated flux density (in Jy km s−1), and DLeoT is the distance to Leo T (in Mpc). We find LCO values in the range of ∼32–43 and K km s−1 pc2 for the CO clouds (Table C.1). Assuming that the CO spectral distribution is primarily driven by molecular gas motions, we computed the virial mass (Mvir) of each molecular cloud assuming a 1/r density law (MacLaren et al. 1988),
  . Here, we adopted R ≈ rCO and σ ∼ σCO (Table C.1). Upper limit masses of Mmol ∼ 5 × 10³ M⊙ were found for our three CO clouds by adopting Mmol ≈ Mvir (including heavier elements). This adds to a total of Mmol,tot = 1.4 ± 0.4 104 M⊙ and corresponds to 2.6% of the total detected gas (including MHI + He).
Although here we report upper limits, we also compared the main properties of the three clouds with other molecular cloud studies in the literature, and found consistent agreement. Detections of CO structures in metal-poor dwarf galaxies (12+log[O/H] < 8.0) have been previously attempted (e.g., Verter & Hodge 1995; Buyle et al. 2006), but only a handful of cases obtained a proper characterization of the CO clouds. For example, Rubio et al. (2015) reported CO clouds in the extremely metal-poor Local Group dwarf galaxy WLM (12+log[O/H] = 7.8; Lee et al. 2005; Leaman et al. 2012). They show that CO clouds have luminosities, virial masses, and densities of ∼102 K km s−1 pc2, ∼2 × 10³ M⊙, and ∼6–30 M⊙ pc−2, respectively, which are consistent with our results. However, within our resolution, the Leo T clouds appear more extended than in WLM, but consistent within the scatter of the main trends observed in other galaxies, as shown in Fig. D.1. We also placed Leo T in the Kennicutt–Schmidt relation for metal-poor dwarf galaxies, and found a total gas density for each cloud of Σgas ∼ 12 M⊙ pc−2, in agreement with other metal-poor dwarf galaxies (e.g. Filho et al. 2016, log(Σgas/M⊙ pc−2) ≈ 1 ± 1 in their Fig. 1). Nevertheless, Leo T’s current star formation rate (SFR) remains undetermined, where no massive stars, HII regions, or dust have been detected; the with Hα upper limit SFR density estimates of ΣSFR < 10−5 M⊙ yr−1 kpc−2 (Vaz et al. 2023), are much lower than in other dwarfs (log(ΣSFR/M⊙ yr−1 kpc−2) ≈ −3 ± 1, Filho et al. 2016). However, using historic SFRs derived from stellar population models (Weisz et al. 2012) and the observed total cloud areas results in higher values of ΣSFR ∼ 10−3 M⊙ yr−1 kpc−2, which better fits other dwarfs (see discussion in Appendix D). Moreover, SFR could be strongly varying if Leo T has bursty or episodic cycles of active star formation followed by quiescent episodes, as predicted by simulations (e.g. Read et al. 2016), where Leo T would be currently building up a burst of new stars. Figure 1 also shows the central positions of the two main extended stellar populations in Leo T (Irwin et al. 2007; de Jong et al. 2008; Vaz et al. 2023): the old population with ages in the range ∼5–12 Gyr with a mass of  and a half-light radius of rh = 145 pc (red circle in Fig. 1), and the younger population with ages < 1 Gyr,
  and rh = 102 pc (blue circle). The global HI center is close to the old stellar population center; however, the HI peak is shifted to the south by 80 pc (Adams & Oosterloo 2018, see also B20 and Blaña et al. 2024 hereafter B24). Figure1 reveals that the molecular (CO) clouds are spatially shifted from the centers of both stellar distributions and the HI emission peak by ∼100 pc, except for the southern cloud which appears within the dense HI region. Such spatial offsets are observed in other dwarf galaxies such as WLM (Rubio et al. 2015), and usually occur where the HI-to-H2 transition generates a HI cavity when HI reaches a critical density of Σcrit ≳ 10 M⊙ pc−2 (Krumholz et al. 2009; Krumholz 2013). However, here we find values of ⟨ΣHI⟩∼2 − 4 M⊙ pc−2 around the CO cloud locations, and even the maximum in Leo T is 4.9 M⊙ pc−2. Moreover, the observed line-of-sight (los) velocity offsets between the west and south CO clouds with respect to the HI distribution (
 , AO18) are
  km s−1 (Fig. 1). These are within twice the HI velocity dispersion (σHI = 8.3 km s−1; Adams & Oosterloo 2018), suggesting that they are decoupled from the HI, but likely gravitationally bound to the dwarf. Such velocity offsets are not uncommon, as observed in CO clouds in DDO 70 (≲20 km s−1; Shi et al. 2020), and are expected for Leo T’s gas supported by random motions, unlike more massive dwarfs where the gas can be rationally supported.
Furthermore, the spatial and velocity gas offsets in Leo T reveal that its ISM could be perturbed by internal and environmental processes. HST Appendix H observations revealed a population of AGB Appendix H star candidates in Leo T (Weisz et al. 2012), which can have mass outflows of  of slow and cool winds with terminal velocities of w ∼ 3 − 30 km s−1 (Höfner & Olofsson 2018), comparable to the kinematics in Leo T, which could be effectively increased by the AGB stars orbital velocities. Hydro-simulations by B24 show that AGB winds can perturb Leo T’s ISM in low-mass dark-matter halos where the stellar distributions are not fully phase-space mixed. Moreover, dwarfs in cosmological simulations also show offsets between stars and gas (Rey et al. 2022). Therefore, a plausible scenario is that stellar winds may compress HI to reach the critical column density (see Appendix F) and form H2 structures with offset velocities. Interestingly, we note that the molecular clouds appear to be centered around the younger stellar component (Fig. 1), which could be related to this scenario.
However, the north CO cloud velocity offset is ΔυCO−HI = 57.7 ± 0.7 km s−1 (Fig. E.1). Therefore, we estimated whether the cloud could be gravitationally unbound to Leo T. To test this scenario, we performed orbital calculations with the software DELOREAN (B20); with potentials for the stellar, gaseous, and dark matter components, and ram pressure on the cloud from the dwarf’s ISM and the MW’s CGM with parameters from B24. Assuming that the north cloud lies at 60 pc from Leo T’s center and with a speed given only by the los velocity, we can derive a total mass for the dwarf’s halo such that the cloud does not leave the dwarf’s Jacobi radius due to the MW tidal field. We find that orbital models with extended cores require total masses greater than Mh > 2 × 10⁹ M⊙ to remain bound. However, this value can be lower if we consider halos with higher central densities, finding values as low as Mh > 3.5 × 10⁸ M⊙ (model D3 in B24). Moreover, while the Leo T outer layers of less dense HI can be stripped by the CGM (Blaña et al. 2024), we find here that ram pressure only weakly affects the clouds’ orbits due to the low CGM density, the slow clouds’ motions relative to the ISM, and the dense nature of the molecular clouds. Cosmological simulations with dwarf galaxies show that low-mass dwarf galaxies (M⋆ ≲ 106 M⊙) inhabit halos with masses of (1−5) × 109 M⊙ (e.g., Rey et al. 2022, 2025; Gray et al. 2025). Dynamical models fitted to MUSE-Faint survey observations find a total mass range for Leo T of 107.88−9 M⊙ (Zoutendijk et al. 2021), which would allow the north CO cloud to become unbound at the lower end of this mass range. The cloud’s high velocity also suggests that this could belong to foreground MW material. However, this seems unlikely, as we find that the factors αCO would be orders of magnitude higher than typical values for the MW gas (see Appendix G). Therefore, the north cloud kinematics suggest an ongoing expulsion of molecular gas in this low-mass dwarf.
The CO-to-H2 conversion factor (αCO) is a useful metric of the physical conditions of the molecular gas since it has been shown to respond to the total surface density of the environment (e.g., Bolatto et al. 2013) and metallicity (Z; e.g., Amorin et al. 2016; Accurso et al. 2017), among others. Since αCO = Mmol/LCO[M⊙][K km s−1 pc2]−1 (e.g., Leroy et al. 2008), we estimate the cloud αCO (tracing upper limit cloud masses) of CO structures in Leo T using the virial mass and the luminosity of the CO(1–0) line derived above; we find cloud αCO upper-limit values in the range of 107–156 M⊙ (K km s−1 pc2)−1 (see Table C.1). These high values of αCO, while determined with a limiting resolution, are consistent with estimates of the expected dependence on metallicity, which is extremely low in Leo T and with a large spread ([Fe/H] = −1.53 ± 0.05, σ[Fe/H] = 0.21; Vaz et al. 2023). Figure G.1 includes our derived αCO for CO clouds in Leo T with other relevant measurements and models from the literature; however, some estimates use various tracers or methods (for more details, see Appendix G). In this context, Rubio et al. (2015), Shi et al. (2020) found average core αCO values around of ∼30–100 M⊙ (K km s−1 pc2)−1 for the CO clouds identified in the dwarfs WLM and DDO 70, where WLM show an extreme cloud value αCO ∼ 124 M⊙ (K km s−1 pc2)−1 similar to our range.
4. Conclusions
We present the first detection of 12CO(J = 1–0) emission line data in Leo T, a low-mass (M⋆ ∼ 105 M⊙) metal-poor dwarf galaxy in the Local Group. Using new CO data taken with the Atacama Compact Array to trace the H2 content, we investigated the main features and properties of the molecular clouds identified in this work. Our main conclusions are the following:
-
We identified three molecular cloud candidates located in the central region of Leo T. Within the limited angular resolution of the data beam’s semimajor axis of ∼7 arcsec (∼13 pc), we computed upper limits for the main physical properties of the molecular clouds (Table C.1). We find velocity dispersions of ∼0.62 km s−1, which translates into virial masses of Mmol ∼ 5 × 10³ M⊙ for each cloud, resulting in a total mass of Mmol, tot = 1.4 ± 0.4 × 10⁴ M⊙, and mean densities of Σgas ∼ 12 M⊙ pc−2. These results agree with the main properties and scaling relations of molecular (CO) clouds in other low-metallicity dwarf galaxies (see Sects. 3, Appendix D and Fig. D.1).
-
The CO clouds present spatial and velocity offsets from the stellar and HI distributions, indicating an unstable dynamical regime. Two clouds show low velocities and would remain gravitationally bound to Leo T, whereas the larger velocity of the north cloud could be direct evidence of ongoing molecular gas ejection in such low-mass dwarfs. Considering the limited resolution, all CO clouds also show internal rotation.
-
We find upper limits for the CO-to-H2 conversion factor of αCO ∼ 107–156 M⊙ (K km s−1 pc2)−1. These extremely high values are consistent with the very metal-poor nature of Leo T and with values from environments alike in other dwarf galaxies such as WLM, DDO 70, and DDO 154 (see Sects. 3 and Appendix G).
Future projects will provide stringent estimates of the properties of the clouds reported in this Letter, the current star formation in Leo T, and cloud properties in other dwarfs, through high-resolution observations, additional CO J-transitions, and the characterization of these structures in different environments (as a function of stellar mass, metallicity, and radiation field, among others).
Acknowledgments
The authors deeply thank Elizabeth Adams and Tom Oosterloo for making the HI data available. M.B. thanks C.Agurto for helpful discussions. V.V. acknowledges support from the ANID BASAL project FB210003 and from ANID – MILENIO – NCN2024_112. M.R. acknowledges partial support from ANID (CHILE) through Basal FB210003. D.C. acknowledges funding from the Alexander von Humboldt Foundation. This paper uses the ALMA data: ADS/JAO.ALMA #2024.1.00951.S. The Westerbork Synthesis Radio Telescope is operated by ASTRON, the Netherlands Institute for Radio Astronomy, with support from the Netherlands Foundation for Scientific Research (NWO). The authors deeply thank the citizens of Chile for their tax contributions that allow the national development of science and this project.
References
- Accurso, G., Saintonge, A., Catinella, B., et al. 2017, MNRAS, 470, 4750 [NASA ADS] [Google Scholar]
- Adams, E. A. K., & Oosterloo, T. A. 2018, A&A, 612, A26 [NASA ADS] [CrossRef] [EDP Sciences] [Google Scholar]
- Agertz, O., Pontzen, A., Read, J. I., et al. 2020, MNRAS, 491, 1656 [Google Scholar]
- Amorin, R., Muñoz-Tuñón, C., Aguerri, J. A. L., & Planesas, P. 2016, A&A, 588, A23 [NASA ADS] [CrossRef] [EDP Sciences] [Google Scholar]
- Blaña, M., Fellhauer, M., Smith, R., et al. 2015, MNRAS, 446, 144 [Google Scholar]
- Blaña, M., Burkert, A., Fellhauer, M., Schartmann, M., & Alig, C. 2020, MNRAS, 497, 3601 [CrossRef] [Google Scholar]
- Blaña, M., Burkert, A., Fellhauer, M., et al. 2024, A&A, 692, A183 [NASA ADS] [CrossRef] [EDP Sciences] [Google Scholar]
- Bolatto, A. D., Leroy, A. K., Rosolowsky, E., Walter, F., & Blitz, L. 2008, ApJ, 686, 948 [NASA ADS] [CrossRef] [Google Scholar]
- Bolatto, A. D., Wolfire, M., & Leroy, A. K. 2013, ARAA, 51, 207 [Google Scholar]
- Briggs, D. S. 1995, PhD thesis, New Mexico Institute of Mining and Technology [Google Scholar]
- Buyle, P., Michielsen, D., de Rijcke, S., Ott, J., & Dejonghe, H. 2006, MNRAS, 373, 793 [Google Scholar]
- Bean, B. 2022, PASP, 134, 114501 [NASA ADS] [CrossRef] [Google Scholar]
- Clementini, G., Cignoni, M., Ramos, R. C., et al. 2012, ApJ, 756, 108 [NASA ADS] [CrossRef] [Google Scholar]
- Collins, M. L., & Read, J. I. 2022, Nat. Astron., 6, 647 [NASA ADS] [CrossRef] [Google Scholar]
- de Jong, J. T. A., Harris, J., Coleman, M. G., et al. 2008, ApJ, 680, 1112 [NASA ADS] [CrossRef] [Google Scholar]
- Emerick, A., Mac Low, M.-M., Grcevich, J., & Gatto, A. 2016, ApJ, 826, 13 [NASA ADS] [CrossRef] [Google Scholar]
- Feldmann, R., Gnedin, N. Y., & Kravtsov, A. V. 2012, ApJ, 747, 124 [NASA ADS] [CrossRef] [Google Scholar]
- Fellhauer, M., Evans, N. W., Belokurov, V., et al. 2007, MNRAS, 375, 1171 [Google Scholar]
- Filho, M. E., Almeida, J. S., Amorín, R., et al. 2016, ApJ, 820, 109 [NASA ADS] [CrossRef] [Google Scholar]
- Gatto, A., Fraternali, F., Read, J. I., et al. 2013, MNRAS, 433, 2749 [NASA ADS] [CrossRef] [Google Scholar]
- Glover, S. C. O., & Mac Low, M. M. 2011, MNRAS, 412, 337 [NASA ADS] [CrossRef] [Google Scholar]
- Gratier, P., Braine, J., Rodriguez-Fernandez, N. J., et al. 2010, A&A, 512, A68 [NASA ADS] [CrossRef] [EDP Sciences] [Google Scholar]
- Gray, E. I., Read, J. I., Taylor, E., et al. 2025, MNRAS, 539, 1167 [Google Scholar]
- Höfner, S., & Olofsson, H. 2018, AAR, 26, 1 [Google Scholar]
- Hunter, T. R., Indebetouw, R., Brogan, C. L., et al. 2023, Publ. Astron. Soc. Pacific, 135, 074501 [Google Scholar]
- Irwin, M. J., Belokurov, V., Evans, N. W., et al. 2007, ApJ, 656, L13 [NASA ADS] [CrossRef] [Google Scholar]
- Israel, F. P. 1997, A&A, 328, 471 [NASA ADS] [Google Scholar]
- Kim, S. Y., Read, J. I., Rey, M. P., et al. 2024, ArXiv e-prints [arXiv:2408.15214] [Google Scholar]
- Komugi, S., Inaba, M., & Shindou, T. 2023, PASJ, 75, 1337 [Google Scholar]
- Krumholz, M. R. 2013, MNRAS, 436, 2747 [CrossRef] [Google Scholar]
- Krumholz, M. R., McKee, C. F., Tumlinson, J., et al. 2009, ApJ, 693, 216 [NASA ADS] [CrossRef] [Google Scholar]
- Leaman, R., Venn, K. A., Brooks, A. M., et al. 2012, ApJ, 750, 33 [NASA ADS] [CrossRef] [Google Scholar]
- Lee, H., Skillman, E. D., & Venn, K. A. 2005, ApJ, 620, 223 [Google Scholar]
- Leroy, A. K., Evans, A. S., Momjian, E., et al. 2011, ApJ, 739, L25 [NASA ADS] [CrossRef] [Google Scholar]
- Leroy, A. K., Walter, F., Brinks, E., et al. 2008, AJ, 136, 2782 [Google Scholar]
- MacLaren, I., Richardson, K. M., & Wolfendale, A. W. 1988, ApJ, 333, 821 [NASA ADS] [CrossRef] [Google Scholar]
- Madden, S. C., Poglitsch, A., Geis, N., Stacey, G. J., & Townes, C. H. 1997, ApJ, 483, 200 [NASA ADS] [CrossRef] [Google Scholar]
- McConnachie, A. W., Higgs, C. R., Thomas, G. F., et al. 2021, MNRAS, 501, 2363 [NASA ADS] [CrossRef] [Google Scholar]
- Mori, M., & Burkert, A. 2000, ApJ, 538, 559 [Google Scholar]
- Muñoz, R. R., Côté, P., Santana, F. A., et al. 2018, ApJ, 860, 66 [CrossRef] [Google Scholar]
- Narayanan, D., Krumholz, M. R., Ostriker, E. C., & Hernquist, L. 2012, MNRAS, 421, 3127 [NASA ADS] [CrossRef] [Google Scholar]
- Read, J. I., Pontzen, A. P., & Viel, M. 2006a, MNRAS, 371, 885 [Google Scholar]
- Read, J. I., Wilkinson, M. I., Evans, N. W., et al. 2006b, MNRAS, 366, 429 [NASA ADS] [CrossRef] [Google Scholar]
- Read, J. I., Agertz, O., & Collins, M. L. M. 2016, MNRAS, 459, 2573 [NASA ADS] [CrossRef] [Google Scholar]
- Revaz, Y., Jablonka, P., Revaz, Y., & Jablonka, P. 2018, A&A, 616, A96 [NASA ADS] [CrossRef] [EDP Sciences] [Google Scholar]
- Rey, M. P., Pontzen, A., Agertz, O., et al. 2022, MNRAS, 511, 5672 [Google Scholar]
- Rey, M. P., Taylor, E., Gray, E. I., et al. 2025, MNRAS, 541, 1195 [Google Scholar]
- Ricotti, M. 2008, MNRAS, 392, L45 [Google Scholar]
- Rubio, M., Elmegreen, B. G., Hunter, D. A., et al. 2015, Nature, 525, 218 [NASA ADS] [CrossRef] [Google Scholar]
- Ryan-Weber, E. V., Begum, A., Oosterloo, T., et al. 2008, MNRAS, 384, 535 [NASA ADS] [CrossRef] [Google Scholar]
- Sault, R. J., Teuben, P. J., & Wright, M. C. H. 1995, in Astronomical Data Analysis Software and Systems IV, eds. R. A. Shaw, H. E. Payne, & J. J. E. Hayes, ASP Conf. Ser., 77, 433 [Google Scholar]
- Shi, Y., Wang, J., Zhang, Z. Y., et al. 2016, Nat. Commun., 7, 13789 [Google Scholar]
- Shi, Y., Wang, J., Zhang, Z.-Y., et al. 2020, ApJ, 892, 147 [NASA ADS] [CrossRef] [Google Scholar]
- Smith, R., Lane, R. R., Conn, B. C., & Fellhauer, M. 2012, MNRAS, 423, 543 [Google Scholar]
- Smith, R., Fellhauer, M., Candlish, G. N., et al. 2013, MNRAS, 433, 2529 [Google Scholar]
- Solomon, P. M., Rivolo, A. R., Barrett, J., & Yahil, A. 1987, ApJ, 319, 730 [Google Scholar]
- Solomon, P. M., & Vanden Bout, P. A. 2005, ARA&A, 43, 677 [NASA ADS] [CrossRef] [Google Scholar]
- Taylor, C. L., & Klein, U. 2001, A&A, 366, 811 [NASA ADS] [CrossRef] [EDP Sciences] [Google Scholar]
- Toomre, A. 1964, ApJ, 139, 1217 [Google Scholar]
- Vaz, D., Brinchmann, J., Zoutendijk, S. L., et al. 2023, A&A, 678, A59 [NASA ADS] [CrossRef] [EDP Sciences] [Google Scholar]
- Verter, F., & Hodge, P. 1995, ApJ, 446, 616 [Google Scholar]
- Villanueva, V., Bolatto, A. D., Vogel, S. N., et al. 2024, ApJ, 962, 88 [NASA ADS] [CrossRef] [Google Scholar]
- Walter, F., Brinks, E., de Blok, W. J. G., et al. 2008, AJ, 136, 2563 [Google Scholar]
- Weisz, D. R., Zucker, D. B., Dolphin, A. E., et al. 2012, ApJ, 748, 6 [NASA ADS] [CrossRef] [Google Scholar]
- Westmeier, T. 2018, MNRAS, 474, 289 [NASA ADS] [CrossRef] [Google Scholar]
- Wong, T., Hughes, A., Ott, J., et al. 2011, ApJS, 197, 16 [NASA ADS] [CrossRef] [Google Scholar]
- Zoutendijk, S. L., Júlio, M. P., Brinchmann, J., et al. 2021, A&A, submitted [arXiv:2112.09374] [Google Scholar]
Appendix A: ACA-CO(1-0) and WSRT-HI data products
We used the CO (1-0) data cube to obtain the emission line spectrum (see bottom panels of Fig.1), centered at the peak of emission and adopting a circular aperture with radius rapp = rCO = FWHM/2 (see row 3 in Table C). We also computed the best Gaussian fit to the spectrum in the velocity domain (v) to obtain the CO line emission parameters (see the dash-dotted green line in the spectra of the bottom right panels in Fig.1). Using the model Ae−(v − υ)2/2σ2, we find a mean velocities of  97.28±0.62, 53.03±1.04, and 53.37±0.63 km s−1 for the north, west, and south CO clouds, respectively. The best-fit routine also yields velocity dispersions of σCO = 0.59±0.62, 0.63±1.04, and 0.62±0.63 km s−1 for the north, west, and south CO clouds, respectively. We adopted these parameters to derive the CO moment 0 maps (M0; bottom left panels in Fig.1) by collapsing the data cube in the range
 ![$ \rm [\upsilon^{\odot}_{\mathrm{los, CO}}-FWHM, \upsilon^{\odot}_{\mathrm{los, CO}}+FWHM] $](/articles/aa/full_html/2025/07/aa55635-25/aa55635-25-eq11.gif) , where FWHM is the full width at half maximum (FWHM
, where FWHM is the full width at half maximum (FWHM ) in velocity space. Uncertainties (u) of M0s are derived after computing the rms in the signal-free part of the spectra and using
  , where N is the number of channels within the emission and Δv is the channel width (in km s−1). These calculations also considered the accuracy of the flux calibrator (J0854+2006), which is ∼3 mJy. Finally, we compute the moment 1 maps (M1) using Eq. (2) in Villanueva et al. (2024) and blanking the pixels outside the circular aperture at the coordinates of the emission peaks (see Table C.1) of north, west, and south CO clouds in the M0 (see middle row of 9 bottom panels of Fig. 1).
Similarly as described above, we derive the HI moment 0 map by collapsing the HI data cube in the range between [23.45,66.21] km s−1, which corresponds to the spectral range of HI emission line identified by AO18 (see solid red line in bottom left panel of Fig.1). The final version of the HI moment 0 map is included in the top-left panel of Fig.1. A detailed description of the data can be found in Adams & Oosterloo (2018).
We compare our data with HI observations of Leo T taken with the WSRT Sect. H telescope by AO18. The data cube was generated following the standard practice for WSRT data, which consists of calibration and imaging performed on Miriad (Sault et al. 1995); the latter was performed by adopting a weighting parameter robust = 0.4. This procedure produced a data cube with a beam size θmin × θmaj= 15.″7 × 57.″3 (or ∼31 pc × 113 pc using the conversion of 1[arcsec] = 1.98 pc given the distance to Leo T of 409kpc), and a P.A. = 0.1°. The median rms of the data cube is 0.87 mJy beam−1 for the final 0.52 km s−1 channel width.
Appendix B: Identification and significance of the CO(1-0) line detections in Leo T
We performed an identification of cloud-like CO structures in the FoV covered by the ACA-CO(1-0) data presented in this work. To do so, we first compute the root-to-mean square (rms) for all the spaxels within the FoV of the CO(1-0) data. Then, we look for the spaxels that, 1) contain one or more channels with CO emission at least 5 times higher than the rms, and (2) have at least two adjacent spaxels that meet the criteria 1). Selecting spaxels in this way, we identify three regions located in the north, west, and south of the FoV (see top panel of Fig. B.1), which contain 9, 3, and 4 validated spaxels, respectively (red points). The bottom panel of Fig. B.1 shows the distribution of positive and negative peak S/N values per pixel in the ACA-CO(1-0) data. The pixels within the region of the CO detections in Leo T are shown as red, green and blue bins, which are typically well characterized by peak S/N ≳4.0 − 6.0.
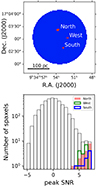 |
Fig. B.1. Top: Field of view explored with ACA and identification of clouds in the ACA CO(1-0) data cube. Spaxels with one or more channels containing intensities with S/N≥5 are colored red, while those without significant emission (0 spaxels) are colored blue. We identify three regions (north, west, south) that include channels with SNR≥5 emissions and also fulfill the requirement of having two or more spaxels meeting the same criteria. Bottom: Histogram of the peak S/N values of the ACA-CO(1-0) data, which resembles a Gaussian distribution (gray). The pixels that are related to the CO detections are identified in the top panel (in addition to all the pixels contained in the aperture of radius rFWHM/2, CO) are shown as red, green, and blue bins, corresponding to the north, west, and south CO clouds, respectively. |
Appendix C: Table with main physical quantities of CO clouds
We show in Table C.1 the main parameters of the CO molecular clouds.
Main physical quantities of the CO clouds in Leo T.
Appendix D: Scaling and star formation relations in Leo T
In Fig.D.1 we show the main properties and scaling relations for the clouds in Leo T and compare them to other galaxies. We find that Leo T clouds have similar luminosities and masses similar to the clouds in the metal-poor Local Group dwarf galaxy WLM Rubio et al. (2015). Furthermore, within our resolution, Leo T clouds appear more extended than in WLM, but consistent within the scatter of the main trends observed in other galaxies that extend between 1 and 100 pc, as shown in Fig. D.1. Similar results are also reported by Shi et al. (2016) and Shi et al. (2020), who identify CO structures star-forming regions from galaxies DDO 70 (or Sextans B; ZSextB ∼ 0.07 × Z⊙), DDO 53 (ZDDO53 ∼ 0.14 × Z⊙), and DDO 50 (ZDDO50 ∼ 0.18 × Z⊙). Interestingly, and similarly to WLM (radii∼1.5-6 pc; Rubio et al. 2015), they also find that CO clumps in DDO 70 can be up to four times larger (radii∼1.5-2.5 pc) than those in typical massive star-forming regions in the MW (∼0.5-1.0 pc for clumps with Σgas ≈ 700 M⊙ pc−2; Shi et al. 2020), suggesting a scenario of suppressed gas fragmentation in the low metallicity regime due to larger Jeans mass, slow cooling, and weak turbulence.
We also place Leo T in the Kennicutt-Schmidt relation. For this we estimated the molecular gas densities for the clouds of Σmol ∼ 9 M⊙ pc−2 (Table C.1). Adding HI and heavier elements result in gas surface mass densities for the North, West and South clouds of Σgas = 11 M⊙ pc−2, 12 M⊙ pc−2, and 12 M⊙ pc−2, respectively. These values agree well with the range found for extremely metal-poor dwarf galaxies (e.g. Filho et al. 2016, see their Fig.1), where the (log) mean values among the clouds are found around ⟨Σgas⟩ ∼ 10[M⊙ pc−1] having a scatter ranging between 3 and 100[M⊙ pc−2]. Furthermore, as these are lower limit densities, future high-resolutions observations could potentially find higher densities. To date, there are only upper limits for the current star formation rate (SFR) in Leo T, where no massive stars, gas-embedded star clusters, HII regions, nor dust have been detected, where we report no detectable cold dust continuum emission in our ACA data for the targeted sensitivities. The analysis of Hα emission maps performed by Vaz et al. (2023) determined upper limits for the SFR densities of ΣSFR < 10−5 M⊙ yr−1kpc−2, being much lower than in other metal-poor dwarfs (Filho et al. 2016) that show clouds with a (log) mean population value around ⟨log(ΣSFR/M⊙ yr−1kpc−2)⟩ ≈ − 3 with a scatter of 1 dex. Moreover, SFR can vary strongly if Leo T has bursty or fast episodic cycles of active star formation followed by quiescent episodes, as simulations have predicted for low-mass dwarfs (e.g. Read et al. 2016), resulting in non-continuous SFR values. Weisz et al. (2012) stellar population models of color-magnitude HST data, result in historic star formation rates of ⟨SFR⟩∼5 × 10⁻⁶ M⊙ yr−1 and even lower in the last 25Myr. Adopting the observed total area of the clouds, would result in a star formation density of ΣSFR ∼ 6 × 10⁻³ M⊙ yr−1kpc−2, which would better agree with the estimates in other dwarfs. Future ALMA and JWST high-resolution observations could potentially reveal dense cores in the centers of the molecular clouds and provide an estimate of the current SFR.
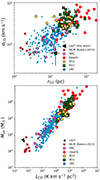 |
Fig. D.1. Main properties of the CO clouds identified in this work. Here are shown the velocity dispersion-size (radius) relation (top panel) and the virial masses vs. CO(1-0) line integrated luminosities (bottom panel). The limited angular resolution of the CO data analyzed here allow us to include only an upper limit for rCO (black triangles-arrows) (see Sect. 2 for more details). The figure also includes results of CO structures detected in other dwarf galaxies: M33 (Bolatto et al. 2008); LMC (Wong et al. 2011); and a compilation from the literature as included in Rubio et al. (2015) corresponding to WLM, SMC, and M31. |
Appendix E: HI and CO north cloud spectra
In Fig.E.1 we show in detail the spectra of the north cloud.
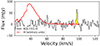 |
Fig. E.1. Average HI spectrum from Adams & Oosterloo (2018) (in rescaled units; red dashed line) and this work’s CO spectrum of the north cloud (gray solid line), with the detected CO peak (yellow area). The velocity offset of the CO emission line peak with respect to the HI peak (∼60 km s−1) suggests the extreme physical conditions that the north cloud is exposed to, which are discussed in Sect. 3. |
Appendix F: Internal stability of the clouds
We also evaluate the internal stability of the clouds, considering resolution limitations, by taking a mean mass density of to estimate the Jeans masses of the clouds of MJ = (5σ2G−1)3/2(4πρ/3)−1/2 ∼ 5.3 × 10³M⊙ ≳ Mmol; which shows that the clouds would be marginally stable. In addition, since we apparently detected internal rotation in the molecular clouds (Fig.1,  ), we estimate the Toomre parameter (Toomre 1964), finding an unstable value QT ≈ (σvcr−1)(πGΣ)−1 < 1. We also find free-fall time scales of
  . Future high-resolution observations will better reveal the internal structures in these clouds.
Appendix G: The CO-to-H2 conversion factor in Leo T and in foreground MW material
We determined the CO(J = 1-0)-to-H2 conversion factor αCO for the three molecular clouds by measuring the dynamical masses and CO luminosities within the circular areas of radius rCO, resulting in upper limits due to resolution limitations. Future follow-up observations could potentially reveal a more compact mass distribution or even a subclump substructure with smaller compact cores (see Fig. D.1). In Figure G.1 we compare the αCO values of the clouds with similar studies, such as Rubio et al. (2015), where they find high values for the WLM galaxy with an average of αCO∼28 M⊙ (K km s−1 pc2)−1 and the highest having αCO∼124 M⊙ (K km s−1 pc2)−1. They suggested that this extreme αCO value may reflect the almost null CO emission for most of the cloud volume filled by H2; this is because CO resides primarily in the densest cores of the H2 clouds. Similar results are also reported by Shi et al. (2016) and Shi et al. (2020), who identify CO structures star-forming regions from galaxies DDO 70 (or Sextans B; ZSextB ∼ 0.07 × Z⊙), DDO 53 (ZDDO53 ∼ 0.14 × Z⊙), and DDO 50 (ZDDO50 ∼ 0.18 × Z⊙). They cover αCO (core and cloud) values in the range between 30 and 120 M⊙ (K km s−1 pc2)−1 for CO clouds identified in the dwarf galaxy DDO 70 (yellow squares in Fig.G.1; Shi et al. 2020). They argue that since αCO increases with decreasing metallicity, in combination with the low metallicities (∼0.07-0.18Z⊙) and the large sizes (1.5-3 pc) of the CO clouds analysed, may result in suppressed gas fragmentation. The latter is a consequence of large clumps not being able to further fragment into small ones due to large Jeans mass and weak turbulence. Moreover, we note that the αCO estimates in Fig.G.1 are calculated using different methodologies and at different scales, with Rubio et al. (2015), Shi et al. (2020) showing αCO values of compact CO cores using a virial estimator similar to our approach used for the Leo’T clouds that could appear more extended clouds due to resolution limitations, while Rubio et al. (2015) also include αCO values estimated with dust to gas ratios. More recently, Komugi et al. (2023) report a weak CO detection in the star-forming regions in DDO 154 (12+log[O/H] = 7.67), estimating a lower limit of αCO ≳ 103 M⊙ (K km s−1 pc2)−1 derived from Hα-based star formation rates (Verter & Hodge 1995; Taylor & Klein 2001). Moreover, using dust continuum data to measure the molecular gas content in DDO 154, they also estimate a cloud αCO factor of at least two orders of magnitude higher than that of the MW (∼4.3 M⊙ [K km s−1 pc2]−1; e.g., Walter et al. 2008).
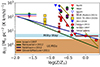 |
Fig. G.1. CO-to-H2 conversion factor (αCO) vs. metallicity, adapted from Bolatto et al. (2013) to include the main properties of the CO clouds in Leo T detected in this work. The αCO estimations (red, green and unfilled-red inverted triangles) correspond to upper limits (see Sect. 3), with uncertainties of the order of ∼24-33%. The figure includes a recompilation of CO structures reported in different galaxy samples: WLM (Rubio et al. 2015); DDO 70 (Shi et al. 2020); DDO 50 and DDO 53 (Shi et al. 2016); local LIRGs and ULIRGs (Leroy et al. 2011); LMC and other magellanic irregular galaxies (Israel 1997); and other local group galaxies (Madden et al. 1997; Gratier et al. 2010; Smith et al. 2012). The figure also contains theoretical models of αCO(Z) from Israel (1997) (yellow line), Narayanan et al. (2012) (green line), Feldmann et al. (2012) (blue line), and Glover & Mac Low (2011) (red line). The light blue and brown areas correspond to the αCO ranges for the MW and ULIRGs recommended by Bolatto et al. (2013). |
Furthermore, in Sect. 3, we mentioned that the ΔυCO−HI = +57.7 ± 0.7 km s−1 offset of the north CO cloud (see Fig.E.1) could also imply that this cloud could belong to MW foreground material where HI transitions to H2. From the HI4PI survey data of Galactic HI emissions (Westmeier 2018), we find heliocentric velocities towards Leo T’s direction of  , which are consistent with the North cloud (
 97 km s−1). Assuming that the north cloud is within the HI MW disk diameter (DHI, MW∼40 kpc; Westmeier 2018), we can compute a new CO luminosity and mass of L′CO=∼0.41 K km s−1 pc2 and M′mol∼460 M⊙ for the north cloud, respectively, yielding an α′CO∼1.12 ×10³ M⊙ pc−2 [K km s−1]−1. However, this value is extremely high compared to the typical αCO values in the MW (Fig.G.1). For example, using the measurements of αCO and CO luminosities in the MW by Solomon et al. (1987), Bolatto et al. (2013) derived the empirical relation αCO = (LCO/105)−0.185. For the new L′CO, this results in a αCO∼10 M⊙ pc−2 [K km s−1]−1, which is two orders of magnitude lower than α′CO. In consequence, the physical quantities of the north cloud are more plausible when we assume that it is located at the distance of Leo T.
Appendix H: List of Abbreviations
AGB: Asymptotics Giant Brach, AGNs: Active Galactic Nuclei, ALMA: Atacama Large Millimeter Array, CASA: Common Astronomy Software Applications, CDM: Cold-Dark-Matter, CGM: circumgalactic medium, IGM: intergalactic medium, ISM: interstellar medium, HST: Hubble Space Telescope, WLM: Wolf–Lundmark–Melotte, WSRT: Westerbork Synthesis Radio Telescope.
All Tables
All Figures
|
Fig. 1. Top panel: atomic gas surface density map derived from the HI data (Adams & Oosterloo 2018). The black-dashed circle marks the ACA CO(1–0) data FoV. Each square marks a cloud detection region: north (red), west (green), and south (blue). The old and younger stellar population distributions are shown with red and light blue circles (corresponding to their respective half-light radii of 145 pc and 102 pc de Jong et al. 2008). Bottom nine subpanels: zoomed-in images of the ACA CO emission maps (MOM0), velocity fields (MOM1), and spectra of the three CO clouds identified in this work. The spectra are taken within the apertures shown by the green dashed circles in the MOM0 panels (i.e., rCO in Table C.1). The CO and HI spectra are in heliocentric frame (rightmost subpanels). The beam sizes are the white ellipses. |
| In the text | |
|
Fig. B.1. Top: Field of view explored with ACA and identification of clouds in the ACA CO(1-0) data cube. Spaxels with one or more channels containing intensities with S/N≥5 are colored red, while those without significant emission (0 spaxels) are colored blue. We identify three regions (north, west, south) that include channels with SNR≥5 emissions and also fulfill the requirement of having two or more spaxels meeting the same criteria. Bottom: Histogram of the peak S/N values of the ACA-CO(1-0) data, which resembles a Gaussian distribution (gray). The pixels that are related to the CO detections are identified in the top panel (in addition to all the pixels contained in the aperture of radius rFWHM/2, CO) are shown as red, green, and blue bins, corresponding to the north, west, and south CO clouds, respectively. |
| In the text | |
|
Fig. D.1. Main properties of the CO clouds identified in this work. Here are shown the velocity dispersion-size (radius) relation (top panel) and the virial masses vs. CO(1-0) line integrated luminosities (bottom panel). The limited angular resolution of the CO data analyzed here allow us to include only an upper limit for rCO (black triangles-arrows) (see Sect. 2 for more details). The figure also includes results of CO structures detected in other dwarf galaxies: M33 (Bolatto et al. 2008); LMC (Wong et al. 2011); and a compilation from the literature as included in Rubio et al. (2015) corresponding to WLM, SMC, and M31. |
| In the text | |
|
Fig. E.1. Average HI spectrum from Adams & Oosterloo (2018) (in rescaled units; red dashed line) and this work’s CO spectrum of the north cloud (gray solid line), with the detected CO peak (yellow area). The velocity offset of the CO emission line peak with respect to the HI peak (∼60 km s−1) suggests the extreme physical conditions that the north cloud is exposed to, which are discussed in Sect. 3. |
| In the text | |
|
Fig. G.1. CO-to-H2 conversion factor (αCO) vs. metallicity, adapted from Bolatto et al. (2013) to include the main properties of the CO clouds in Leo T detected in this work. The αCO estimations (red, green and unfilled-red inverted triangles) correspond to upper limits (see Sect. 3), with uncertainties of the order of ∼24-33%. The figure includes a recompilation of CO structures reported in different galaxy samples: WLM (Rubio et al. 2015); DDO 70 (Shi et al. 2020); DDO 50 and DDO 53 (Shi et al. 2016); local LIRGs and ULIRGs (Leroy et al. 2011); LMC and other magellanic irregular galaxies (Israel 1997); and other local group galaxies (Madden et al. 1997; Gratier et al. 2010; Smith et al. 2012). The figure also contains theoretical models of αCO(Z) from Israel (1997) (yellow line), Narayanan et al. (2012) (green line), Feldmann et al. (2012) (blue line), and Glover & Mac Low (2011) (red line). The light blue and brown areas correspond to the αCO ranges for the MW and ULIRGs recommended by Bolatto et al. (2013). |
| In the text | |
Current usage metrics show cumulative count of Article Views (full-text article views including HTML views, PDF and ePub downloads, according to the available data) and Abstracts Views on Vision4Press platform.
Data correspond to usage on the plateform after 2015. The current usage metrics is available 48-96 hours after online publication and is updated daily on week days.
Initial download of the metrics may take a while.