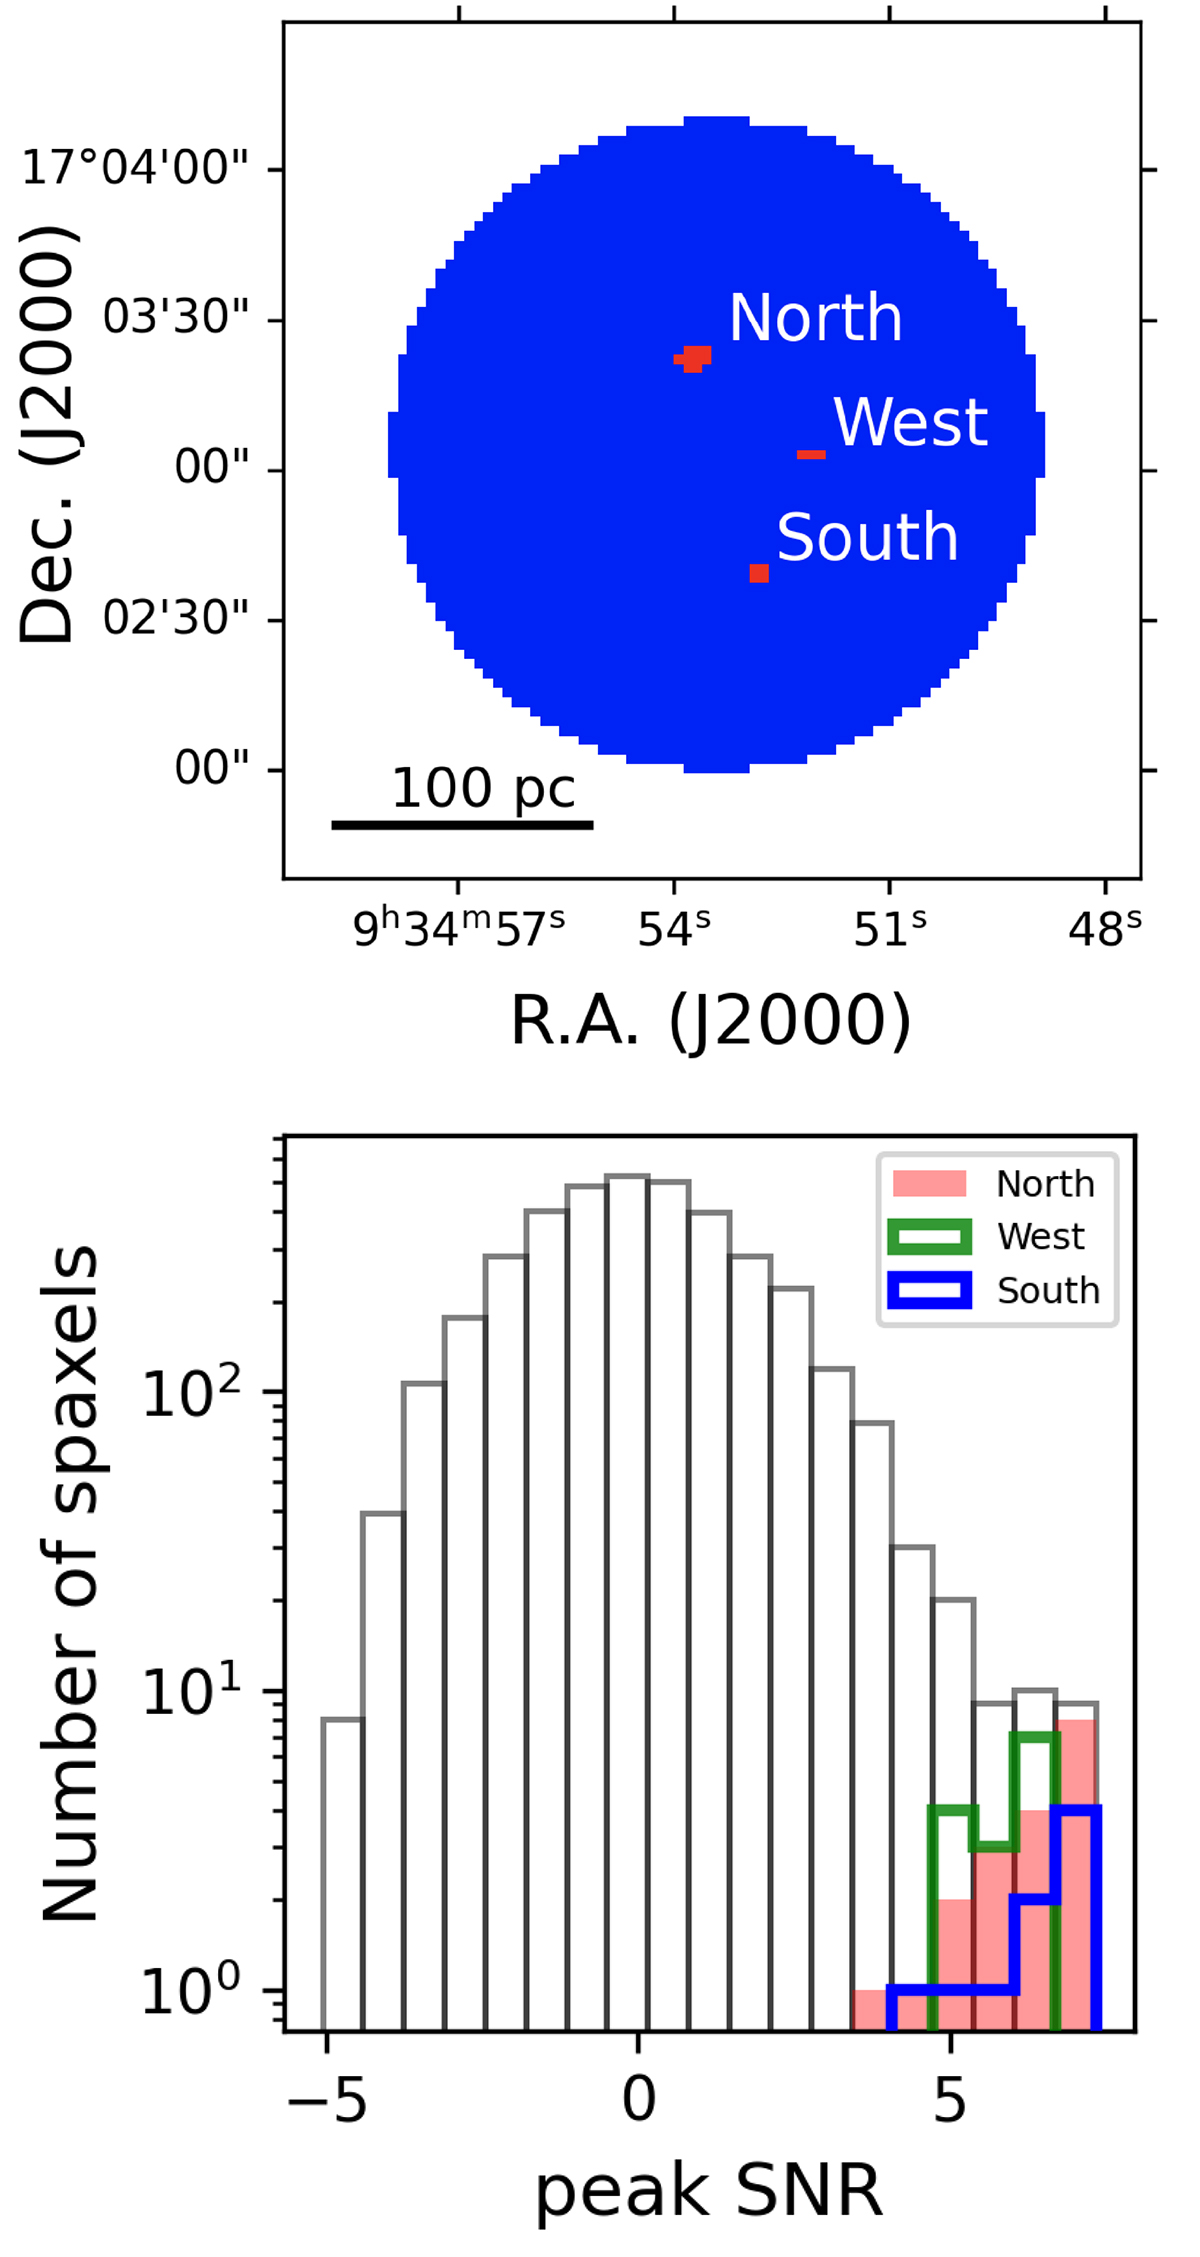
Fig. B.1.
Download original image
Top: Field of view explored with ACA and identification of clouds in the ACA CO(1-0) data cube. Spaxels with one or more channels containing intensities with S/N≥5 are colored red, while those without significant emission (0 spaxels) are colored blue. We identify three regions (north, west, south) that include channels with SNR≥5 emissions and also fulfill the requirement of having two or more spaxels meeting the same criteria. Bottom: Histogram of the peak S/N values of the ACA-CO(1-0) data, which resembles a Gaussian distribution (gray). The pixels that are related to the CO detections are identified in the top panel (in addition to all the pixels contained in the aperture of radius rFWHM/2, CO) are shown as red, green, and blue bins, corresponding to the north, west, and south CO clouds, respectively.
Current usage metrics show cumulative count of Article Views (full-text article views including HTML views, PDF and ePub downloads, according to the available data) and Abstracts Views on Vision4Press platform.
Data correspond to usage on the plateform after 2015. The current usage metrics is available 48-96 hours after online publication and is updated daily on week days.
Initial download of the metrics may take a while.