Fig. G.1.
Download original image
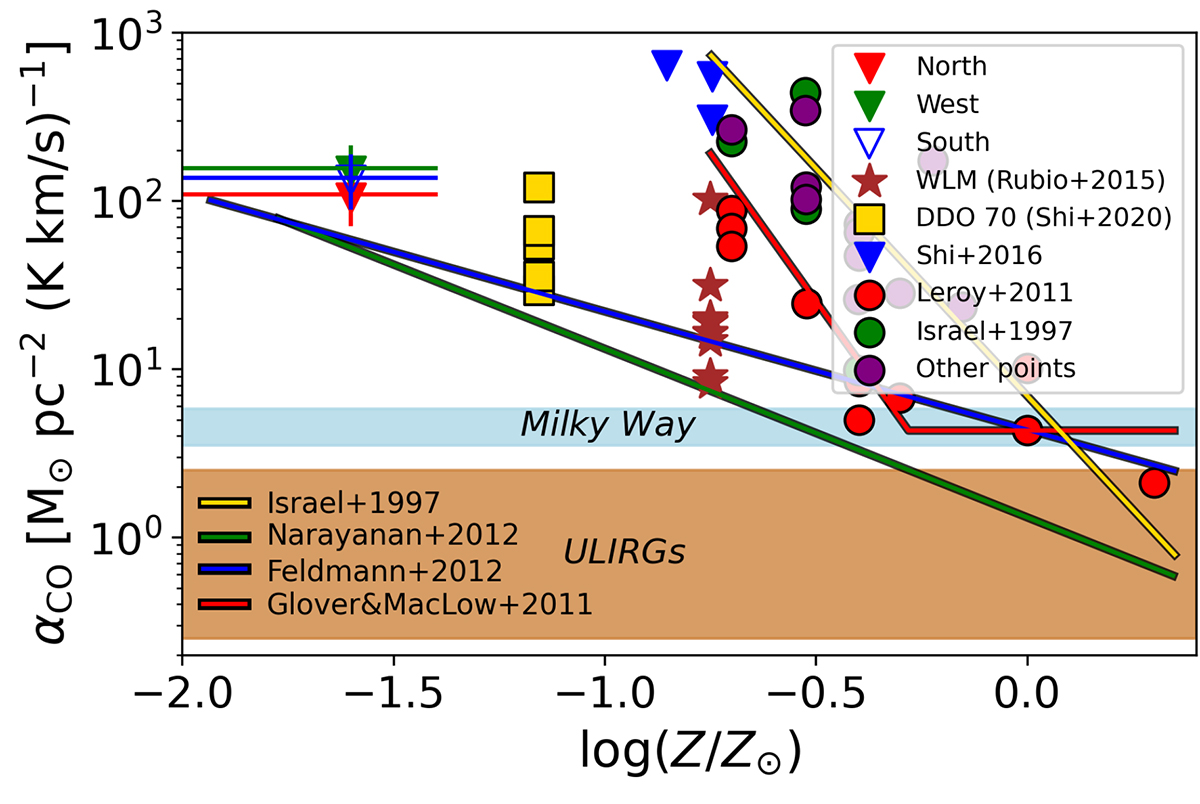
CO-to-H2 conversion factor (αCO) vs. metallicity, adapted from Bolatto et al. (2013) to include the main properties of the CO clouds in Leo T detected in this work. The αCO estimations (red, green and unfilled-red inverted triangles) correspond to upper limits (see Sect. 3), with uncertainties of the order of ∼24-33%. The figure includes a recompilation of CO structures reported in different galaxy samples: WLM (Rubio et al. 2015); DDO 70 (Shi et al. 2020); DDO 50 and DDO 53 (Shi et al. 2016); local LIRGs and ULIRGs (Leroy et al. 2011); LMC and other magellanic irregular galaxies (Israel 1997); and other local group galaxies (Madden et al. 1997; Gratier et al. 2010; Smith et al. 2012). The figure also contains theoretical models of αCO(Z) from Israel (1997) (yellow line), Narayanan et al. (2012) (green line), Feldmann et al. (2012) (blue line), and Glover & Mac Low (2011) (red line). The light blue and brown areas correspond to the αCO ranges for the MW and ULIRGs recommended by Bolatto et al. (2013).
Current usage metrics show cumulative count of Article Views (full-text article views including HTML views, PDF and ePub downloads, according to the available data) and Abstracts Views on Vision4Press platform.
Data correspond to usage on the plateform after 2015. The current usage metrics is available 48-96 hours after online publication and is updated daily on week days.
Initial download of the metrics may take a while.