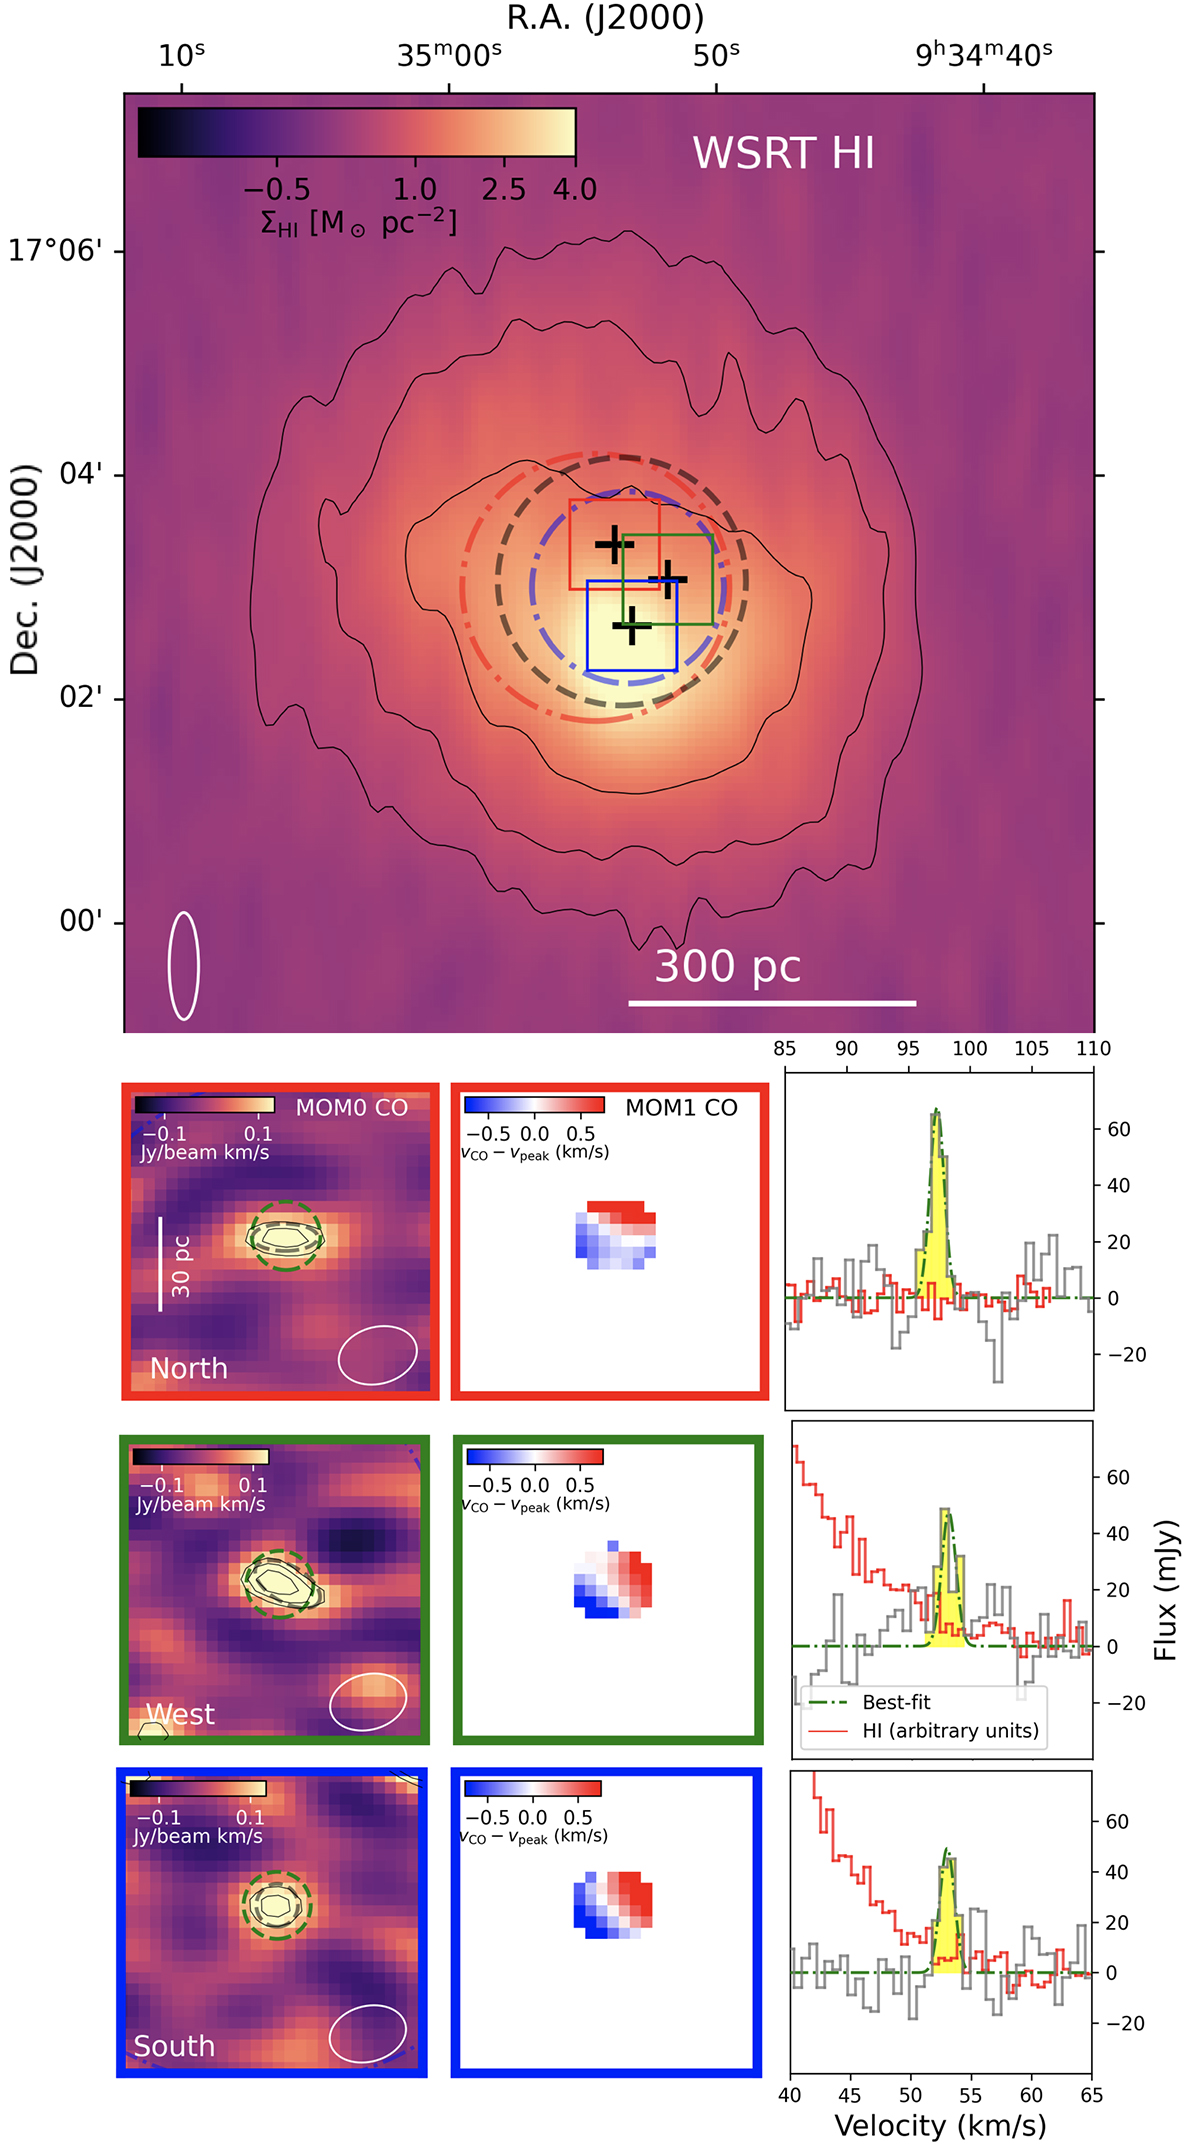
Fig. 1.
Download original image
Top panel: atomic gas surface density map derived from the HI data (Adams & Oosterloo 2018). The black-dashed circle marks the ACA CO(1–0) data FoV. Each square marks a cloud detection region: north (red), west (green), and south (blue). The old and younger stellar population distributions are shown with red and light blue circles (corresponding to their respective half-light radii of 145 pc and 102 pc de Jong et al. 2008). Bottom nine subpanels: zoomed-in images of the ACA CO emission maps (MOM0), velocity fields (MOM1), and spectra of the three CO clouds identified in this work. The spectra are taken within the apertures shown by the green dashed circles in the MOM0 panels (i.e., rCO in Table C.1). The CO and HI spectra are in heliocentric frame (rightmost subpanels). The beam sizes are the white ellipses.
Current usage metrics show cumulative count of Article Views (full-text article views including HTML views, PDF and ePub downloads, according to the available data) and Abstracts Views on Vision4Press platform.
Data correspond to usage on the plateform after 2015. The current usage metrics is available 48-96 hours after online publication and is updated daily on week days.
Initial download of the metrics may take a while.