Fig. E.1.
Download original image
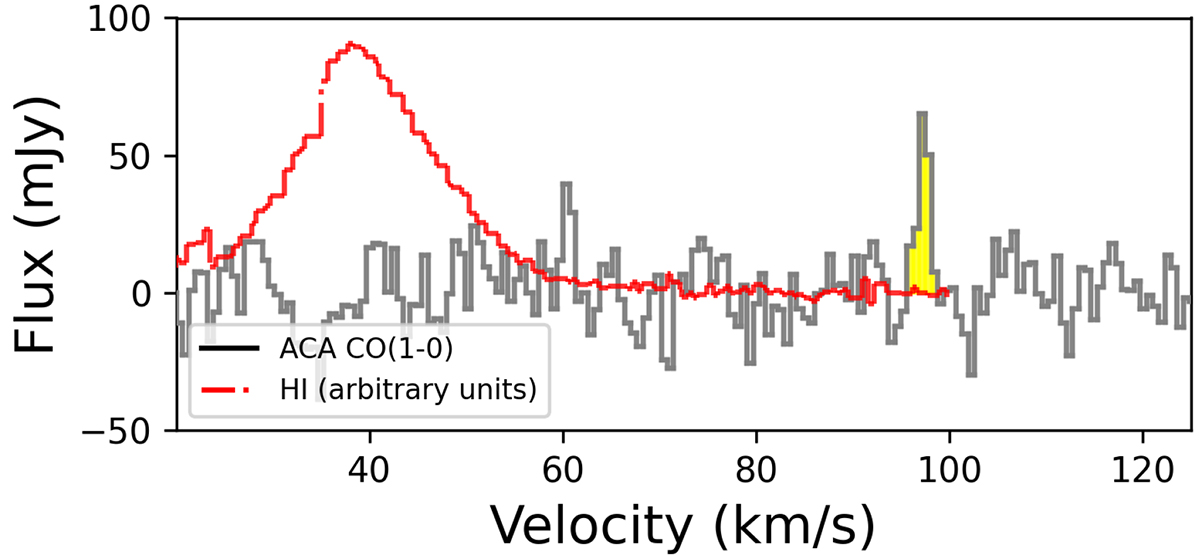
Average HI spectrum from Adams & Oosterloo (2018) (in rescaled units; red dashed line) and this work’s CO spectrum of the north cloud (gray solid line), with the detected CO peak (yellow area). The velocity offset of the CO emission line peak with respect to the HI peak (∼60 km s−1) suggests the extreme physical conditions that the north cloud is exposed to, which are discussed in Sect. 3.
Current usage metrics show cumulative count of Article Views (full-text article views including HTML views, PDF and ePub downloads, according to the available data) and Abstracts Views on Vision4Press platform.
Data correspond to usage on the plateform after 2015. The current usage metrics is available 48-96 hours after online publication and is updated daily on week days.
Initial download of the metrics may take a while.