| Issue |
A&A
Volume 699, July 2025
|
|
|---|---|---|
| Article Number | A280 | |
| Number of page(s) | 9 | |
| Section | Stellar structure and evolution | |
| DOI | https://doi.org/10.1051/0004-6361/202554891 | |
| Published online | 17 July 2025 | |
Post-common envelope evolution of helium-core white dwarfs⋆
1
Grupo de Evolución Estelar y Pulsaciones, Facultad de Ciencias Astronómicas y Geofísicas, Universidad Nacional de La Plata, CONICET-IALP, Paseo del Bosque s/n, 1900 La Plata, Argentina
2
Center for Astrophysics | Harvard & Smithsonian, 60 Garden Street, Cambridge, MA 02138, USA
⋆⋆ Corresponding author: This email address is being protected from spambots. You need JavaScript enabled to view it.
Received:
31
March
2025
Accepted:
4
June
2025
Abstract
Context. Helium-core white dwarfs (He WDs) from the common envelope (CE) channel offer insights into binary evolution and compact remnant formation. Their cooling rates influence their detectability and affect age estimates of close binaries. Compared with those from stable Roche-lobe overflow (SRLOF), CE He WDs experience a distinct mass-loss history, leading to fundamental differences in the post-CE evolution of the resulting WDs.
Aims. We investigate how the H-envelope mass (MH) affects the cooling evolution of CE He WDs. In particular, we analyze how the bifurcation point, which separates the degenerate He core from the envelope, determines the remaining MH and the presence of residual H burning.
Methods. We computed evolutionary sequences for He WDs of 0.20 M⊙ to 0.42 M⊙, from a 1 M⊙ progenitor on the red giant branch. Using the La Plata stellar evolution code (LPCODE), we followed their evolution from the post-CE phase to the cooling track, identifying two pathways depending on the remaining H: (i) non-flashing sequences, in which WDs cool without prior nuclear burning, and (ii) flashing sequences, in which H shell flashes reshape the envelope before cooling.
Results. CE He WDs with minimal MH cool rapidly after formation, with negligible residual H burning. For a sample with Teff between 12 000 and 27 000 K, our models predict ages of 5–130 Myr, increasing to slightly above 300 Myr for Teff<10 000 K, which is much younger than those from SRLOF sequences. In contrast, WDs with more MH sustain residual nuclear burning, delaying cooling. At Teff<10 000 K, these models predict ages of several Gyr, far exceeding those from SRLOF and minimal-envelope sequences. Flashing sequences significantly extend the pre-WD phase compared to non-flashing sequences, but this phase remains much shorter than in SRLOF evolution. The amount of MH also affects mass and surface gravity estimates, introducing systematic differences from SRLOF WDs at a given Teff.
Conclusions. The evolutionary paths of CE He WDs differ significantly from those of SRLOF-produced WDs. Minimal-envelope CE WDs cool rapidly and merge at lower temperatures, while those with sustained H burning remain bright for longer and merge at higher temperatures. These differences with SRLOF WDs are critical for understanding the evolutionary history and final fate of He WDs in compact binaries.
Key words: binaries: close / stars: evolution / stars: interiors / white dwarfs
The cooling sequences are publicly available at http://evolgroup.fcaglp.unlp.edu.ar
© The Authors 2025
 Open Access article, published by EDP Sciences, under the terms of the Creative Commons Attribution License (https://creativecommons.org/licenses/by/4.0), which permits unrestricted use, distribution, and reproduction in any medium, provided the original work is properly cited.
This article is published in open access under the Subscribe to Open model. This email address is being protected from spambots. You need JavaScript enabled to view it. to support open access publication.
1. Introduction
Helium-core white dwarfs (He WDs) are compact remnants with stellar masses ≲0.45 M⊙ (Cassisi & Salaris 2013), formed through enhanced mass loss prior to the onset of the core He flash in low-mass red giant branch (RGB) stars. This mass loss typically results from binary interactions, although, in rare cases, single evolution can lead to relatively massive He WDs under specific conditions of low initial mass, low metallicity, and high He content (Calamida et al. 2008; Bellini et al. 2013; Althaus et al. 2017).
A particularly relevant subclass is the extremely low-mass (ELM) WDs, with masses below ∼0.30 M⊙. These objects must form in binaries, as their masses are insufficient for He ignition (Cassisi & Salaris 2013). Large observational efforts, including the SPY and WASP surveys, have significantly expanded the catalog of known ELM WDs (Koester et al. 2009; Brown et al. 2010, 2013, 2016a, 2020, 2012; Maxted et al. 2011; Gianninas et al. 2014, 2015).
The binary origin of ELM WDs is reinforced by the fact that most are found in compact binaries, predominantly He+CO WD systems (Brown et al. 2020). Their observed mass-period distribution suggests two main formation channels: stable Roche-lobe overflow (hereinafter SRLOF) and common envelope (CE) evolution, triggered by dynamically unstable mass transfer (Brown et al. 2020). ELM WDs with masses ∼0.20−0.32 M⊙ and orbital periods P<0.1 days are likely CE products and are expected to merge. Theoretical models (Li et al. 2019) indicate that the energy required to eject a tightly bound CE when the donor has just finished core H burning (see also Sun & Arras 2018) prevents the formation of ELM WDs with masses below 0.22 M⊙, which instead form via the SRLOF channel.
The total H content, MH, plays a crucial role in determining the cooling evolution of He WDs, particularly those formed through a CE phase (Calcaferro et al. 2018; Córsico et al. 2019). A recent study by Scherbak & Fuller (2023) also highlights the relevance of MH for the evolution of post-CE He WDs, showing that different envelope masses lead to significant variations in cooling times and structural properties. Observations suggest that He WDs formed through CE evolution may have significantly lower MH than predicted by SRLOF models (Strickler et al. 2009; Irrgang et al. 2021; Li et al. 2019; Calcaferro et al. 2018). Despite the uncertainties in CE evolution (Ivanova & Nandez 2016; Nandez & Ivanova 2016), numerical studies indicate that most of the RGB progenitor’s envelope is lost during CE ejection (Ivanova 2011; Sand et al. 2020).
Due to the complexity of CE evolution (Ivanova et al. 2013), most observational studies determining ELM WD properties rely on SRLOF-based evolutionary sequences (Althaus et al. 2013; Istrate et al. 2016), which are widely used to infer mass and age. In these models, the WD retains a relatively thick H envelope that sustains stable H burning. However, if CE evolution systematically leads to lower MH, post-CE He WDs may have cooling properties and internal structures significantly different from those inferred using SRLOF models, potentially introducing systematic biases in observed stellar parameters.
In this work, we present a self-consistent set of post-CE evolutionary sequences for He WDs, covering a mass range of 0.2−0.45 M⊙. While Scherbak & Fuller (2023) also explored the impact of envelope mass on WD evolution, our approach differs in both motivation and methodology. We begin by considering physically motivated CE scenarios and explore different mechanisms for envelope ejection, such as dynamical removal near the bifurcation point and delayed ejection after envelope expansion, evaluating their plausibility and impact on MH. Our sequences are designed to directly link observed Teff and log g to mass and age estimates for He WDs formed via CE, providing a practical tool for cases where standard SRLOF-based models may not apply.
Recent studies have shown that, even within the framework of SRLOF evolution, the mass–orbital period relation for He WDs can exhibit substantial dispersion depending on physical processes such as wind mass loss and the mass-transfer prescription adopted in evolutionary models (Zhang et al. 2021; Gao & Li 2023). In this context, our CE evolutionary sequences provide an independent avenue to interpret He WD binaries, especially in the short-period regime where canonical SRLOF predictions may not apply, and where a clear mass–period relation might not be expected.
This paper is structured as follows. Sect. 2 describes the input physics and numerical methods. Sect. 3 presents our results, including the structural properties and evolutionary timescales of post-CE He WDs, and Sect. 4 summarizes our conclusions.
2. Creation of stellar models from envelope ejection and their evolution to the WD state
2.1. Numerical treatment of MH in post-CE He WDs
We analyzed the evolution of He WD sequences following their formation in a CE event. To construct them, we evolved a 1 M⊙, Z = 0.01 star from the zero-age main sequence to the RGB, and removed most of the outer envelope at a specified core mass to simulate the CE phase. The resulting remnant was then evolved from its RGB state to later He WD cooling stages, considering potential residual nuclear burning. We used La Plata stellar evolution code LPCODE, developed by the La Plata group (Althaus et al. 2005, 2015; Salaris et al. 2013; Miller Bertolami 2016; Althaus & Córsico 2022). Our sequences cover the range 0.20−0.45 M⊙, consistent with previous studies suggesting that He WDs formed from CE evolution typically have masses above MWD>0.20 M⊙ (Chen et al. 2017; Sun & Arras 2018; Li et al. 2019), as previously discussed. The resulting masses are listed in Table 1.
Relevant quantities for selected He WD sequences resulting from CE.
Theoretical models indicate that after a dynamical CE event, some H remains bound to the stellar core rather than being fully expelled (Lombardi et al. 2006; Ivanova 2011). This final MH is crucial for the evolution of the resulting He WD. An important uncertainty is the bifurcation point, which separates the retained core from the ejected envelope and remains under debate (Tauris & Dewi 2001; Ivanova et al. 2013; Kruckow et al. 2016; Vigna-Gómez et al. 2022; Chen et al. 2024). This point is located between the H-free core and the base of the convective envelope in the pre-CE star, within the H-rich layers.
Different criteria have been proposed to determine the bifurcation point, as reviewed by Tauris & Dewi (2001) and Ivanova et al. (2013). Figure 1 presents the expected locations of the bifurcation point for a pre-CE RGB model with an H-free core mass of 0.271 M⊙. The arrows indicate the predictions from each criterion.
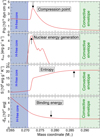 |
Fig. 1. Internal profiles of P/ρ, nuclear energy generation, specific entropy, and binding energy for a 1 M⊙ RGB pre-CE star with a H-free core mass of 0.271 M⊙. Colored regions indicate the convective envelope and the H-free core, with the core boundary defined at XH = 10−6. Arrows mark the estimated bifurcation point separating the remaining core from the ejected envelope. |
One criterion places the bifurcation point based on the entropy profile, identified by the sharp onset of the flat entropy region. In stars with a convective envelope, R∝M−1/3, so as the envelope is removed, the star expands. During CE, this facilitates the loss of outer layers until deeper radiative regions are reached. Expansion ceases when the entropy profile decreases inward, marking the separation between the core and the ejected envelope.
Another criterion uses the binding energy of the envelope. The binding energy at a given Mi coordinate is defined as
where Mi is the mass coordinate where envelope separation occurs, M* is the total stellar mass at CE onset, G is the gravitational constant, u is the specific internal energy, and m is the mass within the radius coordinate r. The bifurcation point is located where EB transitions from a steep increase near the core to a more gradual variation outward (Han et al. 1994; Tauris & Dewi 2001; Ivanova et al. 2013).
Another approach places the bifurcation point at the mass coordinate corresponding to the maximum nuclear energy release in the H-burning shell.
A more physically motivated criterion places the bifurcation point at the maximum compression point, mcp, where the ratio P/ϱ reaches a local maximum within the H-burning shell prior to CE. If the post-CE remnant has a mass below mcp, it contracts smoothly. Otherwise, it expands on a local thermal timescale, leading to further mass loss until stabilizing near mcp. Since deeper envelope stripping is unlikely, mcp provides a meaningful limit for the post-CE structure of He WDs (Ivanova 2011).
Fig. 2 shows the four bifurcation points for the same RGB model, along with the mass coordinate where the H mass fraction is XH = 0.1, a commonly adopted reference. All points lie between the base of the convective envelope and the H-free core, as indicated by the gray region. The entropy profile criterion yields the largest core mass, whereas the maximum compression and nuclear energy criteria place the bifurcation point closer to the H-free core, which coincides with a sharp drop in the H distribution profile.
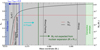 |
Fig. 2. Internal structure of a 1 M⊙ pre-CE RGB star with an H-free core of 0.271 M⊙. The gray region corresponds to the envelope between the H-free core and the base of the convective zone, where the bifurcation point separates the future WD core from the ejected material. Dashed vertical lines indicate local criteria for selecting the bifurcation point: XH = 0.1, maximum nuclear energy generation rate, maximum compression, and binding energy and entropy conditions (see Fig. 1). Red and black lines show the H profile and its cumulative value, MH. The dark green line marks the innermost mass coordinate for which the residual MH is sufficient to produce envelope expansion induced by nuclear burning beyond 1 R⊙. The blue and cyan lines indicate the minimum MH required for residual H burning to significantly impact cooling, and for the occurrence of unstable H flashes, respectively. |
The maximum MH is set by the base of the convective envelope. In the RGB model of Fig. 2, this corresponds to 0.012 M⊙, about 30 times larger than the value at the maximum compression point, and thus less likely (Ivanova 2011). Although this location represents the theoretical upper limit for the bifurcation point, such extreme values are not adopted in our evolutionary sequences, as observational constraints impose a much lower upper limit on MH. Indeed, newly formed He WDs from CE events typically have orbital periods P<0.15 day, often as short as P<0.05 day (Brown et al. 2016b; Scherbak & Fuller 2023), corresponding to separations of 1–1.2 R⊙. If MH exceeds a critical value, nuclear expansion before the cooling track causes the stellar radius to surpass this separation, triggering mass loss that reduces MH and establishes an upper bound. The dark green line in Fig. 2 marks this threshold, which lies below the bifurcation point predicted by the entropy profile and binding energy. Thus, we excluded models with large MH that produce stellar radii exceeding ∼1 R⊙ (see Table 1), as shown by the dashed red line in Fig. 3. Depending on the WD mass, the upper MH limit ranges from 1.2×10⁻³ to 8×10⁻³ M⊙, reflecting intrinsic constraints of our models (Scherbak & Fuller 2023).
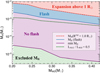 |
Fig. 3. Initial H content mass after CE, MH, as a function of WD mass. The dashed red line marks the value of MH above which H burning releases sufficient energy to cause the envelope to expand beyond 1 R⊙. Models with larger MH are excluded from our sequences. The solid blue line separates sequences that undergo or avoid H-shell flashes. The green dashed line indicates the MH threshold below which residual H burning contributes less than 50% to the WD luminosity. The hatched green region shows the range of MH values excluded from our study. |
2.2. Adjustment time to the WD state
If MH is sufficiently low, the He WD contracts rapidly without significant H burning, reaching high Teff in a short adjustment time (τadjust) (Scherbak & Fuller 2023). Unlike WDs formed through SRLOF mass loss, these objects enter the cooling track without undergoing recurrent H-shell flashes (Althaus et al. 2013; Istrate et al. 2016), defining the so-called “non-flashing sequences”. For moderately larger MH values, residual H burning can set in later during the cooling phase, providing an additional energy source that slows the cooling process. If MH is increased even further, H burning ignites at earlier stages, causing the envelope to expand and eventually leading to the occurrence of an H-shell flash at the onset of the cooling track, which defines the “flashing sequences”. Fig. 3 (see also Table 1) shows MH as a function of He WD mass, with the solid blue line marking the threshold between flashing and non-flashing regimes.
Fig. 4 shows τadjust as a function of He WD mass, representing the time from CE ejection to the maximum Teff before cooling1. In all CE sequences, τadjust is markedly shorter than in He WDs from SRLOF mass loss, as indicated by the solid black line (Althaus et al. 2013; Istrate et al. 2016). This is because, in CE sequences, H burning is temporarily suppressed due to the rapid mass loss, and resumes only after the star has already evolved toward higher Teff. The delay in H reignition shortens τadjust, especially in cases with lower MH.
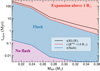 |
Fig. 4. Adjustment time from CE ejection to maximum Teff vs. stellar mass. The dashed red line marks τadjust for sequences where envelope nuclear expansion reaches 1 R⊙. Non-flashing sequences (below the blue line) evolve rapidly to the WD cooling phase. The solid black line shows predictions from SRLOF mass transfer. |
Non-flashing sequences have the shortest τadjust, typically below 0.01 Myr, making it negligible compared to cooling times. In contrast, flashing sequences exhibit longer τadjust, correlated with higher MH (see Table 1), as early H reignition delays entry into the cooling branch. The envelope expansion limit of 1 R⊙ further constrains τadjust to 0.5–100 Myr, depending on He WD mass. The dashed red line in Fig. 4 marks this upper bound.
In summary, contraction times to the WD state following CE are significantly shorter than for SRLOF, especially for non-flashing sequences.
3. Evolutionary behavior of He WDs formed via common envelope
3.1. Evolutionary characteristics of He WD sequences with minimal H masses
The bifurcation point choice strongly affects the final MH and subsequent evolution of He WDs. Using the maximum compression point, mcp, as proposed by Ivanova (2011), provides a physically robust criterion to define the post-CE core boundary, enabling a reliable estimate of MH. As shown in Fig. 2, envelope ejection at mcp yields an MH where residual H burning contributes less than 50% to the total WD luminosity and is effectively negligible. Thus, He WDs from CE evolution are expected to rely minimally on residual burning, with little impact on their cooling times.
Although mass removal beyond mcp is unlikely (Ivanova 2011), stellar winds or post-ejection processes may further reduce MH. We adopted the mass coordinate where XH = 0.10, following Tauris & Dewi (2001), Kruckow et al. (2016), which yields MH values about ten times lower than at mcp (see Fig. 2) without significantly affecting He WD evolution. The XH = 0.10 criterion enables mass-independent comparisons and sets a lower MH limit for our sequences, ranging from 3×10⁻⁵ to 3×10⁻⁶ M⊙, depending on the He WD mass. Fig. 3 highlights these limits, with the green hatched region marking the excluded MH values. Near-complete envelope removal during CE is supported by 3D hydrodynamical simulations of low-mass early AGB stars (Sand et al. 2020).
The top panel of Fig. 5 shows surface gravity as a function of Teff for He WD sequences with minimum MH. Green symbols mark He WDs in P<0.1 day binaries from the ELM survey (Brown et al. 2020), identified as CE products. These objects, listed in Table 2, reach the cooling track almost instantaneously after CE (within a century; see Table 1) due to the absence of nuclear burning. The bottom panel of Fig. 5 shows evolutionary times since CE ejection as a function of Teff, where cooling is mainly driven by internal energy depletion in the degenerate He core. The smooth curve bend at intermediate temperatures results from H diffusion from deeper layers, which increases surface gravity. As H diffuses upward, He enrichment at the base of the envelope increases opacity, reducing the energy transfer rate and prolonging the stellar age.
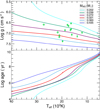 |
Fig. 5. Upper panel: Surface gravity vs. Teff for He WD sequences with minimum MH (no residual H burning). Green symbols mark CE He WDs (P<0.1 day) (Brown et al. 2020). Bottom panel: Evolutionary time since CE ejection vs. Teff. The smooth bend at intermediate temperatures arises from H diffusion from deeper layers, which increases gravity and age. |
Stellar parameters of selected CE He WDs inferred from post-CE sequences.
Sequences with minimum MH predict ages slightly above 300 Myr for Teff<10 000 K and several Gyr for Teff<5000 K. The upper panels of Fig. 6 show these trends, with stellar mass and evolutionary times plotted as functions of log g and log Teff, alongside observed data. Models without H burning systematically yield short evolutionary times, even at low Teff, predicting ages below 200 Myr for all observed CE He WDs, with many under 5 Myr.
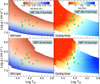 |
Fig. 6. Stellar mass (left panels) and cooling times (right panels) vs. log g and log Teff for post-CE non-flashing sequences with minimum MH (no H burning; top) and maximum MH (H burning; bottom). Green symbols mark CE He WDs (P<0.1 day) (Brown et al. 2020). Sequences with H burning show much longer cooling times, exceeding several Gyr at low log Teff, while those with minimum MH remain below 1 Gyr. In both cases, adjustment times after CE remain under 0.1 Myr. |
Table 2 summarizes the inferred stellar parameters. The fifth and sixth columns list the stellar mass and age, both inferred from the observed Teff and log g, using sequences with minimum MH. The ages are measured from the end of the CE phase. These results are compared with those derived from SRLOF He WD models (Althaus et al. 2013; Istrate et al. 2016), which are commonly used to estimate WD parameters. The last two columns of Table 2 list the stellar mass and cooling age obtained from SRLOF sequences, with ages measured from the end of the SRLOF phase. These ages carry large uncertainties due to multiple possible solutions arising from early recurrent H flashes (Althaus et al. 2013; Istrate et al. 2016).
For the observed He WDs listed in Table 2, sequences with minimum MH yield slightly lower stellar masses than SRLOF models. This is because, at a given Teff, WDs with thinner H envelopes are more compact, and thus require less mass to reproduce the observed surface gravity. In addition, CE sequences typically predict younger cooling ages for this sample than their SRLOF counterparts, where nuclear burning contributes significantly before and during the cooling phase.
To explore the evolution at fixed stellar mass, Fig. 7 shows Teff versus cooling age for CE sequences with minimum MH (blue lines) and SRLOF sequences (black lines) at four different WD masses. For SRLOF models, cooling ages are measured from the onset of the first cooling branch. Except for the most massive cases, SRLOF models predict older ages than CE models within the Teff range covered by Table 2. At lower temperatures, the age differences decrease, particularly when H flashes in SRLOF models reduce the envelope mass sufficiently to quench nuclear burning, resulting in cooling times that become more comparable to those of CE WDs. At higher Teff, CE models with minimum MH evolve more slowly. This occurs because their more compact structure leads to lower luminosities and slower cooling rates.
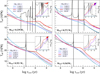 |
Fig. 7. Effective temperature vs. cooling age for non-flashing sequences with maximum (red) and minimum (blue) initial MH from a CE phase. Insets show the fraction of WD luminosity from H burning. Solid black lines represent SRLOF cooling tracks (Althaus et al. 2013), where short-lived H flashes occur. Thin violet lines indicate intermediate MH values. Ages are measured from the start of the cooling branch. Horizontal dotted lines mark the Teff range of the observed He WDs reported in Table 2. |
The orbits of He+CO WD binaries shrink due to gravitational-wave radiation, with the merger timescale determined by the orbital period. We assume that all systems in Table 2 will eventually merge (Brown et al. 2020). Fig. 8 presents the positions of the observed ELM WDs in the log g–Teff plane, both at the current epoch (top panel, based on observations) and at the time of merger (middle and bottom panels), as inferred from our evolutionary models. The merger positions correspond to sequences with minimum MH, i.e., no residual H burning. Systems with P≳0.07 days are expected to merge below 8000 K, at ages approaching ∼2 Gyr (bottom panel). Despite their short orbital periods “likely resulting from a CE phase” some He WDs may reach low Teff before merging, provided that residual nuclear burning is absent.
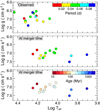 |
Fig. 8. Top: Surface gravity vs. Teff for observed He WDs with WD companions (P<0.1 day), likely from the CE channel (Brown et al. 2020). The color bar indicates the orbital period. Middle: Same systems evolved to the merger time, assuming the minimum initial MH (no H burning). Bottom: Same as the middle panel, but with the color bar indicating WD age at merger. He WDs with P≳0.07 day are expected to merge at Teff<8000 K, reaching ages of ∼2 Gyr. |
All sequences with minimal MH undergo convective mixing at Teff<5000 K, leading to H-He envelope enrichment. This occurs in all He WDs, regardless of mass, because deep mixing transports H from the envelope into the underlying He layer.
Adopting the maximum compression point mcp as the bifurcation point leads to a larger MH than the minimum values discussed in this section (see Fig. 2), but does not significantly alter the overall evolution of the resulting He WD. At this mass coordinate, residual H burning contributes less than 50% of the total WD luminosity. The main difference is that the thicker H envelope increases the stellar radius and shortens the cooling times by 20–30% compared to sequences with minimum MH. This larger envelope also suppresses surface convective mixing at low Teff.
3.2. Evolutionary characteristics of He WD sequences with residual H shell burning
While mcp is a physically motivated bifurcation point, we examine the potential effects of choosing bifurcation points above mcp on He WD evolution. In massive giants, Vigna-Gómez et al. (2022) found that bifurcation limits above mcp may prevent rapid re-expansion, potentially setting CE termination thresholds and yielding higher MH values. However, since this result applies to massive stars, we assess its relevance for lower-mass giants without assuming identical behavior.
Higher MH values significantly impact the evolution of He WDs, particularly when residual H burning dominates the star’s energy output during the cooling phase. In the model shown in Fig. 2, this situation arises if the envelope is removed at mass coordinates beyond the vertical blue line. In that case, the remaining MH is large enough for nuclear burning to contribute more than 50% of the total luminosity once the star reaches the WD stage.
Fig. 7 (red lines) shows cooling times for models with MH values near this threshold – specifically, the highest values that still do not undergo H flashes, as indicated by the cyan line in Fig. 2. Fig. 7 also shows the fraction of WD luminosity powered by residual H burning in these non-flashing sequences. This burning prolongs the cooling times significantly below Teff∼20 000–17 000 K, depending on stellar mass. At higher Teff, where nuclear burning is negligible, WDs with larger MH cool more rapidly due to their higher luminosity and larger radii. Conversely, in this hot regime, sequences with minimum MH exhibit the longest cooling times at a given stellar mass.
The upper-right and bottom-right panels of Fig. 6 illustrate these trends. The sawtooth-like structure in maximum MH sequences results from H-burning reignition, slowing the cooling rate and causing nearly constant Teff evolution over a significant period. Cooling times for maximum MH sequences can exceed several Gyr at low log Teff, whereas minimum MH sequences remain below 1 Gyr.
The evolution of intermediate MH sequences depends on whether H burning remains significant along the cooling track. If sustained, these sequences yield ages between those of maximum and minimum MH at both high and low Teff (see Fig. 7). In summary, at low Teff, maximum MH sequences evolve the slowest due to residual H burning, while at high Teff, they evolve the fastest.
As shown in Fig. 7, sequences with maximum MH predict longer cooling times than SRLOF sequences at fixed stellar mass and low to intermediate Teff, due to sustained H burning. This difference is particularly pronounced in the coolest models. A similar effect is often seen in the inferred ages of observed WDs in Table 2, though not in all cases. Part of the discrepancy arises because Table 2 includes the pre-WD adjustment time–longer in SRLOF models–and the inferred masses differ between model sets. As a result, the trends in Fig. 7 do not directly translate into those derived from observations.
At higher Teff, the behavior changes: both SRLOF and minimum MH sequences tend to predict longer cooling times than maximum MH models, where the increased radius and luminosity accelerate energy loss. This contrast underscores the critical role of H-layer thickness and evolutionary history in shaping WD cooling behavior.
The H-layer mass, MH, strongly impacts the surface gravity of He WDs, affecting mass estimates derived from the observed g and Teff. Fig. 9 illustrates this effect for non-flashing He WD sequences from CE evolution. Thick and thin lines represent different MH values, emphasizing its influence on evolutionary tracks. Sequences with maximum MH exhibit a characteristic “hook” due to H-shell reignition, which depletes H and increases surface gravity as Teff decreases. Sequences with higher MH predict larger inferred masses for observed He WDs compared to those with minimum MH. This trend is evident in the bottom-left and upper-left panels of Fig. 6, where increased MH correlates with higher predicted stellar masses.
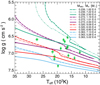 |
Fig. 9. Surface gravity vs. Teff for non-flashing He WD sequences from a CE phase. Thick solid and dashed lines show minimum and maximum MH sequences, respectively, while thin lines indicate intermediate MH values. Green symbols mark CE He WDs (P<0.1 day) (Brown et al. 2020). |
Finally, we note that if maximum MH sequences are considered, all observed He+CO WD binaries (Brown et al. 2020) would merge before reaching Teff = 10 000 K, preventing them from cooling to lower temperatures.
3.3. Impact of hydrogen-shell flashes on the evolution of He WDs
If excess H reignites shell burning before or at the start of the cooling track, the WD undergoes an early H-shell flash, which defines a flashing sequence. Fig. 3 (see also Table 1) shows the MH threshold for this process (solid blue line), which, in Fig. 2, corresponds to a bifurcation point above the cyan line.
If an H flash occurs during the early WD cooling stage, the energy released causes the star to expand rapidly, reaching radii larger than 1 R⊙. This expansion may lead to a renewed episode of SRLOF and substantial envelope loss before the star finally settles onto the cooling track (Scherbak & Fuller 2023). The resulting MH is typically smaller than its pre-flash value and is expected to fall between the limits of non-flashing and flashing sequences. From an observational perspective, a WD that underwent such a flash episode cannot be distinguished from one that emerged directly from the CE with a thinner envelope. However, their evolutionary histories differ substantially: flashing sequences experience a significantly longer adjustment time, τadjust, while for non-flashing sequences, this phase is nearly negligible, as discussed earlier.
For the 0.2026, 0.239, 0.2724, 0.3208, 0.363, and 0.4352 M⊙ flashing sequences, the maximum pre-WD times from the end of the CE are 260, 84, 77, 72, 38, and 0.1 Myr, respectively. Hence, past flashes can substantially impact the total age of a He WD.
Regarding the possibility of detecting a WD just before the H flash– a phase characterized by slow cooling–the likelihood is low. Although this stage lasts relatively long, it occupies a very narrow region in the log g–Teff diagram, which limits the chances of observing a WD in this evolutionary phase.
3.4. Impact of progenitor properties on the residual hydrogen mass
We also explored the possible impact of progenitor mass and metallicity on the value of MH resulting from a given bifurcation point. By evolving stellar models with different initial conditions until the formation of a He core of fixed mass (0.27087 M⊙), we find that decreasing the metallicity or increasing the progenitor mass tends to result in slightly larger values of MH. This effect is moderate when the bifurcation point is defined by the compression point, which is arguably the most physically well-motivated criterion. For example, increasing the progenitor mass from 1 to 2 M⊙ (at Z = 0.01) increases MH at the compression point from 3.5×10⁻⁴ to 4.0×10⁻⁴ M⊙, while lowering the metallicity from Z = 0.01 to Z = 0.001 (for a 1 M⊙ progenitor) leads to MH = 5.0×10⁻⁴ M⊙. In contrast, when using a bifurcation point defined by an H abundance threshold (e.g., XH = 0.1), the resulting MH becomes significantly more sensitive to the progenitor structure. In particular, for the 2 M⊙ case, MH is a factor of 10 larger than in the 1 M⊙ model, due to the broader H profile shaped by the convective core during central H burning.
Despite these variations in MH, a comparison with our post-CE sequences shows that the qualitative behavior of He WD evolution remains unchanged. The differences in MH resulting from changes in progenitor mass or metallicity primarily affect the cooling timescales, but not the overall evolutionary path of the WD. While a detailed study is beyond the scope of this work, these results suggest that our conclusions are robust against realistic variations in progenitor properties. Further exploration of these dependences may nonetheless help to improve the modeling of the post-CE envelope structure in future evolutionary calculations.
4. Conclusions and future work
This study examines the evolution of He-core white dwarfs (He WDs) formed via the common envelope (CE) channel, focusing on the influence of H-envelope mass (MH). The final MH is determined by the bifurcation point, marking the boundary between the degenerate He core and the residual envelope. Selecting the maximum compression point (mcp) results in minimal MH, leading to rapid cooling with negligible residual H burning. If MH exceeds this minimum, residual H burning becomes significant, extending the cooling evolution.
We modeled He WDs (0.20–0.42 M⊙) from a 1 M⊙ progenitor in the RGB phase using the LPCODE stellar evolution code, following their evolution from the CE phase to the cooling track. Our findings confirm that MH significantly influences He WD evolution. Consistent with Scherbak & Fuller (2023), we identify two post-CE evolutionary paths:
Non-flashing sequences: These WDs evolve rapidly to the cooling track, as their low MH prevents residual H burning. The pre-WD phase in these models lasts, at most, a few centuries. When applied to the observed sample of CE He WDs, our sequences predict ages typically below 200 Myr, with many younger than 5 Myr. In contrast, WDs formed through stable Roche-lobe overflow (SRLOF) experience sustained H burning, resulting in extended cooling times.
For MH values above the minimum, residual H burning contributes to the energy budget, slowing cooling. When MH is sufficiently large, H burning dominates the luminosity for a significant period, especially at lower Teff. In such cases, our models predict ages exceeding 1 Gyr for Teff<10 000 K–substantially longer than the ages inferred from SRLOF sequences.
Flashing sequences: When MH surpasses a critical threshold, an H shell flash occurs before the WD reaches the final cooling track, prolonging the pre-WD phase relative to non-flashing sequences, yet still shorter than in SRLOF evolution. The flash causes expansion and additional envelope mass loss, resulting in WDs that settle onto the cooling track with envelope masses between the minimum and maximum MH limits of non-flashing sequences.
The value of MH affects the inferred stellar mass. Sequences with higher MH have larger radii, leading to lower inferred surface gravities at a given Teff compared to WDs with minimal MH. This effect is crucial for determining the fundamental parameters of extremely low-mass (ELM) WDs from spectroscopy, as incorrect assumptions about their evolutionary channel can introduce biases in mass and age estimates.
We examined the final outcomes of these systems, noting that MH strongly influences the Teff at which the merger occurs. Binary systems with orbital periods P≳0.07 days are expected to merge at low temperatures (Teff<8000 K) after up to 2 Gyr. This occurs in He WDs with minimal MH, which cool efficiently in the absence of residual nuclear burning. Conversely, He WDs with higher MH generally sustain prolonged H burning, leading to mergers at higher temperatures and different WD ages at merger. Understanding this distinction is essential for linking merger remnants, such as hot subdwarfs and extreme He stars, to the broader population of compact binaries.
An important aspect of this work is the provision of tables that enable the direct inference of mass and age for the observed CE ELM WDs based on their surface gravity and Teff. These tables offer a reliable reference for CE-produced WDs, avoiding biases that may arise when applying SRLOF sequences. Although we primarily focus on non-flashing sequences, the tables are also appropriate for He WD flashing sequences; in these cases, it is essential to consider pre-WD ages.
We also examined how realistic variations in progenitor mass and metallicity affect the residual H-envelope mass associated with different structural bifurcation points. Although the resulting MH values can differ, especially when defined by the H profile, the overall post-CE evolution remains qualitatively unchanged across the explored range. These findings reinforce the robustness of our conclusions. Note that this is a structural analysis and does not account for the energetics required to reach such bifurcation points during CE ejection.
Future work should also focus on incorporating rotational dynamics into the modeling of ELM WDs formed through CE evolution. Tidal interactions during the CE phase could impart significant angular momentum to the resulting WDs, potentially leading to rapid rotation. Rapid rotation can significantly influence internal processes such as element diffusion, convective mixing, and magnetic field generation, thereby affecting the cooling rates and pulsation properties of ELM WDs. Additionally, existing studies have explored the effects of rotational mixing in low-mass WDs resulting from SRLOF, highlighting the importance of incorporating rotational effects into stellar evolution models (Istrate et al. 2016). Integrating rotational dynamics into these models and using asteroseismology to probe the internal structures of ELM WDs will refine our understanding of their fundamental properties and evolutionary pathways.
Acknowledgments
We thank the referee, Dr. Xianfei Zhang, for insightful comments that improved the quality of the manuscript. We thank the Asociación Argentina de Astronomía for supporting the publication costs of this article. This research has made use of NASA Astrophysics Data System.
In the flashing sequences, τadjust does not include the time spent in the first cooling track prior to the occurrence of the H flash.
References
- Althaus, L. G., & Córsico, A. H. 2022, A&A, 663, A167 [NASA ADS] [CrossRef] [EDP Sciences] [Google Scholar]
- Althaus, L. G., Serenelli, A. M., Panei, J. A., et al. 2005, A&A, 435, 631 [NASA ADS] [CrossRef] [EDP Sciences] [Google Scholar]
- Althaus, L. G., Miller Bertolami, M. M., & Córsico, A. H. 2013, A&A, 557, A19 [NASA ADS] [CrossRef] [EDP Sciences] [Google Scholar]
- Althaus, L. G., Camisassa, M. E., Miller Bertolami, M. M., Córsico, A. H., & García-Berro, E. 2015, A&A, 576, A9 [NASA ADS] [CrossRef] [EDP Sciences] [Google Scholar]
- Althaus, L. G., De Gerónimo, F., Córsico, A., Torres, S., & García-Berro, E. 2017, A&A, 597, A67 [NASA ADS] [CrossRef] [EDP Sciences] [Google Scholar]
- Bellini, A., Anderson, J., Salaris, M., et al. 2013, ApJ, 769, L32 [NASA ADS] [CrossRef] [Google Scholar]
- Brown, W. R., Kilic, M., Allende Prieto, C., & Kenyon, S. J. 2010, ApJ, 723, 1072 [Google Scholar]
- Brown, W. R., Kilic, M., Allende Prieto, C., & Kenyon, S. J. 2012, ApJ, 744, 142 [NASA ADS] [CrossRef] [Google Scholar]
- Brown, W. R., Kilic, M., Allende Prieto, C., Gianninas, A., & Kenyon, S. J. 2013, ApJ, 769, 66 [Google Scholar]
- Brown, W. R., Gianninas, A., Kilic, M., Kenyon, S. J., & Allende Prieto, C. 2016a, ApJ, 818, 155 [Google Scholar]
- Brown, W. R., Kilic, M., Kenyon, S. J., & Gianninas, A. 2016b, ApJ, 824, 46 [NASA ADS] [CrossRef] [Google Scholar]
- Brown, W. R., Kilic, M., Kosakowski, A., et al. 2020, ApJ, 889, 49 [Google Scholar]
- Calamida, A., Corsi, C. E., Bono, G., et al. 2008, ApJ, 673, L29 [Google Scholar]
- Calcaferro, L. M., Córsico, A. H., Althaus, L. G., Romero, A. D., & Kepler, S. O. 2018, A&A, 620, A196 [EDP Sciences] [Google Scholar]
- Cassisi, S., & Salaris, M. 2013, Old Stellar Populations: How to Study the Fossil Record of Galaxy Formation (Wiley-VCH) [Google Scholar]
- Chen, X., Maxted, P. F. L., Li, J., & Han, Z. 2017, MNRAS, 467, 1874 [NASA ADS] [CrossRef] [Google Scholar]
- Chen, X., Liu, Z., & Han, Z. 2024, Prog. Part. Nucl. Phys., 134, 104083 [Google Scholar]
- Córsico, A. H., Althaus, L. G., Miller Bertolami, M. M., & Kepler, S. O. 2019, A&ARv, 27, 7 [Google Scholar]
- Gao, S. -J., & Li, X. -D. 2023, MNRAS, 525, 2605 [NASA ADS] [CrossRef] [Google Scholar]
- Gianninas, A., Dufour, P., Kilic, M., et al. 2014, ApJ, 794, 35 [NASA ADS] [CrossRef] [Google Scholar]
- Gianninas, A., Kilic, M., Brown, W. R., Canton, P., & Kenyon, S. J. 2015, ApJ, 812, 167 [Google Scholar]
- Han, Z., Podsiadlowski, P., & Eggleton, P. P. 1994, MNRAS, 270, 121 [NASA ADS] [CrossRef] [Google Scholar]
- Irrgang, A., Geier, S., Heber, U., et al. 2021, A&A, 650, A102 [NASA ADS] [CrossRef] [EDP Sciences] [Google Scholar]
- Istrate, A. G., Marchant, P., Tauris, T. M., et al. 2016, A&A, 595, A35 [NASA ADS] [CrossRef] [EDP Sciences] [Google Scholar]
- Ivanova, N. 2011, ApJ, 730, 76 [Google Scholar]
- Ivanova, N., & Nandez, J. L. A. 2016, MNRAS, 462, 362 [NASA ADS] [CrossRef] [Google Scholar]
- Ivanova, N., Justham, S., Chen, X., et al. 2013, A&ARv, 21, 59 [Google Scholar]
- Koester, D., Voss, B., Napiwotzki, R., et al. 2009, A&A, 505, 441 [NASA ADS] [CrossRef] [EDP Sciences] [Google Scholar]
- Kruckow, M. U., Tauris, T. M., Langer, N., et al. 2016, A&A, 596, A58 [NASA ADS] [CrossRef] [EDP Sciences] [Google Scholar]
- Li, Z., Chen, X., Chen, H. -L., & Han, Z. 2019, ApJ, 871, 148 [NASA ADS] [CrossRef] [Google Scholar]
- Lombardi, J. C. Jr., Proulx, Z. F., Dooley, K. L., et al. 2006, ApJ, 640, 441 [Google Scholar]
- Maxted, P. F. L., Anderson, D. R., Burleigh, M. R., et al. 2011, MNRAS, 418, 1156 [NASA ADS] [CrossRef] [Google Scholar]
- Miller Bertolami, M. M. 2016, A&A, 588, A25 [NASA ADS] [CrossRef] [EDP Sciences] [Google Scholar]
- Nandez, J. L. A., & Ivanova, N. 2016, MNRAS, 460, 3992 [Google Scholar]
- Salaris, M., Althaus, L. G., & García-Berro, E. 2013, A&A, 555, A96 [NASA ADS] [CrossRef] [EDP Sciences] [Google Scholar]
- Sand, C., Ohlmann, S. T., Schneider, F. R. N., Pakmor, R., & Röpke, F. K. 2020, A&A, 644, A60 [NASA ADS] [CrossRef] [EDP Sciences] [Google Scholar]
- Scherbak, P., & Fuller, J. 2023, MNRAS, 518, 3966 [Google Scholar]
- Strickler, R. R., Cool, A. M., Anderson, J., et al. 2009, ApJ, 699, 40 [NASA ADS] [CrossRef] [Google Scholar]
- Sun, M., & Arras, P. 2018, ApJ, 858, 14 [NASA ADS] [CrossRef] [Google Scholar]
- Tauris, T. M., & Dewi, J. D. M. 2001, A&A, 369, 170 [NASA ADS] [CrossRef] [EDP Sciences] [Google Scholar]
- Vigna-Gómez, A., Wassink, M., Klencki, J., et al. 2022, MNRAS, 511, 2326 [CrossRef] [Google Scholar]
- Zhang, Y., Chen, H., Chen, X., & Han, Z. 2021, MNRAS, 502, 383 [Google Scholar]
All Tables
All Figures
|
Fig. 1. Internal profiles of P/ρ, nuclear energy generation, specific entropy, and binding energy for a 1 M⊙ RGB pre-CE star with a H-free core mass of 0.271 M⊙. Colored regions indicate the convective envelope and the H-free core, with the core boundary defined at XH = 10−6. Arrows mark the estimated bifurcation point separating the remaining core from the ejected envelope. |
| In the text | |
|
Fig. 2. Internal structure of a 1 M⊙ pre-CE RGB star with an H-free core of 0.271 M⊙. The gray region corresponds to the envelope between the H-free core and the base of the convective zone, where the bifurcation point separates the future WD core from the ejected material. Dashed vertical lines indicate local criteria for selecting the bifurcation point: XH = 0.1, maximum nuclear energy generation rate, maximum compression, and binding energy and entropy conditions (see Fig. 1). Red and black lines show the H profile and its cumulative value, MH. The dark green line marks the innermost mass coordinate for which the residual MH is sufficient to produce envelope expansion induced by nuclear burning beyond 1 R⊙. The blue and cyan lines indicate the minimum MH required for residual H burning to significantly impact cooling, and for the occurrence of unstable H flashes, respectively. |
| In the text | |
|
Fig. 3. Initial H content mass after CE, MH, as a function of WD mass. The dashed red line marks the value of MH above which H burning releases sufficient energy to cause the envelope to expand beyond 1 R⊙. Models with larger MH are excluded from our sequences. The solid blue line separates sequences that undergo or avoid H-shell flashes. The green dashed line indicates the MH threshold below which residual H burning contributes less than 50% to the WD luminosity. The hatched green region shows the range of MH values excluded from our study. |
| In the text | |
|
Fig. 4. Adjustment time from CE ejection to maximum Teff vs. stellar mass. The dashed red line marks τadjust for sequences where envelope nuclear expansion reaches 1 R⊙. Non-flashing sequences (below the blue line) evolve rapidly to the WD cooling phase. The solid black line shows predictions from SRLOF mass transfer. |
| In the text | |
|
Fig. 5. Upper panel: Surface gravity vs. Teff for He WD sequences with minimum MH (no residual H burning). Green symbols mark CE He WDs (P<0.1 day) (Brown et al. 2020). Bottom panel: Evolutionary time since CE ejection vs. Teff. The smooth bend at intermediate temperatures arises from H diffusion from deeper layers, which increases gravity and age. |
| In the text | |
|
Fig. 6. Stellar mass (left panels) and cooling times (right panels) vs. log g and log Teff for post-CE non-flashing sequences with minimum MH (no H burning; top) and maximum MH (H burning; bottom). Green symbols mark CE He WDs (P<0.1 day) (Brown et al. 2020). Sequences with H burning show much longer cooling times, exceeding several Gyr at low log Teff, while those with minimum MH remain below 1 Gyr. In both cases, adjustment times after CE remain under 0.1 Myr. |
| In the text | |
|
Fig. 7. Effective temperature vs. cooling age for non-flashing sequences with maximum (red) and minimum (blue) initial MH from a CE phase. Insets show the fraction of WD luminosity from H burning. Solid black lines represent SRLOF cooling tracks (Althaus et al. 2013), where short-lived H flashes occur. Thin violet lines indicate intermediate MH values. Ages are measured from the start of the cooling branch. Horizontal dotted lines mark the Teff range of the observed He WDs reported in Table 2. |
| In the text | |
|
Fig. 8. Top: Surface gravity vs. Teff for observed He WDs with WD companions (P<0.1 day), likely from the CE channel (Brown et al. 2020). The color bar indicates the orbital period. Middle: Same systems evolved to the merger time, assuming the minimum initial MH (no H burning). Bottom: Same as the middle panel, but with the color bar indicating WD age at merger. He WDs with P≳0.07 day are expected to merge at Teff<8000 K, reaching ages of ∼2 Gyr. |
| In the text | |
|
Fig. 9. Surface gravity vs. Teff for non-flashing He WD sequences from a CE phase. Thick solid and dashed lines show minimum and maximum MH sequences, respectively, while thin lines indicate intermediate MH values. Green symbols mark CE He WDs (P<0.1 day) (Brown et al. 2020). |
| In the text | |
Current usage metrics show cumulative count of Article Views (full-text article views including HTML views, PDF and ePub downloads, according to the available data) and Abstracts Views on Vision4Press platform.
Data correspond to usage on the plateform after 2015. The current usage metrics is available 48-96 hours after online publication and is updated daily on week days.
Initial download of the metrics may take a while.