Fig. 7.
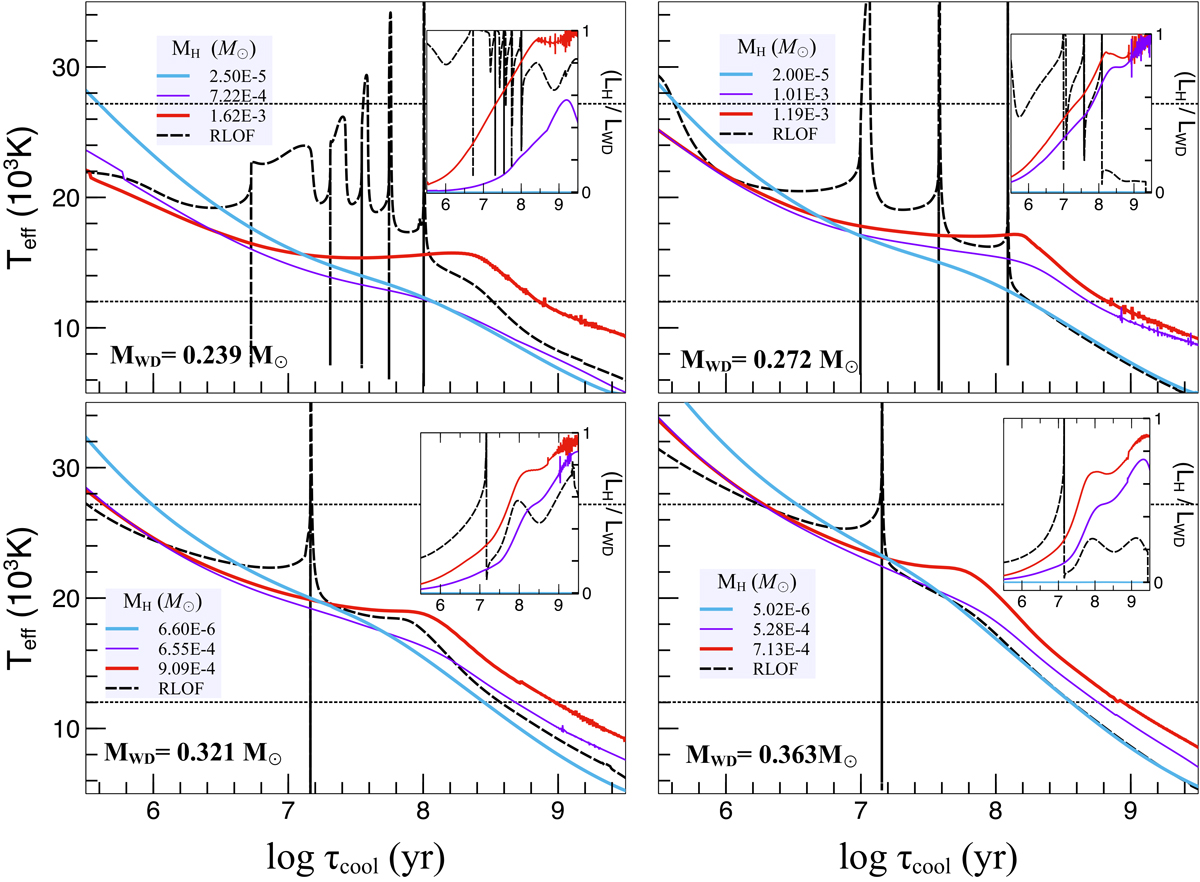
Download original image
Effective temperature vs. cooling age for non-flashing sequences with maximum (red) and minimum (blue) initial MH from a CE phase. Insets show the fraction of WD luminosity from H burning. Solid black lines represent SRLOF cooling tracks (Althaus et al. 2013), where short-lived H flashes occur. Thin violet lines indicate intermediate MH values. Ages are measured from the start of the cooling branch. Horizontal dotted lines mark the Teff range of the observed He WDs reported in Table 2.
Current usage metrics show cumulative count of Article Views (full-text article views including HTML views, PDF and ePub downloads, according to the available data) and Abstracts Views on Vision4Press platform.
Data correspond to usage on the plateform after 2015. The current usage metrics is available 48-96 hours after online publication and is updated daily on week days.
Initial download of the metrics may take a while.