Open Access
Fig. 4.
Download original image
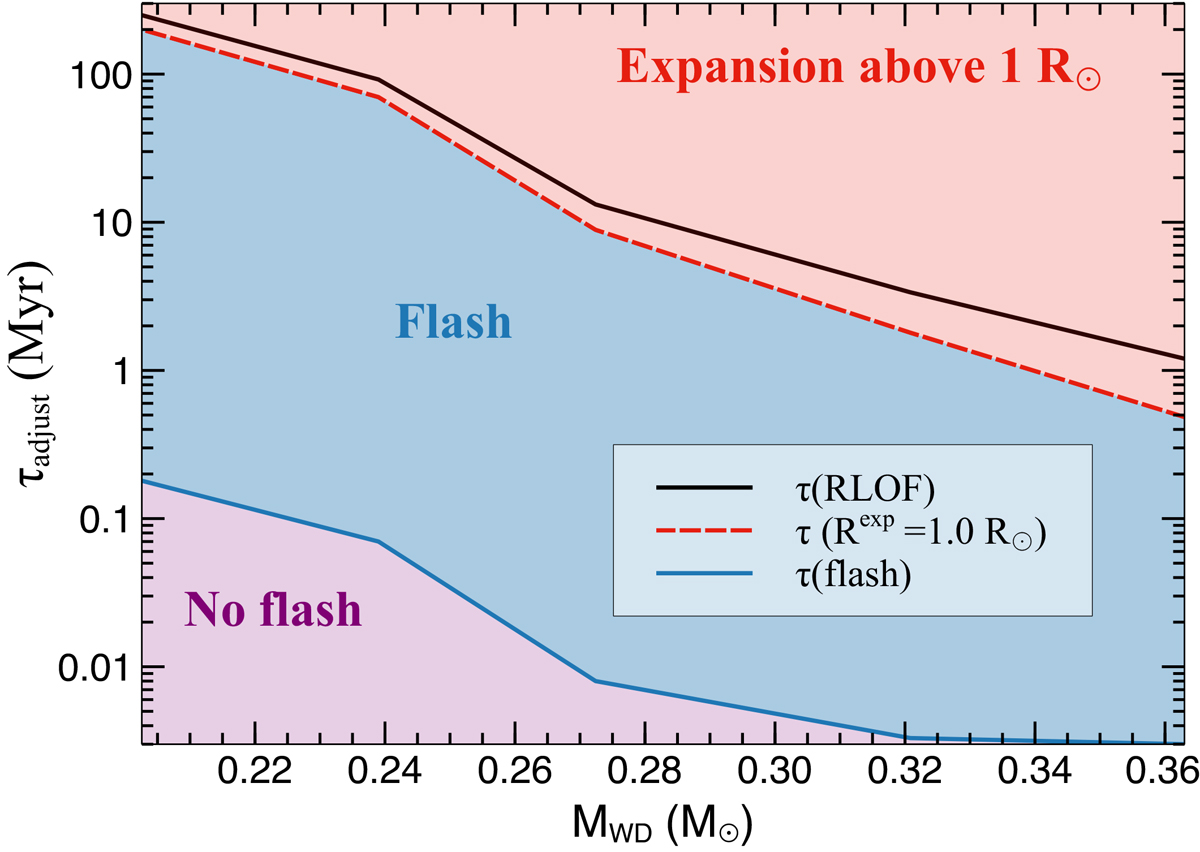
Adjustment time from CE ejection to maximum Teff vs. stellar mass. The dashed red line marks τadjust for sequences where envelope nuclear expansion reaches 1 R⊙. Non-flashing sequences (below the blue line) evolve rapidly to the WD cooling phase. The solid black line shows predictions from SRLOF mass transfer.
Current usage metrics show cumulative count of Article Views (full-text article views including HTML views, PDF and ePub downloads, according to the available data) and Abstracts Views on Vision4Press platform.
Data correspond to usage on the plateform after 2015. The current usage metrics is available 48-96 hours after online publication and is updated daily on week days.
Initial download of the metrics may take a while.