Fig. 6.
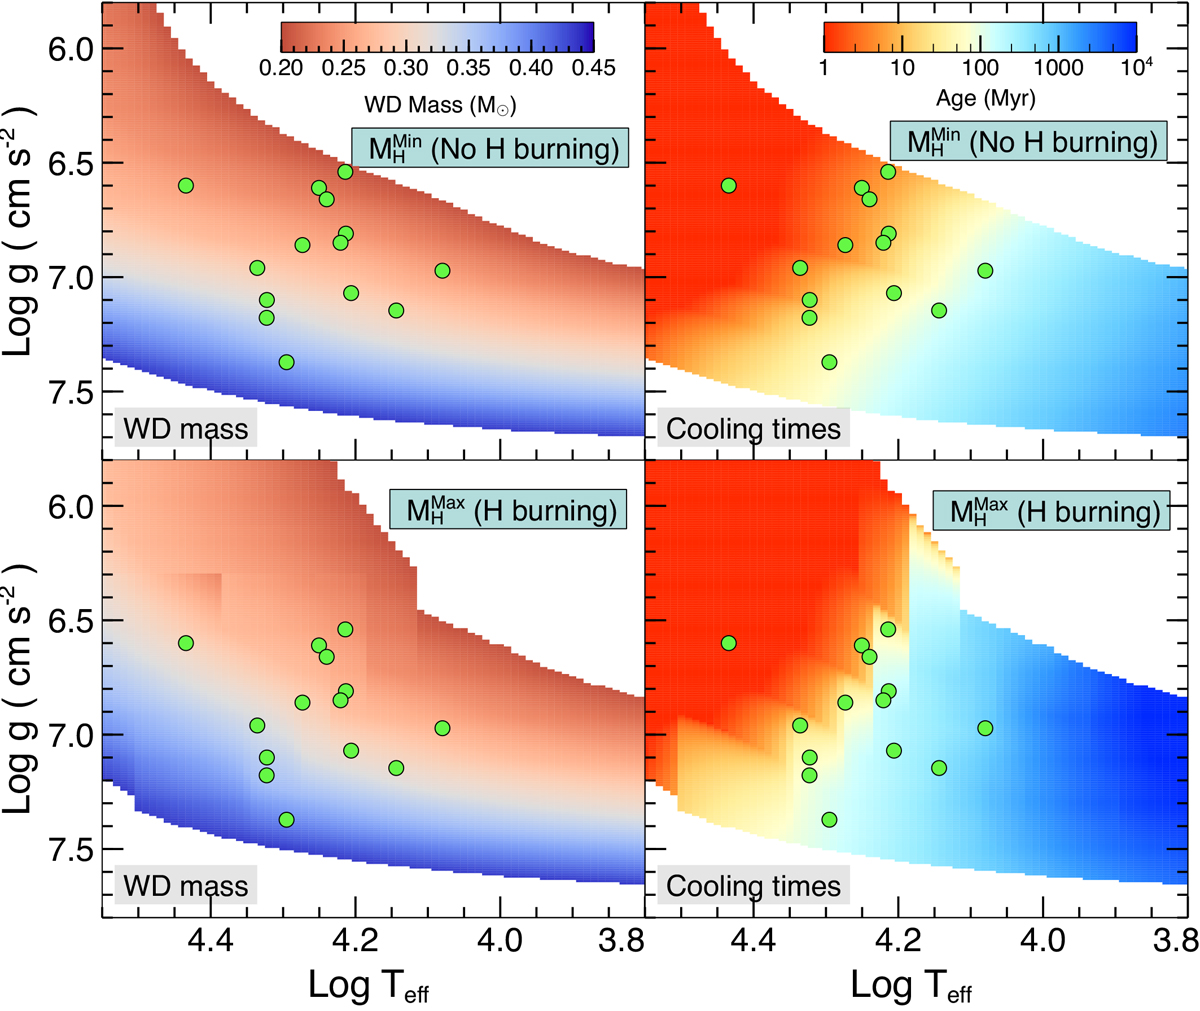
Download original image
Stellar mass (left panels) and cooling times (right panels) vs. log g and log Teff for post-CE non-flashing sequences with minimum MH (no H burning; top) and maximum MH (H burning; bottom). Green symbols mark CE He WDs (P<0.1 day) (Brown et al. 2020). Sequences with H burning show much longer cooling times, exceeding several Gyr at low log Teff, while those with minimum MH remain below 1 Gyr. In both cases, adjustment times after CE remain under 0.1 Myr.
Current usage metrics show cumulative count of Article Views (full-text article views including HTML views, PDF and ePub downloads, according to the available data) and Abstracts Views on Vision4Press platform.
Data correspond to usage on the plateform after 2015. The current usage metrics is available 48-96 hours after online publication and is updated daily on week days.
Initial download of the metrics may take a while.