| Issue |
A&A
Volume 699, July 2025
|
|
|---|---|---|
| Article Number | A12 | |
| Number of page(s) | 12 | |
| Section | Extragalactic astronomy | |
| DOI | https://doi.org/10.1051/0004-6361/202554847 | |
| Published online | 25 June 2025 | |
Mass-morphology relation of TNG50 galaxies
1
Facultad de Matemática, Astronomía, Física y Computación, UNC, Medina Allende s/n, X5000HUA Córdoba, Argentina
2
Instituto de Astronomía Teórica y Experimental, CONICET–UNC, Laprida 854, X5000BGR Córdoba, Argentina
3
Observatorio Astronómico de Córdoba, UNC, Laprida 854, X5000BGR Córdoba, Argentina
4
Department of Physics and Astronomy, University of Victoria, Victoria, BC V8P 5C2, Canada
5
Max-Planck-Institut für Astrophysik, Karl-Schwarzschild-Straße 1, D-85741 Garching, Germany
⋆ Corresponding author: This email address is being protected from spambots. You need JavaScript enabled to view it.
Received:
28
March
2025
Accepted:
6
May
2025
Abstract
We used the cosmological hydrodynamical simulation TNG50 to study the galaxy mass-morphology relation, as measured by the rotational support of the stellar component of simulated galaxies. For isolated galaxies with a stellar mass in the range of 8 < log(M*/M⊙) < 11, rotational support increases with M*, from dispersion-supported spheroidal dwarfs to massive galaxies with prominent, rotationally supported discs. Our results indicate that this correlation arises from the spatial distribution of star formation in TNG50 galaxies, which occurs primarily in two distinct regions: an unresolved, non-rotating central baryonic clump (r ≲ 1 kpc) and a rotationally supported outer disc, separated by a quiescent region. The importance of the inner clump increases with decreasing M*; it makes up less than 20% of all stars in the most massive galaxies, but more than 80% in dwarfs. This explains why dwarfs have less rotational support than massive galaxies and why all dwarfs have similar stellar half-mass radii, regardless of M*. It also explains why massive galaxies in TNG50 appear to form inside-out (as the outer disc grows), whereas dwarfs form outside-in, as star formation in the dominant inner clump moves progressively inward. The clump-disc segregation of star formation in TNG50 galaxies is probably numerical in origin. Inner clumps are formed by the accumulation of low-angular-momentum gas supported by the equation of state introduced to prevent artificial fragmentation. The decoupled-wind feedback implementation in TNG50 helps to preserve the clumps, but disrupts disc formation in its immediate surroundings. This hinders the formation of discs in (dwarf) galaxies whose sizes are not substantially larger than the clump, but it has little effect on the larger discs of more massive systems. Our results argue in favour of taking caution when interpreting the dependence on stellar mass of TNG50 galaxy morphologies, or the evolution of galaxy sizes, especially at the dwarf end.
Key words: galaxies: dwarf / galaxies: kinematics and dynamics / galaxies: star formation
© The Authors 2025
 Open Access article, published by EDP Sciences, under the terms of the Creative Commons Attribution License (https://creativecommons.org/licenses/by/4.0), which permits unrestricted use, distribution, and reproduction in any medium, provided the original work is properly cited.
This article is published in open access under the Subscribe to Open model. This email address is being protected from spambots. You need JavaScript enabled to view it. to support open access publication.
1. Introduction
Galaxy surveys including SDSS1 (York et al. 2000) and GAMA2 (Driver et al. 2011) have shown that the number of low-mass galaxies dominate the galaxy population (Kauffmann et al. 2003; Blanton et al. 2005; Li & White 2009; Baldry et al. 2012). Due to their low luminosity, studies of dwarf galaxies (defined as those with log(M*/M⊙) < 9) are generally limited to nearby regions, such as the Local Volume or the Local Group of galaxies (see e.g. Mateo 1998; Walter et al. 2008; Swaters et al. 2009; McConnachie 2012; McNichols et al. 2016).
Existing studies of dwarf galaxy morphology show that most dwarfs are irregular, with few examples of pure disc or spheroidal morphologies (see e.g. Karachentsev et al. 2013; Klypin et al. 2015). For example, Moffett et al. (2016) reported that irregular galaxies outnumber disc-like galaxies in the mass range of log(M*/M⊙)≲9.3, with the difference increasing at lower masses (see van den Bosch & Swaters 2001 and Swaters et al. 2009 for a study on late-type dwarf galaxies). Klypin et al. (2015), on the other hand, reported that only ∼10% of bright dwarf galaxies are spheroids.
The physical processes driving the morphological diversity of dwarf galaxies are not fully understood. Low-luminosity systems are expected to form in the shallow potential wells of low-mass dark-matter halos (see e.g. Moster et al. 2013; Adams et al. 2014; Oh et al. 2015; McNichols et al. 2016; Behroozi et al. 2019; Oman et al. 2019). This implies that the impact of baryonic processes such as stellar feedback is enhanced in dwarfs (see e.g. McQuinn et al. 2019; Gutcke et al. 2021; Ostriker & Kim 2022), possibly with strong effects on galaxy morphology. Dwarf galaxies thus provide an ideal test bed for models of star formation and evolution that aim to track the baryon cycle and its impact on galaxy formation and evolution (see e.g. Dekel & Woo 2003; Ferrarotti & Gail 2006; Christensen et al. 2016; El-Badry et al. 2017).
Direct numerical simulations have also struggled to consistently reproduce the diverse morphologies of dwarf galaxies observed in the Local Volume: a ‘weak tension’ regarding our understanding of dwarf galaxy evolution in the prevailing ΛCDM cosmological model (Sales et al. 2022). Key to resolving this tension is the study of the spatially resolved star formation activity in dwarfs, which differ from massive galaxies not only in their morphology, but also in the radial gradients of their stellar populations.
Massive disc galaxies, for example, tend to form inside-out, as later accreting material settles in the outer disc because of its higher angular-momentum content. Conversely, dwarf galaxies typically exhibit positive radial-stellar-age gradients, with their youngest and most metal-rich stars preferentially inhabiting the inner regions, while the oldest populate the outskirts (see e.g. Benítez-Llambay et al. 2016; Albers et al. 2019; Cheng et al. 2024; Fu et al. 2024; Riggs et al. 2024; Tau et al. 2024). How these differences in age gradients between dwarf and luminous galaxies arise is still unclear, but the morphological differences hint at the important role that rotational support may play in the process. Indeed, rotational support seems absent in the stellar components of the faintest galaxies known: the dwarf spheroidal companions of the Milky Way and Andromeda galaxies (see e.g. McConnachie 2012).
We seek to find out why rotational support plays a diminished role in the stellar component of dwarfs. It may be because gaseous discs are not established in these systems before stars form in earnest, or because the feedback effects of star formation itself act to disrupt thin, rotationally supported structures in the shallow potential wells of low-mass halos. It could also be the result of more complex, external effects such as the role of the environment through tidal or ram-pressure stripping, or galaxy mergers.
We used a state-of-the-art hydrodynamic cosmological simulation (TNG50, Nelson et al. 2019a; Pillepich et al. 2019) to investigate these issues. In particular, we aimed to study how the rotational support of the stellar component depends on galaxy mass. We also looked into how the spatial distribution of star formation drives the evolution of galaxy size and the morphology of isolated galaxies, with the goal of understanding the physical origin of such trends.
This paper is organised as follows. In Sect. 2, we present details of the simulation used and of the galaxy sample studied. We also introduce the definition of galaxy rotational support adopted throughout this work. In Sect. 3, we analyse the spatially resolved morphology of isolated galaxies of different masses and use them to motivate and interpret the observed trends between galaxy mass, size, and rotational support, as well as the evolution of galaxy sizes. Finally, in Sect. 4, we summarise our results and present our conclusions.
2. Methods
2.1. Simulation
For this study, we used The Next Generation Illustris simulations (IllustrisTNG3, Marinacci et al. 2018; Naiman et al. 2018; Pillepich et al. 2018a; Springel et al. 2018; Nelson et al. 2019b), a suite of magneto-hydrodynamic cosmological simulations of a standard ΛCDM Universe (h = 0.6774; Ωm = 0.3089; σ8 = 0.8159, consistent with Planck Collaboration XIII 2016). From initial conditions set at redshift z = 127, the simulations were evolved with the moving mesh code AREPO (Springel 2010; Pakmor et al. 2016) forward in time until z = 0, and the properties of dark-matter and baryon particles are systematically recorded in 100 snapshots at intervals of ∼0.15 Gyr.
Our analysis focuses on simulated galaxies identified in the TNG50-1 run (Nelson et al. 2019a; Pillepich et al. 2019, TNG50 hereafter), a 51.7 Mpc side periodic box containing 21603 particles of dark matter of mass mDM = 4.5 × 10⁵ M⊙, and an equal number of initial gas cells with a ‘target baryon mass’ of mbaryon = 8.5 × 10⁴ M⊙. The Plummer-equivalent gravitational softening for DM and stars is ϵDM, * = 0.29 kpc, and the minimum value of the adaptive gas gravitational softening is ϵgas = 0.07 kpc (at redshift z = 0).
The baryonic treatment included in TNG50 (updated from the previous Illustris project, Vogelsberger et al. 2013, 2014; Weinberger et al. 2017; Pillepich et al. 2018a) allows the gas to cool down to a temperature of T = 104 K following the cooling and heating rates computed from local density, redshift, and metallicity. The gas above density n = 0.13 cm−3 was modelled using an effective equation of state to describe a dual-phase interstellar medium gas that prevents artificial fragmentation (Springel & Hernquist 2003). Star formation occurs in gas cells above this density threshold. Stellar particles are born through a Chabrier initial mass function (Chabrier 2003), with their subsequent stellar evolution and feedback implemented following the prescriptions described in Pillepich et al. (2018a).
2.2. Simulated galaxies
Galaxy catalogues were generated using the friends-of-friends (FoF, Davis et al. 1985) and SUBFIND algorithms (Springel et al. 2001; Dolag et al. 2009). We also used the merger tree obtained with the SUBLINK algorithm (Rodriguez-Gomez et al. 2015) to track the temporal evolution of galaxies.
We restricted our analysis to isolated galaxies (i.e. central galaxies of their own FoF group) with a stellar mass of 8 < log(M*/M⊙) < 11. We removed ongoing mergers by excluding galaxies with a satellite of stellar mass higher than 10% of its central host. We also excluded backsplash systems that, at some point in their evolution, were part of a massive group or cluster. We computed galaxy properties, such as stellar mass and size, by defining all particles and cells within rglx = 0.15 r200 of the halo centre, where r200 is the virial4 radius.
2.3. Galaxy kinematic morphology
The morphology of a simulated galaxy can be quantified using the kinematics of its stellar component. We used the fraction of kinetic energy invested in ordered rotation, κrot (Sales et al. 2012), as an estimate of rotational support, which is defined as follows:
 (1)
(1)
where K = ∑m|v|2/2 is the sum of the kinetic energy of all stellar particles of the galaxy; jz is a star particle’s specific angular-momentum component perpendicular to the disc plane5 and R its cylindrical galactocentric distance.
As shown in Sales et al. (2012), this estimator strongly correlates with the fraction of stars with a high orbital circularity parameter ϵj = jz/jcirc(E) (Abadi et al. 2003); higher values of κrot are associated with a more prominent disc-like component. An arbitrary threshold value of κrot = 0.5 is often used to distinguish rotation-dominated galaxies from dispersion-dominated ones (see e.g. Rodriguez-Gomez et al. 2017; Du et al. 2021, 2022).
3. Results
3.1. Morphological components
As illustrative examples, we show face-on and edge-on projections of the stellar (upper panels) and gaseous (lower panels) components of four isolated TNG50 galaxies at redshift z = 0 in Figure 1. These galaxies were chosen to have κrot close to the median value at given stellar mass (see Sect. 3.2). Stellar mass (and κrot) increases from left to right (galaxies A, B, C, and D). We indicate both rglx = 0.15 r200 (cyan circle) and r = 1 kpc (orange circle) in each panel. The former effectively defines the central galaxy as adopted throughout this work; the latter is a fixed physical radius that encloses a dense central baryonic clump found in the innermost region of most TNG50 galaxies at z = 0. The total stellar mass, total gas mass and κrot of each galaxy are shown in the labels of Figure 1.
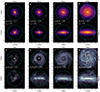 |
Fig. 1. Face-on and edge-on projections of stars (top panels) and gas (bottom panels) in four TNG50 central galaxies with varying stellar mass and rotational support. From left to right, galaxies increase in total stellar mass M*, total gas mass Mgas, and rotational support κrot (values are shown in white labels). Cyan circles indicate our definition of galaxy size rglx = 0.15 r200; orange circles mark r = 1 kpc. Extended gaseous and stellar discs are more clearly evident in the two most massive galaxies (C and D). All galaxies exhibit a dense baryonic clump (gas and stars) in the central regions of r ∼ 1 kpc. The TNG50 Subhalo_IDs for these galaxies are: 830875 (A), 792447 (B), 733632 (C), and 643257 (D). Brighter colours indicate a higher number density of particles. Images were generated with PySPHViewer (Benítez-Llambay 2017). |
As anticipated, low values of κrot denote amorphous stellar morphologies without a well-defined disc. High values of κrot, on the other hand, indicate systems where a co-planar, rotationally supported disc of stars dominates the morphology ofa galaxy.
The spatial distribution of the gas is particularly revealing, especially when seen face-on. Three different regions can be clearly distinguished: (i) a dense ∼1 kpc inner clump at the centre; (ii) a flattened and extended outer disc-like component; and (iii) a gap between clump and disc. These morphological components are clearly delineated in the gas component of each of these galaxies and are surrounded by a more tenuous, irregularly shaped gaseous envelope.
Although these gas components can be seen in all four galaxies, their relative prominence varies from galaxy to galaxy. As expected from the values of κrot, the disc component grows in importance with increasing stellar mass, from practically non-existent in galaxy A, to clearly dominant in galaxy D. On the other hand, the central clump is seen to have similar size in all galaxies, regardless of mass, while the gap between clump and disc is particularly obvious in galaxy B. These trends suggest a close link between the spatial distribution of the gas and the rotational support of a galaxy, as we discuss next.
3.2. Rotational support versus galaxy stellar mass
We begin by exploring the galaxy-mass dependence on the rotational support of the stellar component (shown in Figure 2). Here, each galaxy is represented with a circle and coloured according to the fraction of its stellar mass enclosed within 1 kpc of the centre (f*, < 1 = M*, < 1/M*), or, in other words, by the mass fraction attached to the dense inner clump discussed in the previous subsection. The solid black line and the shaded regions indicate the median trend, as well as the 25th and 75th percentiles. The coloured squares correspond to the four example galaxies shown in Figure 1 (galaxies A, B, C, and D).
This figure shows a strong positive correlation between κrot and M*, except for the most massive galaxies (i.e. log(M*/M⊙) > 10.3), where there is a hint of a decrease in κrot as M* keeps increasing. This change in trend is driven by the increasing importance of late major mergers in shaping the most massive galaxies, and by the effects of the energetic feedback from active galactic nuclei (AGNs; see e.g. Naab et al. 2014; Genel et al. 2015; Rodriguez-Gomez et al. 2017; Sotillo-Ramos et al. 2022).
The main takeaway point of Figure 2 is, however, the strong stellar-mass dependence of galaxy morphology, as measured by κrot. Broadly speaking, most – if not all – dwarf (i.e., log(M*/M⊙) < 9.0) galaxies in TNG50 are dominated by a non-rotating spheroidal component, whereas the majority of massive galaxies have rotationally supported discs.
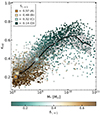 |
Fig. 2. Galaxy morphology estimator κrot as function of stellar mass for 3824 isolated galaxies from TNG50. Each galaxy is represented with a circle coloured according to the fraction of stellar mass enclosed within 1 kpc of its centre: f*, < 1 = M*, < 1/M*. We indicate the median and the 25th-75th percentiles with a solid black line and shaded region. Filled squares highlight the four example galaxies (A, B, C, and D) shown in Figure 1. Ordered rotation increases monotonically with stellar mass in the 8.0 < log(M*/M⊙)≲10.3 range, with dwarf galaxies typically having κrot ≲ 0.4. The colour gradient shows that inner regions become more dominant at lower stellar masses, reaching f*, < 1 > 0.5, and these galaxies exhibit the lowest rotational support of the sample. At fixed stellar mass, κrot is anti-correlated with the stellar-mass fraction in the inner regions f*, < 1. |
The origin of this trend is not immediately obvious. One may posit, for example, that gaseous star forming discs are unable to form in dwarfs, and that stars in dwarfs perhaps form in dense clouds before the gas has a chance to coalesce onto a disc. Galaxy B, however, provides a clear counter-example; this system has a distinctive, star forming gaseous disc, yet the stellar component, taken as a whole, barely rotates (i.e. κrot = 0.24).
In other words, gaseous discs do form in TNG50 dwarfs, but somehow this does not lead to prominent stellar discs as in more massive systems. The next question thus concerns why disc formation is less efficient in dwarfs. Galaxy A hints at an answer. There is very little gas in this galaxy outside the inner clump, and the morphology of that gas suggests that it is disturbed and out of equilibrium.
Closer examination shows that the outer disc in Galaxy A has indeed been disturbed by feedback energy from young stars in the inner clump, which, because of the decoupled-wind6 strategy adopted in TNG50, is dumped outside the clump. This feedback energy is important enough to blow a gap between gas in the inner clump and outer disc in more massive galaxies (see e.g. galaxy B or C), but in dwarfs, where discs tend to be smaller, feedback disrupts incipient discs.
As a consequence, most stars in dwarfs form in the non-rotating inner clump, leading to compact systems with little rotational support. Discs tend to be more resilient in more massive systems because those discs are more extended and massive, so the ‘gaps’ blown by feedback from the inner clump have limited, or little, effect overall.
Further evidence for this interpretation may be found in the strong correlation between f*, < 1 and κrot, which can be seen from Figure 2 and is shown in the bottom panel of Figure 3. Clearly, the higher the importance of the inner clump, the lower the rotational support of the galaxy. Since galaxy mass correlates strongly with f*, < 1, rotational support correlates strongly with M*. Indeed, as shown in the top panel of Figure 3, f*, < 1 correlates inversely with M*, varying from roughly unity at the low-mass end to 0.1–0.2 at the massive end.
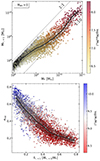 |
Fig. 3. Top panel: Stellar mass enclosed within 1 kpc of galaxy centre (M*, < 1) as a function of total stellar mass (M*), coloured according to the central black-hole mass. In the dwarf regime, most galaxies do not harbour a central massive black hole due to the seeding procedure of TNG50, and we identify them with grey crosses. The dashed grey lines show the 1:1 and 1:10 ratios, indicating that low-mass galaxies have most of their stellar mass enclosed within 1 kpc, while at higher masses the inner region represents roughly 0.1–0.2 of the total mass. Bottom panel: Galaxy morphology parameter κrot as function of enclosed stellar-mass fraction, f*, < 1, coloured according to total stellar mass. The solid black lines and shaded regions indicate the median and the 25th-75th percentiles. At low stellar masses (redder colours), the inner regions become more dominant. Rotational support is anti-correlated with the fraction of stellar mass in the inner regions. |
The importance of the central clump as a function of M* is clearly shown in the top panel of Figure 3. Simulated galaxies are shown coloured according to the mass of the central black hole (MBH), which increases with increasing M*. At fixed stellar mass, galaxies with higher MBH tend to have higher stellar mass enclosed within 1 kpc (M*, < 1), although the mass of the central black hole makes up typically a negligible fraction (∼0.1%) of M*. Most TNG50 dwarfs have no central black hole and are shown with small grey crosses. We conclude that black holes do not play a significant role in the galaxy mass-morphology relation shown in Figure 2.
The picture that emerges is thus one where the importance of the inner clump is the key ingredient that determines the rotational support of the stellar component of a TNG50 galaxy. In dwarfs, star formation proceeds mainly or solely in the inner, non-rotating clump, the feedback of which in turn effectively prevents outer gaseous discs from forming. In more massive systems, the importance of the inner clump decreases, and the outer disc component is able to grow and dominate the galaxy’s morphology.
Critical to this interpretation is that the size of the inner clump should be roughly independent of galaxy mass, which would explain why it becomes less and less significant in more extended (massive) systems. We explore this issue next.
3.3. Star formation radial profiles
Figure 4 shows the star formation rate (SFR) radial profile7 for the four example galaxies presented in Figure 1. Lines are colour-coded for each galaxy as in Figure 2. The top panel shows the four SFR profiles at z = 0, whereas the bottom panel is analogous to the top, but for z = 1.3.
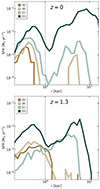 |
Fig. 4. Star formation rate (SFR) profiles for the example galaxies (A, B, C, and D) from Sect. 2 at z = 0 (cosmic time t = 13.8 Gyr, top panel) and at z = 1.3 (t = 4.8 Gyr, bottom panel). Colours are as for the squares in Figure 2: from brown for galaxy A (lowest stellar mass and κrot) to green for galaxy D (highest mass and rotational support). In the presence of a star forming inner clump, the profiles show a relatively quiescent zone between 1 kpc and 2 kpc that separate the central region with the outer gaseous disc. The latter is more extended and more star forming at higher masses, while the size of the unresolved clump evolves slightly. We indicate a galactocentric distance of r = 1 kpc, encompassing most inner star formation, with a grey, dashed vertical line. |
Note that the three morphological features of the gas distribution discussed above are clearly reflected here. All four galaxies have an ∼1 kpc-sized star forming inner clump, independent of galaxy mass, and an outer star forming disc (except for galaxy A, where the outer disc is not forming stars at z = 0). The clump size does not seem to evolve with time; indeed, it is roughly 1 kpc in radius in all four galaxies at z = 1.3 (bottom panel in Figure 4). Only galaxy B has a less well-defined inner clump at z = 1.3, suggesting that the clump is a feature that grows more massive and more clearly defined with time. The inner clump and the outer disc are separated by a gap driven by the feedback energy of young stars in the inner clump, as we discuss below in Sect. 3.5.
3.4. Rotational support of young stars
The gas morphology of the four example galaxies shown in Figure 1 suggests that young stars that form outside of the central clump do so in rotationally supported discs. This is shown more clearly in Figure 5, where we plot face-on and edge-on projections of the young stars (i.e. younger than 1 Gyr) of the four galaxies at z = 0.
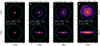 |
Fig. 5. Face-on and edge-on projections of young stars (defined as those with an age < 1 Gyr at redshift z = 0) in the four illustrative examples shown in Figure 1 (from left to right, galaxies A, B, C, and D). White labels indicate the mass and rotational support of the young stellar component for each galaxy ( |

These examples illustrate that, outside the central clump, stars form in discs, confirming the interpretation that the low values of κrot in dwarf galaxies result not from the fact that gaseous discs cannot form in such systems, but rather because in those systems the majority of stars form in the non-rotating central clump. The case of galaxy A also suggests that outer star forming discs may be short-lived in dwarfs, and easily disrupted by feedback from the inner clump.
This interpretation is consistent with the kinematics of young stars in the four example galaxies, as shown in Figure 6, where we plot the tangential velocity vϕ = jz/R of all young stars (purple circles). The circular velocity  is also shown with a dashed black line. The bottom panels show the radial profile of the median vϕ, in units of the circular velocity. This figure makes it clear that young stars born in the inner clump exhibit negligible rotation, while those in the outer regions show tangential velocities generally consistent with the circular velocity, albeit with considerable scatter.
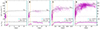 |
Fig. 6. Rotation velocity vϕ = jz/R of young stars (i.e. ages < 1 Gyr, magenta dots) and circular velocity |
Figure 7 shows that the results discussed above for the four example galaxies actually apply to the whole TNG50 galaxy population. This figure shows κrot versus M* and is analogous to Figure 2, but splitting stars into components according to age and radius. Solid lines (and shaded areas) refer to the full TNG50 galaxy population. Black denotes that we used all stars in each galaxy, whereas magenta shows that we restricted the computation to stars younger than 1 Gyr. Dashed lines correspond to stars outside the inner clump; i.e., r > 1 kpc. The difference between solid and dashed magenta curves confirms that young stars outside the inner clump form in roughly rotationally supported structures.
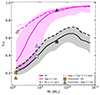 |
Fig. 7. Rotational support parameter κrot as function of galaxy stellar mass. Solid and dashed lines show results for stars within the galactic radius (r < rglx = 0.15 r200) and in the outer regions (r > 1 kpc), respectively. Black lines represent all stars, while magenta lines represent young stars (i.e. age < 1 Gyr). Young stars in the outer regions (magenta dashed line) have κrot > 0.7 and tend to be rotation-supported in all galaxies. Conversely, young stars as a whole (solid magenta line) are non-rotating at low masses (κrot < 0.5); this is because in these systems most stars form in the central, non-rotating clump. Symbols correspond to galaxies A, B, C, and D, identified according to colour (as in Figure 2; squares: κrot; triangles: κrot, young). A thinner magenta line indicates results when only galaxies with at least 50 young stars in the outer regions are included in the analysis. |
Such stars, however, make up a minority of all young stars in dwarfs, which are heavily dominated by the inner clump. As a result, ordered rotation is negligible in most dwarfs. One may worry that there are too few young stars with r > 1 kpc to compute κrot, young reliably at the faint end. The thin, dashed magenta line of Figure 7 shows results where we only used galaxies with a minimum of 50 young stars in the outer regions; this confirms that young stars in the outer regions are indeed formed in rotationally supported structures.
3.5. Inner clump structure and evolution
It is clear from the above discussion that the present-day morphology of TNG50 galaxies, and dwarfs in particular, is critically dependent on the structure of the inner clump. Therefore, it is important to understand the structure of the clump and its evolution. Figure 8 shows, as a scatter plot, the radial velocity of gas cells and star particles as function of radius for galaxies B and C, which were chosen as illustrative examples.
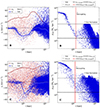 |
Fig. 8. Left panels: Radial velocity of stars (red) and gas (blue) for galaxies B and C at redshift z = 0, which were chosen as illustrative examples. The solid blue curve indicates the median radial velocity of gas cells at a given radius; the dashed red curve indicates the radial velocity dispersion of star particles. Right panels: Gas cell density versus galactocentric distance. The solid black horizontal line shows the density threshold for star formation (ρmin, SF ≈ 3.5 × 10⁶ M⊙ kpc−3). The dashed horizontal line indicates the minimum wind-recoupling density, defined as ρw, recouple = 0.05 × ρmin, SF. The minimum radius where recoupling may occur (i.e. where a gas cell falls below ρw, recouple) is indicated with a dashed red vertical line. Note that the quiescent zone between the inner clump and the outer disc roughly coincides with the ‘recoupling radius’, indicating that the star formation gap is caused by feedback winds. |
In this figure, radial velocity profiles are shown for gas (in blue) and stars (in red) in the left panels, whereas gas-density profiles are shown as scatter plots in the right hand panels. The horizontal lines indicate the threshold density for star formation (thin, solid black line: ρmin, SF) as well as the density where feedback-driven winds are allowed to re-couple with the interstellar medium (thick, dashed black line: ρw, rec = 0.05 × ρmin, SF).
Inside ∼1 kpc, the gas is dense enough to be star forming, and it appears to be near hydrostatic equilibrium (i.e. almost at rest and pressure-supported), except for hints of ongoing accretion at the clump’s edge. On the other hand, stars are supported by their random motions. The stellar radial velocity dispersion is shown, as a function of radius, by the dashed red curve in Figure 8. As shown in the previous subsection for young stars, there is no detectable rotational support for gas in the inner clump.
The inner clump, gap, and outer disc are clearly noticeable in this panel. The coincidence between the gas density just outside ∼1 kpc and the wind recoupling density clearly suggests that it is feedback energy from star formation in the inner clump that carves the gap between the inner clump and outer disc. These winds are responsible for the gap and may also lead to the full disruption of the outer disc in galaxies where the disc has a size comparable to the gap, as is the case for the smallest galaxies in our sample.
We tracked the inner-clump evolution for the whole galaxy population using the simulation’s SUBLINK merger trees. We followed the main progenitors of each galaxy through cosmic time in the 1.5 ≲ t/Gyr ≲ 13.8 range (corresponding to the redshift interval 4 ≳ z ≳ 0) and measured the gas and stellar mass of their inner clump, defined at all times as simply the region enclosed within r = 1 (physical) kpc.
We then grouped galaxies by their z = 0 stellar mass, stacking them in 0.5 dex bins. The curves in Figure 9 show the evolution of the median enclosed stellar (dashed) and baryonic (solid) mass of the inner clumps. Lower mass bins are shown by redder colours. Higher mass bins are shown in bluer coloured circles at t ≈ 13.5 Gyr indicating the median stellar mass M* of each bin.
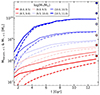 |
Fig. 9. Evolution of median baryonic (solid lines) and stellar mass (dashed lines) in the inner clump (i.e. enclosed within 1 physical kpc) for stacks of galaxies in 0.5 dex M* bins. Lines are colour-coded by total stellar mass at redshift z = 0. The median M* of each bin is shown by the solid circles plotted at t ≈ 13.5 Gyr. The inner clump mass grows gradually in lower-mass galaxies (redder colours), indicating significant gas infall into their central regions and ongoing star formation. The inner clumps of more massive galaxies form early and have little gas left at z = 0. |
In massive galaxies, the inner clump grows quickly and stagnates relatively early; so, by z = 0, the clump has transformed essentially all of its baryons into stars. On the other hand, in dwarfs the clump seems to accrete baryonic mass more continuously. These baryons are transformed less efficiently into stars so that, at z = 0, nearly half of the inner baryonic mass is in the form of gas.
The relative importance of the inner clump also evolves differently depending on galaxy mass, as shown in the left hand panel of Figure 10. The clump’s relative importance decreases with time in massive galaxies and increases in dwarfs. This has a knock-on effect on the evolution of galaxy sizes (middle panel of the same figure). Massive galaxies grow with time as young stars form progressively at larger radii, whereas star formation in dwarfs moves inward with time as the inner clump becomes more dominant.
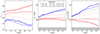 |
Fig. 10. Evolution of i) stellar-mass fraction within r < 1 kpc, f*, < 1 (left panel); ii) median stellar half-mass radius, r50, * (centre panel); and iii) median half-mass radius of young stars (i.e. age < 1 Gyr), r50, young (right panel), for the same stacks of galaxies in 0.5 dex M* bins shown in Figure 9. Higher mass galaxies (bluer) show a decreasing enclosed stellar-mass fraction as newly formed stars are born at progressively larger radii, which is consistent with inside-out galaxy growth. Conversely, low-mass galaxies (redder) appear to become increasingly centrally concentrated, with an outside-in trend where newly formed stars are found at progressively smaller galactocentric radii. |
The effect is even more pronounced when tracking only ‘young stars’ (i.e. those younger than 1 Gyr at any given time), as shown in the right hand panel of Figure 10. Interestingly, in dwarfs, the radius that contains half of young stars moves inwards; as more of the inner clump’s gas is transformed into stars, the star forming region inside the clump shrinks, leading to the formation of compact stellar cores, which, in some cases, can dominate the stellar population of a galaxy.
Since star formation occurs only in the central clump or in an outer gaseous disc, the size of the young stellar component is determined by the relative prevalence of these two regions. For example, the seemingly flat evolution shown by the 8.5 < log(M*/M⊙) < 9.0 (second reddest line) galaxy bin results because the central clump dominates in half of the systems, whereas the outer disc dominates in the other half, roughly cancelling out the radius evolution.
The origin of the central clumps warrants further consideration. Their existence implies mechanisms capable of efficiently channelling significant amounts of gas towards the galactic centre, which may arise from a complex interplay of physical factors such as the infall of low-angular-momentum gas through accretion, outward-angular-momentum transport via non-axisymmetric structures such as bars and spiral arms, feedback-driven turbulence, and numerical effects such as artificial viscosity within the gas or energy deposition of stellar feedback in the interstellar medium. Disentangling the precisecontribution of each of these effects is a challenge that requires a dedicated study, which we defer to a future contribution.
3.6. Galaxy stellar mass-size relation
The relative importance of the inner clump discussed above also explains why TNG50 dwarfs have roughly the same stellar half-mass radius, r50, *. As Figure 11 shows, the stellar half-mass radius seems to ‘converge’ to ∼1 kpc at low masses; intriguingly, there also appears to be a ‘tongue’ of dwarfs with unusually low values of r50, *, reaching values as small as 0.2 kpc (smaller than the gravitational softening length) at log(M*/M⊙)∼9.
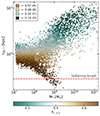 |
Fig. 11. Stellar half-mass radius (r50, *) as function of stellar mass (M*) for our sample of central TNG50 galaxies, extended to log(M*/M⊙) = 7 (virial masses down to log(M200/M⊙)∼10). Each galaxy is represented with a circle coloured according to the fraction of stellar mass enclosed within 1 kpc of its centre f*, < 1 = M*, < 1/M*. Coloured squares highlight galaxies A, B, C, and D from Figure 1. We note that the stellar-mass-size relation seems to ‘converge’ to ∼1 kpc in the dwarf regime, with a secondary population of unusually compact galaxies that reach a very small r50, * at log(M*/M⊙)∼9. These galaxies reach sizes comparable to the gravitational-force softening length for stars and dark-matter particles (0.29 kpc at redshift z = 0) and correspond to systems where the central clump dominates not only the galaxy stellar mass budget, but also the total mass budget within 1 kpc. See text for further discussion. |
This tongue is made out of systems where the central clump not only dominates the stellar budget, but it is also massive enough to become self-gravitating. Such systems slip down the tongue as the gas component shrinks and is gradually transformed into stars. The colour-coding in Figure 11 supports this interpretation and shows that the tongue contains almost exclusively clump-dominated systems with large values of f*, < 1. In addition, we checked that the baryonic mass of central clumps in tongue systems is large enough to be comparable to (or exceed) the dark mass within 1 kpc, a feature that distinguishes them from other galaxies of comparable M* (and larger r50, *).
Both the flat dependence of r50, * at low M* and the presence of the tongue are highly suggestive of an artefact caused by a combination of limited resolution as well as the particular sub-grid implementation of interstellar-medium physics, star formation and feedback in TNG50. A simple confirmation of this is provided by results from TNG100, which is a larger volume, lower resolution simulation that uses the same sub-grid physics implementation as TNG50. The analogous figure for TNG100 is shown in Figure A.1. As expected from a numerically driven feature, TNG100 galaxies show a similar flattening of the radius-mass relation at low M* and the presence of a similar tongue, but it is shifted to larger values of galaxy mass and radius.
Finally, we comment on the idea that the flattening of the r50, *-M* relation may be driven by collisional effects between dark matter and stars due to the finite number of particles in low-mass systems. This was argued by Ludlow et al. (2023) to explain the resolution dependence of low-mass galaxy sizes in the EAGLE simulation series. Although these authors make a compelling case, their interpretation does not seem to apply to TNG50. In particular, the presence of a tongue feature where size decreases with increasing M* would not be expected in such an interpretation. In TNG50 at least, the flattening of r50, * at low M* seems to be due to the formation of the central clump, rather than to collisional effects between dark matter and star particles.
4. Summary and conclusions
We used the TNG50 hydrodynamic cosmological simulation to investigate the rotational support of the stellar component of simulated galaxies. We find that the degree of rotational support (quantified by the parameter κrot) correlates strongly with galaxy stellar mass (in the range of 8 < log(M*/M⊙) < 11), mainly from dispersion-dominated dwarfs to massive galaxies with prominent centrifugally supported discs.
This correlation results from the spatial distribution of gas and, consequently, of star formation in simulated galaxies. Star formation profiles are clearly bimodal, with an unresolved, non-rotating dense clump in the inner regions (r < 1 kpc) and an extended outer disc (r > 2 kpc). These two regions are separated by a relatively quiescent intermediate zone (a ‘gap’). The relative importance of one region over the other influences the morphology of a galaxy and its rotational support: in massive galaxies the inner clump is relatively unimportant, and, therefore, such galaxies evolve mainly by forming stars in extended discs. On the other hand, the inner clump dominates star formation in dwarf galaxies, which, as a consequence, end up as dispersion-dominated spheroidal systems.
The gaseous inner clump is formed out of low-angular-momentum and pressure-supported gas that becomes dense enough to begin forming stars. These clumps have a typical size of ∼1 kpc, regardless of time or galaxy mass, hinting that it is an artefact of limited resolution and the sub-grid treatment of dense gas in TNG50. The clumps are resilient to disruption, likely because the decoupled-wind feedback scheme adopted in TNG50 dumps the energetic output of young stars in the clump into its surroundings, creating the gap between the inner regions and the outer disc. In dwarfs, this feedback energy can disrupt the outer disc or prevent its assembly altogether, leaving the clump as the sole – or main – dwarf-galaxy star forming region.
The relative importance of the inner clumps also has consequences regarding the galaxy mass versus size relation, as well as the radial build-up of galaxies. Nearly all TNG50 dwarfs with M* < 108.5 M⊙ have the same size, with stellar half-mass radii comparable to the size of the inner clump (i.e., about ∼1 kpc). In addition, these dwarfs appear to form from the outside in, with younger stellar populations forming closer to the centre as gas in the inner clump is gradually transformed into stars.
On the other hand, the size of massive galaxies, where the inner clump prevalence is less significant, or negligible, grows with increasing mass. As a consequence, massive TNG50 galaxies appear to form from the inside out, as star formation moves outward in the centrifugally supported outer discs that dominate their morphology.
Our results suggest caution should be taken when interpreting the evolution of the mass, size, and morphology of the TNG50 galaxy population, especially when using samples that contain a substantial fraction of dwarfs. The highly concentrated, unresolved baryonic clumps located at the centre of TNG50 galaxies are most likely an artefact of limited resolution and of the particular numerical implementation of star formation adopted in these simulations, which future improvements should correct. Conclusive answers to questions regarding what sets the morphology and rotational support of a galaxy, and if dwarf in particular, will probably have to wait until such improvements become available.
Throughout this paper, virial quantities are defined at the radius enclosing 200 times the critical density for closure.
We define the disc plane of a galaxy using the angular momentum of their young stars, with ages under 1 Gyr.
Whenever star formation occurs, stellar feedback is implemented as supernova events that create wind particles. These receive an initial wind velocity and are temporarily decoupled from the magnetohydrodynamic equations until one of the following conditions is met: i) a time of Δt = 0.025 tHubble has elapsed (where tHubble is the age of the Universe when the star formation occurs); or ii) the wind particle has reached a gas cell with a density of ρcell ≤ 5% of the density threshold for star formation. In TNG50, condition ii) is almost always met first (for a more comprehensive analysis of the model, see Vogelsberger et al. 2013; Pillepich et al. 2018a).
We measured the total SFR in each of 40 log-spaced radial shells between 0.06 and 25 kpc.
Acknowledgments
This project has received funding from the European Union’s HORIZON-MSCA-2021-SE-01 Research and Innovation programme under the Marie Sklodowska-Curie grant agreement number 101086388 - Project acronym: LACEGAL. This work was partially supported by the Consejo de Investigaciones Científicas y Técnicas de la República Argentina (CONICET) and the Secretaría de Ciencia y Técnica de la Universidad Nacional de Córdoba (SeCyT). The IllustrisTNG simulations were undertaken with compute time awarded by the Gauss Centre for Supercomputing (GCS) under GCS Large-Scale Projects GCS-ILLU and GCS-DWAR on the GCS share of the supercomputer Hazel Hen at the High Performance Computing Center Stuttgart (HLRS), as well as on the machines of the Max Planck Computing and Data Facility (MPCDF) in Garching, Germany. JFN acknowledges the hospitality of the Max-Planck Institute for Astrophysics and of the Donostia International Physics Center during the completion of this manuscript.
References
- Abadi, M. G., Navarro, J. F., Steinmetz, M., & Eke, V. R. 2003, ApJ, 597, 21 [NASA ADS] [CrossRef] [Google Scholar]
- Adams, J. J., Simon, J. D., Fabricius, M. H., et al. 2014, ApJ, 789, 63 [NASA ADS] [CrossRef] [Google Scholar]
- Albers, S. M., Weisz, D. R., Cole, A. A., et al. 2019, MNRAS, 490, 5538 [NASA ADS] [CrossRef] [Google Scholar]
- Baldry, I. K., Driver, S. P., Loveday, J., et al. 2012, MNRAS, 421, 621 [NASA ADS] [Google Scholar]
- Behroozi, P., Wechsler, R. H., Hearin, A. P., & Conroy, C. 2019, MNRAS, 488, 3143 [NASA ADS] [CrossRef] [Google Scholar]
- Benítez-Llambay, A. 2017, Py-SPHViewer: Cosmological simulations using Smoothed Particle Hydrodynamics, Astrophysics Source Code Library [record ascl:1712.003] [Google Scholar]
- Benítez-Llambay, A., Navarro, J. F., Abadi, M. G., et al. 2016, MNRAS, 456, 1185 [Google Scholar]
- Blanton, M. R., Lupton, R. H., Schlegel, D. J., et al. 2005, ApJ, 631, 208 [Google Scholar]
- Chabrier, G. 2003, PASP, 115, 763 [Google Scholar]
- Cheng, Z., Li, C., Li, N., Yan, R., & Mo, H. 2024, ApJ, 961, 216 [Google Scholar]
- Christensen, C. R., Davé, R., Governato, F., et al. 2016, ApJ, 824, 57 [CrossRef] [Google Scholar]
- Davis, M., Efstathiou, G., Frenk, C. S., & White, S. D. M. 1985, ApJ, 292, 371 [Google Scholar]
- Dekel, A., & Woo, J. 2003, MNRAS, 344, 1131 [NASA ADS] [CrossRef] [Google Scholar]
- Dolag, K., Borgani, S., Murante, G., & Springel, V. 2009, MNRAS, 399, 497 [Google Scholar]
- Driver, S. P., Hill, D. T., Kelvin, L. S., et al. 2011, MNRAS, 413, 971 [Google Scholar]
- Du, M., Ho, L. C., Debattista, V. P., et al. 2021, ApJ, 919, 135 [NASA ADS] [CrossRef] [Google Scholar]
- Du, M., Ho, L. C., Yu, H.-R., & Debattista, V. P. 2022, ApJ, 937, L18 [NASA ADS] [CrossRef] [Google Scholar]
- El-Badry, K., Wetzel, A. R., Geha, M., et al. 2017, ApJ, 835, 193 [NASA ADS] [CrossRef] [Google Scholar]
- Ferrarotti, A. S., & Gail, H. P. 2006, A&A, 447, 553 [CrossRef] [EDP Sciences] [Google Scholar]
- Fu, S. W., Weisz, D. R., Starkenburg, E., et al. 2024, ApJ, 975, 2 [Google Scholar]
- Genel, S., Fall, S. M., Hernquist, L., et al. 2015, ApJ, 804, L40 [NASA ADS] [CrossRef] [Google Scholar]
- Gutcke, T. A., Pakmor, R., Naab, T., & Springel, V. 2021, MNRAS, 501, 5597 [NASA ADS] [Google Scholar]
- Karachentsev, I. D., Makarov, D. I., & Kaisina, E. I. 2013, AJ, 145, 101 [Google Scholar]
- Kauffmann, G., Heckman, T. M., White, S. D. M., et al. 2003, MNRAS, 341, 33 [Google Scholar]
- Klypin, A., Karachentsev, I., Makarov, D., & Nasonova, O. 2015, MNRAS, 454, 1798 [Google Scholar]
- Li, C., & White, S. D. M. 2009, MNRAS, 398, 2177 [NASA ADS] [CrossRef] [Google Scholar]
- Ludlow, A. D., Fall, S. M., Wilkinson, M. J., Schaye, J., & Obreschkow, D. 2023, MNRAS, 525, 5614 [NASA ADS] [CrossRef] [Google Scholar]
- Marinacci, F., Vogelsberger, M., Pakmor, R., et al. 2018, MNRAS, 480, 5113 [NASA ADS] [Google Scholar]
- Mateo, M. L. 1998, ARA&A, 36, 435 [NASA ADS] [CrossRef] [Google Scholar]
- McConnachie, A. W. 2012, AJ, 144, 4 [Google Scholar]
- McNichols, A. T., Teich, Y. G., Nims, E., et al. 2016, ApJ, 832, 89 [NASA ADS] [CrossRef] [Google Scholar]
- McQuinn, K. B. W., van Zee, L., & Skillman, E. D. 2019, ApJ, 886, 74 [NASA ADS] [CrossRef] [Google Scholar]
- Moffett, A. J., Lange, R., Driver, S. P., et al. 2016, MNRAS, 462, 4336 [NASA ADS] [CrossRef] [Google Scholar]
- Moster, B. P., Naab, T., & White, S. D. M. 2013, MNRAS, 428, 3121 [Google Scholar]
- Naab, T., Oser, L., Emsellem, E., et al. 2014, MNRAS, 444, 3357 [Google Scholar]
- Naiman, J. P., Pillepich, A., Springel, V., et al. 2018, MNRAS, 477, 1206 [Google Scholar]
- Nelson, D., Pillepich, A., Springel, V., et al. 2019a, MNRAS, 490, 3234 [Google Scholar]
- Nelson, D., Springel, V., Pillepich, A., et al. 2019b, Computat. Astrophys. Cosmol., 6, 2 [NASA ADS] [CrossRef] [Google Scholar]
- Oh, S.-H., Hunter, D. A., Brinks, E., et al. 2015, AJ, 149, 180 [CrossRef] [Google Scholar]
- Oman, K. A., Marasco, A., Navarro, J. F., et al. 2019, MNRAS, 482, 821 [NASA ADS] [CrossRef] [Google Scholar]
- Ostriker, E. C., & Kim, C.-G. 2022, ApJ, 936, 137 [NASA ADS] [CrossRef] [Google Scholar]
- Pakmor, R., Springel, V., Bauer, A., et al. 2016, MNRAS, 455, 1134 [Google Scholar]
- Pillepich, A., Nelson, D., Hernquist, L., et al. 2018a, MNRAS, 475, 648 [Google Scholar]
- Pillepich, A., Springel, V., Nelson, D., et al. 2018b, MNRAS, 473, 4077 [Google Scholar]
- Pillepich, A., Nelson, D., Springel, V., et al. 2019, MNRAS, 490, 3196 [Google Scholar]
- Planck Collaboration XIII. 2016, A&A, 594, A13 [NASA ADS] [CrossRef] [EDP Sciences] [Google Scholar]
- Riggs, C. L., Brooks, A. M., Munshi, F., et al. 2024, ApJ, 977, 20 [NASA ADS] [CrossRef] [Google Scholar]
- Rodriguez-Gomez, V., Genel, S., Vogelsberger, M., et al. 2015, MNRAS, 449, 49 [Google Scholar]
- Rodriguez-Gomez, V., Sales, L. V., Genel, S., et al. 2017, MNRAS, 467, 3083 [Google Scholar]
- Sales, L. V., Navarro, J. F., Theuns, T., et al. 2012, MNRAS, 423, 1544 [Google Scholar]
- Sales, L. V., Wetzel, A., & Fattahi, A. 2022, Nat. Astron., 6, 897 [NASA ADS] [CrossRef] [Google Scholar]
- Sotillo-Ramos, D., Pillepich, A., Donnari, M., et al. 2022, MNRAS, 516, 5404 [NASA ADS] [CrossRef] [Google Scholar]
- Springel, V. 2010, MNRAS, 401, 791 [Google Scholar]
- Springel, V., & Hernquist, L. 2003, MNRAS, 339, 289 [Google Scholar]
- Springel, V., White, S. D. M., Tormen, G., & Kauffmann, G. 2001, MNRAS, 328, 726 [Google Scholar]
- Springel, V., Pakmor, R., Pillepich, A., et al. 2018, MNRAS, 475, 676 [Google Scholar]
- Swaters, R. A., Sancisi, R., van Albada, T. S., & van der Hulst, J. M. 2009, A&A, 493, 871 [NASA ADS] [CrossRef] [EDP Sciences] [Google Scholar]
- Tau, E. A., Vivas, A. K., & Martínez-Vázquez, C. E. 2024, AJ, 167, 57 [NASA ADS] [CrossRef] [Google Scholar]
- van den Bosch, F. C., & Swaters, R. A. 2001, MNRAS, 325, 1017 [NASA ADS] [CrossRef] [Google Scholar]
- Vogelsberger, M., Genel, S., Sijacki, D., et al. 2013, MNRAS, 436, 3031 [Google Scholar]
- Vogelsberger, M., Genel, S., Springel, V., et al. 2014, Nature, 509, 177 [Google Scholar]
- Walter, F., Brinks, E., de Blok, W. J. G., et al. 2008, AJ, 136, 2563 [Google Scholar]
- Weinberger, R., Springel, V., Hernquist, L., et al. 2017, MNRAS, 465, 3291 [Google Scholar]
- York, D. G., Adelman, J., Anderson, J. E., Jr, et al. 2000, AJ, 120, 1579 [Google Scholar]
Appendix A: Size-mass relation in TNG50 & TNG100
In Table A.1 we list numerical parameters of the TNG50-1 and TNG100-1 runs of the Illustris TNG suite (as listed in Nelson et al. 2019b). Although TNG50-1 has higher resolution than TNG100-1 (and a smaller volume) both simulations share the sub-grid physics implementation of e.g. magnetic fields, black hole accretion and feedback, wind directionality, velocity and energy and metal tagging (see Appendix A Pillepich et al. 2018b).
Numerical parameters for the TNG50-1 and TNG100-1 runs of the IllustrisTNG suite.
The effects of unresolved baryonic clumps at the innermost regions of galaxies are likely due to the sub-grid physics implementation. In Figure A.1 we compare the size-mass relation for isolated central galaxies of TNG50-1 (left panel, as in Figure 11) and TNG100-1 (right panel). A "tongue" of galaxies that reach extremely small size can be identified in both simulations. However, the numerical feature in TNG100-1 occurs at higher stellar masses and larger sizes, a clear indication of numerical artifact.
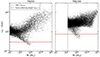 |
Fig. A.1. Stellar half mass radius (r50, *) as a function of stellar mass (M*) for all isolated central galaxies in TNG50-1 (left panel, similar to Figure 11) and in TNG100-1 (right panel). All galaxies shown have more than 100 stellar particles and more than 100 dark matter particles. Red dashed lines indicate the force softening length for dark matter and stellar particles for each simulation. The "tongue" is also present in TNG100, but at slightly higher masses and with larger size, suggesting that this feature is numerical in origin. |
All Tables
Numerical parameters for the TNG50-1 and TNG100-1 runs of the IllustrisTNG suite.
All Figures
|
Fig. 1. Face-on and edge-on projections of stars (top panels) and gas (bottom panels) in four TNG50 central galaxies with varying stellar mass and rotational support. From left to right, galaxies increase in total stellar mass M*, total gas mass Mgas, and rotational support κrot (values are shown in white labels). Cyan circles indicate our definition of galaxy size rglx = 0.15 r200; orange circles mark r = 1 kpc. Extended gaseous and stellar discs are more clearly evident in the two most massive galaxies (C and D). All galaxies exhibit a dense baryonic clump (gas and stars) in the central regions of r ∼ 1 kpc. The TNG50 Subhalo_IDs for these galaxies are: 830875 (A), 792447 (B), 733632 (C), and 643257 (D). Brighter colours indicate a higher number density of particles. Images were generated with PySPHViewer (Benítez-Llambay 2017). |
| In the text | |
|
Fig. 2. Galaxy morphology estimator κrot as function of stellar mass for 3824 isolated galaxies from TNG50. Each galaxy is represented with a circle coloured according to the fraction of stellar mass enclosed within 1 kpc of its centre: f*, < 1 = M*, < 1/M*. We indicate the median and the 25th-75th percentiles with a solid black line and shaded region. Filled squares highlight the four example galaxies (A, B, C, and D) shown in Figure 1. Ordered rotation increases monotonically with stellar mass in the 8.0 < log(M*/M⊙)≲10.3 range, with dwarf galaxies typically having κrot ≲ 0.4. The colour gradient shows that inner regions become more dominant at lower stellar masses, reaching f*, < 1 > 0.5, and these galaxies exhibit the lowest rotational support of the sample. At fixed stellar mass, κrot is anti-correlated with the stellar-mass fraction in the inner regions f*, < 1. |
| In the text | |
|
Fig. 3. Top panel: Stellar mass enclosed within 1 kpc of galaxy centre (M*, < 1) as a function of total stellar mass (M*), coloured according to the central black-hole mass. In the dwarf regime, most galaxies do not harbour a central massive black hole due to the seeding procedure of TNG50, and we identify them with grey crosses. The dashed grey lines show the 1:1 and 1:10 ratios, indicating that low-mass galaxies have most of their stellar mass enclosed within 1 kpc, while at higher masses the inner region represents roughly 0.1–0.2 of the total mass. Bottom panel: Galaxy morphology parameter κrot as function of enclosed stellar-mass fraction, f*, < 1, coloured according to total stellar mass. The solid black lines and shaded regions indicate the median and the 25th-75th percentiles. At low stellar masses (redder colours), the inner regions become more dominant. Rotational support is anti-correlated with the fraction of stellar mass in the inner regions. |
| In the text | |
|
Fig. 4. Star formation rate (SFR) profiles for the example galaxies (A, B, C, and D) from Sect. 2 at z = 0 (cosmic time t = 13.8 Gyr, top panel) and at z = 1.3 (t = 4.8 Gyr, bottom panel). Colours are as for the squares in Figure 2: from brown for galaxy A (lowest stellar mass and κrot) to green for galaxy D (highest mass and rotational support). In the presence of a star forming inner clump, the profiles show a relatively quiescent zone between 1 kpc and 2 kpc that separate the central region with the outer gaseous disc. The latter is more extended and more star forming at higher masses, while the size of the unresolved clump evolves slightly. We indicate a galactocentric distance of r = 1 kpc, encompassing most inner star formation, with a grey, dashed vertical line. |
| In the text | |
|
Fig. 5. Face-on and edge-on projections of young stars (defined as those with an age < 1 Gyr at redshift z = 0) in the four illustrative examples shown in Figure 1 (from left to right, galaxies A, B, C, and D). White labels indicate the mass and rotational support of the young stellar component for each galaxy ( |
| In the text | |
|
Fig. 6. Rotation velocity vϕ = jz/R of young stars (i.e. ages < 1 Gyr, magenta dots) and circular velocity |
| In the text | |
|
Fig. 7. Rotational support parameter κrot as function of galaxy stellar mass. Solid and dashed lines show results for stars within the galactic radius (r < rglx = 0.15 r200) and in the outer regions (r > 1 kpc), respectively. Black lines represent all stars, while magenta lines represent young stars (i.e. age < 1 Gyr). Young stars in the outer regions (magenta dashed line) have κrot > 0.7 and tend to be rotation-supported in all galaxies. Conversely, young stars as a whole (solid magenta line) are non-rotating at low masses (κrot < 0.5); this is because in these systems most stars form in the central, non-rotating clump. Symbols correspond to galaxies A, B, C, and D, identified according to colour (as in Figure 2; squares: κrot; triangles: κrot, young). A thinner magenta line indicates results when only galaxies with at least 50 young stars in the outer regions are included in the analysis. |
| In the text | |
|
Fig. 8. Left panels: Radial velocity of stars (red) and gas (blue) for galaxies B and C at redshift z = 0, which were chosen as illustrative examples. The solid blue curve indicates the median radial velocity of gas cells at a given radius; the dashed red curve indicates the radial velocity dispersion of star particles. Right panels: Gas cell density versus galactocentric distance. The solid black horizontal line shows the density threshold for star formation (ρmin, SF ≈ 3.5 × 10⁶ M⊙ kpc−3). The dashed horizontal line indicates the minimum wind-recoupling density, defined as ρw, recouple = 0.05 × ρmin, SF. The minimum radius where recoupling may occur (i.e. where a gas cell falls below ρw, recouple) is indicated with a dashed red vertical line. Note that the quiescent zone between the inner clump and the outer disc roughly coincides with the ‘recoupling radius’, indicating that the star formation gap is caused by feedback winds. |
| In the text | |
|
Fig. 9. Evolution of median baryonic (solid lines) and stellar mass (dashed lines) in the inner clump (i.e. enclosed within 1 physical kpc) for stacks of galaxies in 0.5 dex M* bins. Lines are colour-coded by total stellar mass at redshift z = 0. The median M* of each bin is shown by the solid circles plotted at t ≈ 13.5 Gyr. The inner clump mass grows gradually in lower-mass galaxies (redder colours), indicating significant gas infall into their central regions and ongoing star formation. The inner clumps of more massive galaxies form early and have little gas left at z = 0. |
| In the text | |
|
Fig. 10. Evolution of i) stellar-mass fraction within r < 1 kpc, f*, < 1 (left panel); ii) median stellar half-mass radius, r50, * (centre panel); and iii) median half-mass radius of young stars (i.e. age < 1 Gyr), r50, young (right panel), for the same stacks of galaxies in 0.5 dex M* bins shown in Figure 9. Higher mass galaxies (bluer) show a decreasing enclosed stellar-mass fraction as newly formed stars are born at progressively larger radii, which is consistent with inside-out galaxy growth. Conversely, low-mass galaxies (redder) appear to become increasingly centrally concentrated, with an outside-in trend where newly formed stars are found at progressively smaller galactocentric radii. |
| In the text | |
|
Fig. 11. Stellar half-mass radius (r50, *) as function of stellar mass (M*) for our sample of central TNG50 galaxies, extended to log(M*/M⊙) = 7 (virial masses down to log(M200/M⊙)∼10). Each galaxy is represented with a circle coloured according to the fraction of stellar mass enclosed within 1 kpc of its centre f*, < 1 = M*, < 1/M*. Coloured squares highlight galaxies A, B, C, and D from Figure 1. We note that the stellar-mass-size relation seems to ‘converge’ to ∼1 kpc in the dwarf regime, with a secondary population of unusually compact galaxies that reach a very small r50, * at log(M*/M⊙)∼9. These galaxies reach sizes comparable to the gravitational-force softening length for stars and dark-matter particles (0.29 kpc at redshift z = 0) and correspond to systems where the central clump dominates not only the galaxy stellar mass budget, but also the total mass budget within 1 kpc. See text for further discussion. |
| In the text | |
|
Fig. A.1. Stellar half mass radius (r50, *) as a function of stellar mass (M*) for all isolated central galaxies in TNG50-1 (left panel, similar to Figure 11) and in TNG100-1 (right panel). All galaxies shown have more than 100 stellar particles and more than 100 dark matter particles. Red dashed lines indicate the force softening length for dark matter and stellar particles for each simulation. The "tongue" is also present in TNG100, but at slightly higher masses and with larger size, suggesting that this feature is numerical in origin. |
| In the text | |
Current usage metrics show cumulative count of Article Views (full-text article views including HTML views, PDF and ePub downloads, according to the available data) and Abstracts Views on Vision4Press platform.
Data correspond to usage on the plateform after 2015. The current usage metrics is available 48-96 hours after online publication and is updated daily on week days.
Initial download of the metrics may take a while.