Fig. 2.
Download original image
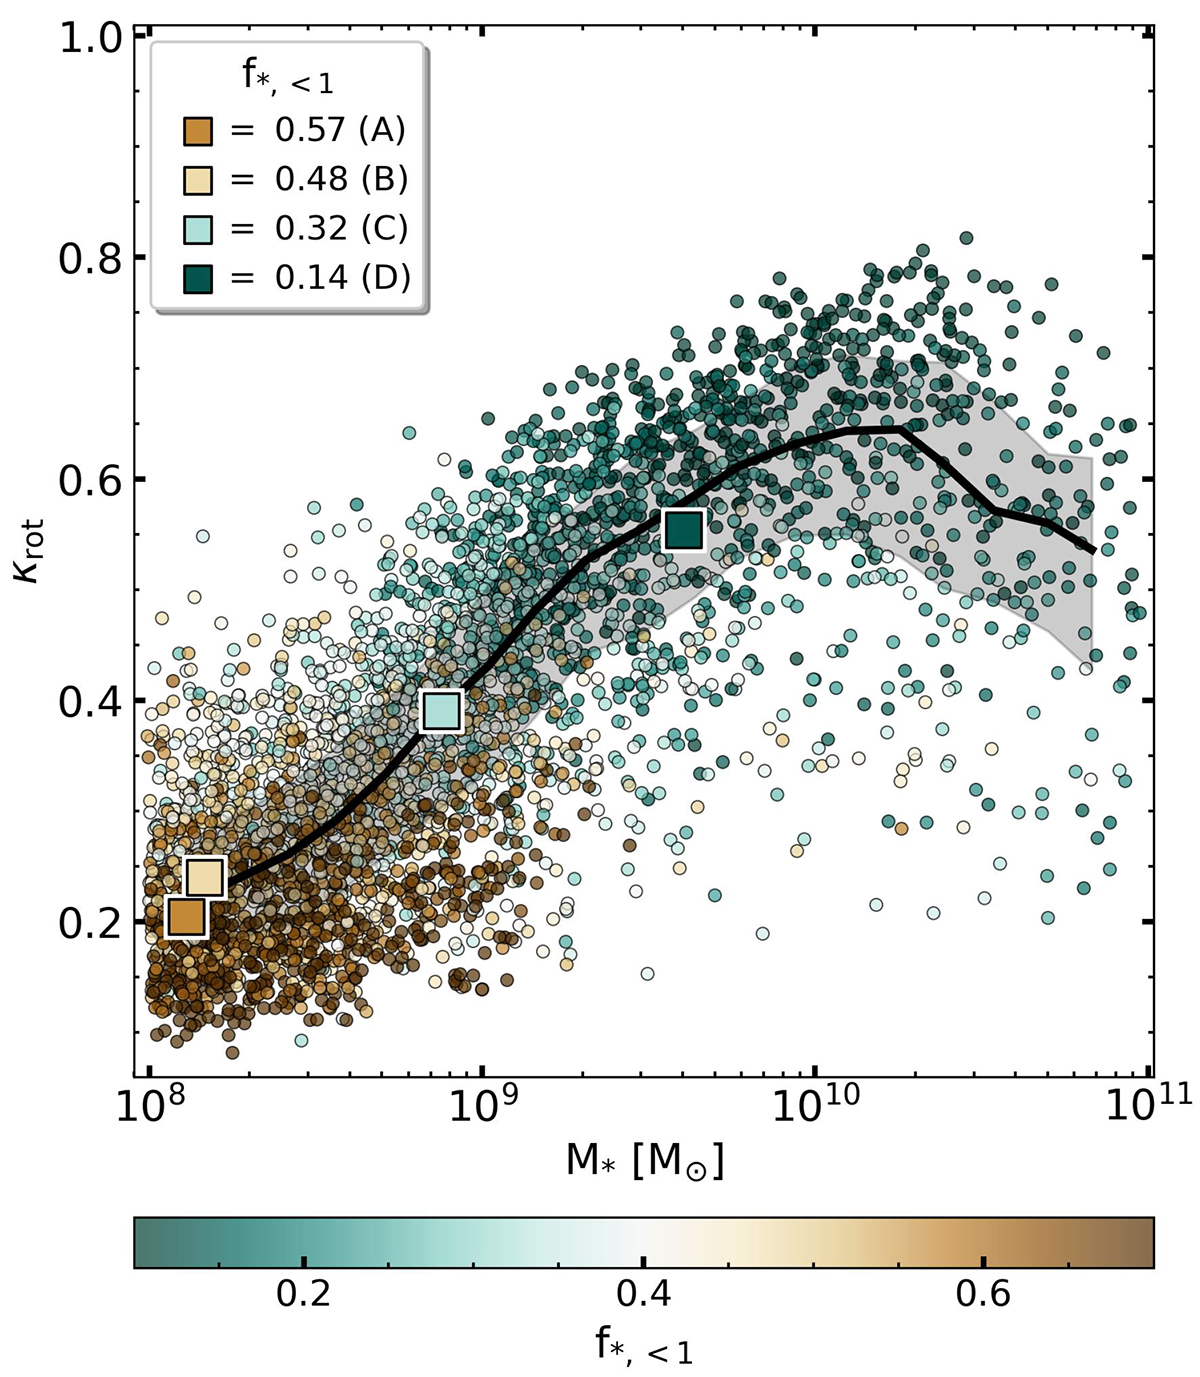
Galaxy morphology estimator κrot as function of stellar mass for 3824 isolated galaxies from TNG50. Each galaxy is represented with a circle coloured according to the fraction of stellar mass enclosed within 1 kpc of its centre: f*, < 1 = M*, < 1/M*. We indicate the median and the 25th-75th percentiles with a solid black line and shaded region. Filled squares highlight the four example galaxies (A, B, C, and D) shown in Figure 1. Ordered rotation increases monotonically with stellar mass in the 8.0 < log(M*/M⊙)≲10.3 range, with dwarf galaxies typically having κrot ≲ 0.4. The colour gradient shows that inner regions become more dominant at lower stellar masses, reaching f*, < 1 > 0.5, and these galaxies exhibit the lowest rotational support of the sample. At fixed stellar mass, κrot is anti-correlated with the stellar-mass fraction in the inner regions f*, < 1.
Current usage metrics show cumulative count of Article Views (full-text article views including HTML views, PDF and ePub downloads, according to the available data) and Abstracts Views on Vision4Press platform.
Data correspond to usage on the plateform after 2015. The current usage metrics is available 48-96 hours after online publication and is updated daily on week days.
Initial download of the metrics may take a while.