| Issue |
A&A
Volume 687, July 2024
|
|
|---|---|---|
| Article Number | A131 | |
| Number of page(s) | 14 | |
| Section | Extragalactic astronomy | |
| DOI | https://doi.org/10.1051/0004-6361/202449939 | |
| Published online | 03 July 2024 | |
What drives the corpulence of galaxies?
I. The formation of central compact dwarf galaxies in TNG50
1
Institut d’Astrophysique de Paris (UMR 7095: CNRS & Sorbonne Université), 98 bis Bd Arago, 75014 Paris, France
2
Instituto de Astronomia, Geofísica e Ciências Atmosféricas (Universidade de São Paulo), R. do Matão, 1226, São Paulo, SP 05508-090, Brazil
e-mail: This email address is being protected from spambots. You need JavaScript enabled to view it.
3
Racah Institute of Physics, The Hebrew University, Jerusalem 91904, Israel
Received:
11
March
2024
Accepted:
22
April
2024
Abstract
Nearby dwarf galaxies display a variety of effective radii (sizes) at a given stellar mass, suggesting different evolution scenarios according to their final “stellar” size. The TNG hydrodynamical simulations present a bimodality in the z = 0 size–mass relation (SMRz0) of dwarf galaxies, at r1/2, ⋆ ∼ 450 pc. Using the TNG50 simulation, we explored the evolution of the most massive progenitors of dwarf galaxies (z = 0 log(M⋆/M⊙) between 8.4 and 9.2) that end up as central galaxies of their groups. We split these dwarfs into three classes of the SMRz0: “Normals” from the central spine of the main branch, and “Compacts” from the secondary branch as well as the lower envelope of the main branch. Both classes of Compacts see their stellar sizes decrease from z ∼ 1 onwards in contrast to Normals, while the sizes of the gas and dark matter (DM) components continue to increase (as for Normals). A detailed analysis reveals that Compacts live in poorer environments, and thus suffer fewer major mergers from z = 0.8 onwards, which otherwise would pump angular momentum into the gas, allowing strong gas inflows, producing inner star formation, and thus leading to the buildup of a stellar core. Compacts are predicted to be rounder and to have bluer cores. Compact dwarfs of similar sizes are observed in the GAMA survey, but the bimodality in size is less evident and the most compact dwarfs tend to be passive rather than star forming, as in TNG50. Our conclusions should therefore be confirmed with future cosmological hydrodynamical simulations.
Key words: galaxies: dwarf / galaxies: evolution / galaxies: formation / galaxies: interactions
© The Authors 2024
 Open Access article, published by EDP Sciences, under the terms of the Creative Commons Attribution License (https://creativecommons.org/licenses/by/4.0), which permits unrestricted use, distribution, and reproduction in any medium, provided the original work is properly cited.
This article is published in open access under the Subscribe to Open model. This email address is being protected from spambots. You need JavaScript enabled to view it. to support open access publication.
1. Introduction
Dwarf galaxies (hereafter dwarfs) constitute an important laboratory for studying the influence of different physical mechanisms on the formation and evolution of galaxies. They mainly acquire their stellar mass from star formation driven by gas accretion. Indeed, the other path for star formation, namely starbursts from gas-rich galaxy mergers, should not be important because low-mass galaxies rarely acquire the bulk of their stellar mass from mergers (Guo & White 2008; Cattaneo et al. 2011; Bernardi et al. 2011).
Dwarfs have difficulty in maintaining the supply of gas from accretion, because of several mechanisms, both internal and external. Internal processes include energetic feedback from supernovae (Dekel & Silk 1986) and from the central supermassive black hole (Silk & Rees 1998), if present. External processes include a variety of environmental effects, such as collisional tides (Richstone 1976); tides from clusters (Merritt 1983) and groups (Mamon 1987); ram pressure (Gunn & Gott 1972); harassment from numerous flybys (Moore et al. 1996) and the effects of a nearby active galactic nucleus (Dashyan et al. 2019). These external processes mainly affect galaxies that end up as satellites. Interactions between galaxies can lead to different results depending on how they occur and the galaxies involved (e.g., Barnes & Hernquist 1991, 1992).
One fundamental issue is the size–mass relation (SMR) of galaxies, that is the relation between their effective (projected half-light) radius and their stellar mass. Analyzing galaxies from the Main Galaxy Sample of the Sloan Digital Sky Survey (SDSS), Shen et al. (2003) found that the SMR of galaxies is not universal: it is steeper for early-type galaxies than for late-type galaxies, leading to smaller sizes for early-type galaxies once one extrapolates to the low-mass end.
Low-mass (M⋆ between 107 and 109 M⊙) galaxies are bimodal in size, with a split at a few hundred parsecs (e.g., Misgeld & Hilker 2011), with a diffuse class (dwarf ellipticals and dwarf spheroidals) on one hand and a compact class (compact ellipticals (cEs), ultracompact dwarfs (UCDs), and globular clusters) on the other. The compact class systems have sizes of less than 10 (respectively, 100) times the median sizes of galaxies with log(M⋆/M⊙) = 8 (respectively, 7)1.
The strong bimodality in the sizes of dwarf galaxies indicate that the scenarios of formation and evolution of compact dwarfs are different from those of high-mass galaxies. For example, the observation of compact dwarf galaxies (both UCDs and cEs) in galaxy clusters or near massive galaxies suggests formation scenarios associated with tidal stripping of larger galaxies, groups, or clusters (e.g., Chilingarian & Mamon 2008; Brodie et al. 2011; Wang et al. 2023).
But tidal stripping does not affect central galaxies. Several other physical mechanisms have been suggested to form compact dwarfs. For example, UCDs could be extremely massive globular clusters (Mieske et al. 2002, 2012) or the result of mergers of young globular clusters formed in merging galaxies (Kroupa 1998; Mahani et al. 2021). Blue compact dwarfs (BCDs) may be the result of mergers, specifically dwarf–dwarf mergers that can trigger a central starburst (e.g., Bekki 2008; Watts & Bekki 2016).
High-mass galaxies can also be compact: van Dokkum et al. (2008) discovered compact 1010 M⊙ galaxies at z = 2, with effective radii of as low as 500 pc, corresponding to spherical half-mass radii of roughly 750 pc. Dekel and Collaborators (Dekel et al. 2009; Dekel & Burkert 2014; Zolotov et al. 2015) argued that these high-redshift, relatively massive compact galaxies have a three-phase cycle: they form from violent disk instabilities in normal-size galaxies, causing compaction of the gas, which becomes so dense that it creates a compact starburst (blue nugget) and later passively evolves into a red nugget. For massive compact galaxies observed in the local Universe (probed by the Mapping Nearby Galaxies at Apache Point Observatory (MaNGA)), Schnorr-Müller et al. (2021) suggested an analogous scenario, occurring between z = 2 and 0.4, albeit less extreme. In a followup by the same team on the Illustris TNG100 cosmological hydrodynamical simulation, Lohmann et al. (2023) recently pointed out that compact galaxies accrete gas with less angular momentum than that accreted by other galaxies, allowing compact galaxies to increase their mass without significantly growing in size. In a similar analysis of galaxies with resolved spectroscopy (Sydney-AAO Multi-object Integral field spectrograph, SAMI) and with the Illustris TNG50 simulation, Deeley et al. (2023) found that one-third of compact massive dwarfs were stripped by a massive host galaxy. These authors also noted that the remaining isolated ones preferentially formed stars in their inner regions, although no physical mechanism differentiating these galaxies from normal ones was given.
The SMRs of galaxies in hydrodynamical simulations are in good agreement with observations for galaxies with Mstars > 109 M⊙ (Furlong et al. 2017; Genel et al. 2018). A striking feature of the Illustris simulations is the existence of a second, small-size branch in the z = 0 SMR, whose slope is, surprisingly, negative (Fig. 10 of Haslbauer et al. 2019 for Illustris, upper-left panel of Fig. 4 of Genel et al. 2018 for TNG100, and lower-right panel of Figs. 4 and 8 of Pillepich et al. 2018a for TNG50). A closer look using the Plot Group/Halo Catalogs facility on the TNG website2 reveals that this negative-slope small-size mode extends to stellar masses of 109.5 to 1010 M⊙ for TNG50, TNG100, and TNG300. This secondary negative-slope branch of the SMR has not yet been explained.
In the present article, we present a study on the physical mechanisms producing “low-corpulence” dwarf galaxies that end up as the central galaxy of their host. As the SMR extends to different stellar-mass ranges, we use corpulence to refer to the stellar half-mass radius given a specific stellar mass. We considered both the lower-corpulence galaxies in the main branch of the SMR and the lower-corpulence (secondary) branch of the SMR. To this end, we used the well-resolved TNG50-1 simulation, by following the evolution of the main progenitors of z = 0 galaxies. In two forthcoming studies (de Almeida et al., in prep.), we will use our tools to study the physical mechanisms driving low-corpulence dwarfs that end up as satellites as well as those processes leading to high-corpulence (highly diffuse) dwarfs.
In Sect. 2, we present the TNG50 simulation as well as our selection of compact galaxies and a control sample of normal galaxies in the same range of stellar mass. In Sect. 3, we present an analysis of the median evolution of the main progenitors of present-day compact and normal galaxies. In Sect. 4, we explore the respective roles of the physical mechanisms driving size evolution. We discuss our results in Sect. 5 and summarize our findings in Sect. 6.
2. Simulation and sample
2.1. IllustrisTNG
We studied the evolution of dwarf compact galaxies using the IllustrisTNG (hereafter, TNG) suite of cosmological magneto-hydrodynamical simulations (Springel et al. 2018; Pillepich et al. 2018b; Marinacci et al. 2018; Naiman et al. 2018; Nelson et al. 2018). These simulations (as in the previous Illustris simulations) were run with the AREPO magneto-hydrodynamics moving mesh code (Springel 2010). The TNG simulations were run with initial conditions drawn from the cosmological parameters values from Planck Collaboration XIII (2016): a flat ΛCDM cosmology with Hubble constant H0 = 67.74 km s−1 Mpc−1, matter density Ωm = 0.3089, baryon density Ωb = 0.0486, power spectrum normalization σ8 = 0.8159, and primordial spectral index ns = 0.9667. The TNG suite has a variety of box sizes and resolutions, and some were run without baryons. For the simulations with baryons, TNG implements prescriptions for star formation, stellar feedback, metal enrichment, and black hole (BH) physics (seeding and feedback). All simulations follow the evolution of a comoving box of the Universe (with periodic boundary conditions) from z = 127 to z = 0, with data saved at 100 different snapshots, typically spaced by 150 Myr in time.
The TNG database provides tables of groups, subhalos, particles (gas, dark matter (DM), stars, black holes, as well as tracer particles not considered here), subhalo merger trees, and 33 (at the time of the writing of this manuscript) additional tables provided by the users. The groups are identified using the friends-of-friends algorithm (Davis et al. 1985) on the particles, while the subhalos are the structures within groups identified using the SUBFIND algorithm (Springel et al. 2001). The subhalos are mostly galaxies and the TNG database provides numerous astrophysical attributes for each one. One can have groups with a single subhalo, representing an isolated galaxy. We hereafter use the term galaxies to refer to subhalos and often use hosts to refer to groups.
In TNG, a subhalo has a bad flag if it forms within one viral radius of a group, and with less than 80% of its mass in DM. This flag allows users to discard H II regions incorrectly extracted by SUBFIND.
2.2. The TNG50 simulation
We adopt the TNG50-1 (hereafter, TNG50) simulation (Nelson et al. 2019; Pillepich et al. 2019), as it is the best resolved and most suited to studying the evolution of dwarf galaxies. The DM and gas resolutions of the simulation are mDM = 4.5 × 10⁵ M⊙ and mgas = 8.5 × 10⁴ M⊙, respectively, in a volume of 51.73 Mpc3. The size resolution is described by softening lengths of the collisionless components (DM and stars) whose physical values increase with cosmic time at 576 comoving pc until z = 1, and are then fixed at the z = 1 physical size of 288 pc (Pillepich et al. 2019). The gas softening length is 74 comoving pc (the minimum gas cell size is 8 pc). Thus, galactic disks are reasonably well resolved in TNG50. The TNG50 simulations have the same subgrid physics as the TNG100 and TNG300 simulations, except for a slightly different criterion for the star formation time, which is designed to avoid instantaneous star formation in dense regions (Nelson et al. 2019).
2.3. Sample selection
Figure 1 displays the present-day size–mass relation of galaxies in our chosen range of stellar masses. The bimodality of sizes is clear: there are only few small gray points at log(r1/2, ⋆/kpc)≈ − 0.25 (i.e., 560 pc); see the red curve found with a Gaussian mixing model (we hereafter use log(r1/2/kpc) for the stellar half-mass radius)3. We denote the large- and small-size branches “Main” and “Secondary”, respectively. The Secondary branch has a negative slope, as Haslbauer et al. (2019) and Genel et al. (2018) previously found in Illustris and TNG100, respectively. As the Secondary branch of the SMR is polluted by suspicious subhalos (one-third with bad flags, and mostly low-DM galaxies), we considered two samples of “Compact” galaxies: the lower envelope of the Main branch of the SMR, and the Secondary branch, both restricted to good-flag galaxies.
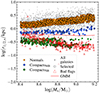 |
Fig. 1. Present-day stellar half-mass radius vs. stellar mass (within 2 stellar half-mass radii), highlighting our adopted samples of Compacts and Normals (both centrals and satellites). The orange, blue, and green circles are the different samples, respectively: Normals, CompactsMB (Main branch) and CompactsSB (Secondary branch), while the gray dots are all the subhalos in the stellar mass range. The triangles are bad-flag galaxies. The red solid line is the separation made with a Gaussian mixing model (GMM). |
We selected all good-flag subhalos with log(M⋆/M⊙) > 8.4 in order to have a sufficient number of particles to resolve the galaxy and be able to efficiently separate the Main and Secondary branches. We also restrict the subhalos to log(M⋆/M⊙) < 9.2 in order to limit our selection to low-mass galaxies and avoid the poorly populated end of the Secondary branch4. Finally, we only consider subhalos that have an identified progenitor.
We then defined a first set of Compact galaxies taken from a conservative subset of the Secondary branch: “CompactsSB” are the galaxies whose (3D) stellar half-mass radius satisfies log(r1/2/kpc) < − 0.35 (i.e. r1/2 < 447 pc). We also defined a second set of Compact galaxies, hereafter “CompactsMB”, taken from the lower 5th percentile of the Main branch (taking the galaxy sizes for different stellar mass bins and computing the median and the 5th percentile of the residuals). The minimum and maximum sizes of CompactsMB as a function of stellar mass within 2 r1/2 can be approximated as
 (1)
(1)
 (2)
(2)
for galaxies in 8.4 < log(M⋆/M⊙) < 9.2. Finally, we defined a conservative control sample of galaxies (hereafter, “Normals”) as the galaxies within 25th–75th percentiles of the Main branch. As the CompactsMB have a higher median stellar mass than the other two samples, we selected subsamples of Normals and CompactsSB to have the same stellar mass distribution as the CompactsMB, with median stellar mass 108.75 M⊙ within two effective radii; that is, 108.9 M⊙ over the full subhalo. Our selection is shown in Fig. 1.
This selection led to 1289 Normals, 131 CompactsMB, and 157 CompactsSB galaxies. We also split these samples (hereafter, “size classes”) according to their location within their group at z = 0, between z = 0 “centrals” and “satellites”. We abusively use these terms to refer to the respective z = 0 galaxies and their main progenitors, although z = 0 satellites were centrals at earlier times. We identify centrals as the subhalos whose index is contained in the list of central subhalos of all z = 0 groups (obtained from GroupFirstSub). We verify centrals that are not backsplash galaxies (those that previously traveled once or several times through a group and are currently outside that group and are identified as the center of another group). For this, we verified that the group mass of the central (Group_M_Crit200) was not more than 1.5 dex greater at earlier times. The fractions of centrals are 54%, 37%, and 52% among CompactsSB, CompactsMB, and Normals, respectively. In other words, while roughly half the z = 0 CompactsSB and Normals are centrals, almost two-thirds of the z = 0 CompactsMB are satellites.
We also defined galaxies that were born later than z = 1 as the “young” population; galaxies that were born between z = 5 and z = 1 as the “intermediate” population; and galaxies that were born before z = 5 as the “old” population. Most galaxies are old: 90%, 100%, and 99.7% for CompactsSB, CompactsMB, and Normal, respectively. No CompactsMB have an intermediate or younger age. Among the Normals, only three have an intermediate age, while only one is younger. Finally, only one CompactSB has an intermediate age, while 9% are younger, all of which are satellites. As we have few galaxies from the intermediate-age population, we exclude these from our analysis.
Table 1 lists the numbers of galaxies in each size class and subsample of our final sample (with percentages in parentheses). None of the central galaxies have a young age or a bad flag, and only 3 among 810 have intermediate ages. In the present work, we only consider the central old galaxies. After the above selections, we therefore considered 674 Normals, 48 CompactsMB, and 85 CompactsSB.
Samples of Compacts and Normals.
2.4. Components of z = 0 galaxies
A more global view of the relative importance of the three components (stars, gas, and DM) among central galaxies is given in Table 2, which shows the median z = 0 DM, gas, and stellar fractions in each population. In Table 2 and elsewhere in the present paper, we verify the significance of different distributions using 5000 random shuffles of the members of the two samples. The central CompactsSB, CompactsMB, and Normals are typically dominated by DM. Normals and CompactsMB have the same distribution for each component, while CompactsSB have slightly more stars (median of 0.02) and less DM (median of 0.91), with statistically different distributions. Figure 2 shows the present–day fractions for the gas and stellar components, with no striking differences between our three size classes.
Median z = 0 DM, gas, and star fractions for central galaxies.
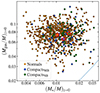 |
Fig. 2. Gas fraction versus stellar fraction at z = 0. The masses of each component are summed over the full subhalo. The orange, blue, and green circles are the different size classes, respectively: Normals, CompactsMB, and CompactsSB. The blue dashed line indicates equality. The star symbols indicate the median values for the gas and stellar mass fractions. |
3. Differences in the histories of Compact and Normal galaxies
We explored how galaxies become compact by studying the backwards evolution (hereafter, “history”) of specific parameters of the most massive progenitors (hereafter, “main progenitors”) of the z = 0 galaxies, separately for the Compacts and Normals. We follow the main progenitors using the Main Progenitor branch of the SUBLINK merger trees from the TNG database.
We first studied the evolution of the median (hereafter, “median evolution”) of specific galaxy parameters to understand the different histories by tracking the histories of each of the 1289 galaxies that end up as centrals (always being centrals throughout their history) – that is, 674 Normal, 48 CompactsMB, and 85 CompactsSB – and taking the median at each snapshot containing at least five galaxies (their main progenitors). We used bootstraps to estimate the uncertainties on these medians.
3.1. Size and mass evolution
Figure 3 shows the median evolution of the sizes and masses of the stellar, gas, and DM components measured over the entire subhalo. We do not use the popular TNG stellar mass within twice the stellar half-mass radius, which is clearly size dependent and would tend to show decreasing stellar mass evolution for the Compacts.
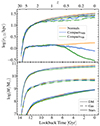 |
Fig. 3. Median evolution of the half-mass radii (top) and total masses (bottom) of the Normals (orange), CompactsMB (blue), and CompactsSB (green) for galaxies that end up as centrals at z = 0. The solid, dashed, and dotted lines represent the stellar, gas, and DM components, respectively, and all quantities are measured over the entire subhalos. The lines are the medians, and are only shown when we have at least five galaxies at that epoch; the shaded region shows the uncertainty on the median, estimated using bootstraps. |
The solid lines and associated shaded regions of the top panels of Fig. 3 show the median evolution of the stellar half-mass radius. One should note that galaxies that are centrals at z = 0 were not satellites at earlier epochs, as we removed the z = 0 backsplash centrals.
The top panel of Fig. 3 indicates that the stellar size of Normals grows at all times. In contrast, the CompactsMB and CompactsSB both start shrinking at z = 0.8. This behavior appears robust, as it is also seen when we split our samples into five bins of final stellar mass. We then verified that the sizes of the stellar components of Compacts and Normals are very different at z = 0, as expected from our selection (with CompactsMB in between the Normals and the CompactsSB). But at z ∼ 0.8, the median stellar half-mass radii of the three size classes are similar. This decrease in size (hereafter, compaction) is roughly exponential in time (linear in the figure) between z = 0.5 (5.2 Gyr ago) and z = 0.3 (3.5 Gyr ago). The size reduction is a factor 1.9 for CompactsSB in this 1.7 Gyr time interval, and is a factor 1.1 for CompactMB centrals. In summary, on average, Compact galaxies were not compact to begin with, but evolved to become compact.
Interestingly, as seen in the top panel of Fig. 3, while CompactsSB show a huge decrease in stellar half-mass radius, the corresponding DM and gas half-mass radii of Compacts (upper panel) evolve relatively similarly to those of the Normals: the z = 0 DM sizes are 5% and 20% lower for CompactsMB and CompactsSB, respectively, while the z = 0 gas sizes are 8% and 30% lower, respectively.
The lower panels of Fig. 3 show the median total mass evolution of the different components of the different size classes. The total mass corresponds to the mass within the entire subhalo, and not only within 2 stellar half-mass radii. One sees that the sample has very little effect on the typical mass evolution of all three components of the galaxies. As we selected our sample using the stellar mass within 2 r1/2, we can deduce that the outer masses of CompactsSB are slightly depleted.
Combining the size and mass evolution in Compacts that end up as centrals, the compaction of their stellar components occurs independently of the gas and DM components, of the Compact size class, and of the mass evolution of the DM, gas, and even stellar components.
3.2. Evolution of specific star formation rates
Some of the differences in the evolution of the stellar mass component may be related to differences in the evolution of the star formation efficiency (SFE). Here, we consider the specific star formation rate (sSFR; star formation rate over stellar mass) as a proxy for SFE. Figure 4 compares the histories of the sSFR of Compacts and Normals, showing the sSFR in the inner region (r < r1/2) and the ratio between that sSFR and the sSFR in the outer region (r > r1/2). We estimate the sSFRs using the stellar masses and SFRs provided in the TNG database in the full subhalo and within r1/2.
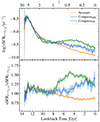 |
Fig. 4. Same as Fig. 3, but for the median evolution of the sSFR in the inner region (r < r1/2) (top) and the ratio between the sSFRs in the inner and outer regions (r > r1/2) (bottom). |
Figure 4 shows that the main progenitors of the z = 0 Normals have a continuous decrease in their inner sSFR (i.e., “quenching” of star formation) with cosmic time. There are small gradients in sSFR at z ∼ 1 for this population: the ratio between the inner and outer sSFR is close to unity. The inner star formation starts to become lower than in the outer region after z ∼ 0.9. The CompactsMB also see a continuous decrease in their inner sSFR, but not as strongly as do the Normals.
In contrast, the inner sSFR in CompactsSB is almost constant between z ∼ 1.7 and ∼0.45. This is related to concentrated star formation, which is verified by the rapid increase in the ratio between the inner and outer sSFR. CompactsMB also have a slow increase in this ratio, which suggests that these galaxies also have concentrated star formation, but not as strong as in CompactsSB and also without the almost constant inner sSFR. We return to these radial-dependent sSFRs in Compacts in Sect. 3.7.
3.3. Merger history
The star formation in galaxies can be within the main progenitor (in situ) or within external galaxies that later merged with the main progenitor (ex situ). The top panel of Fig. 5 displays the median evolution of the ex situ stellar mass normalized by the z = 0 ex situ stellar mass (solid) and by the z = 0 total stellar mass (dashed); while the bottom panels show the stellar mass from major mergers and other mergers. The data were obtained using the Stellar Assembly TNG supplementary data catalog provided by Rodriguez-Gomez et al. (2016, 017).
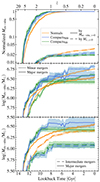 |
Fig. 5. Same as Fig. 3, but for the median evolution of the ex situ stellar mass. Top: ex situ mass normalized by the final ex situ mass (solid) or final (ex situ + in situ) stellar mass (i.e., ex situ stellar mass fraction, dashed). All masses are measured over the entire subhalo. Center and bottom: ex-situ stellar mass from major mergers (stellar mass ratio > 1/4, solid lines), intermediate mergers (stellar mass ratio between 1/4 and 1/10, dashed lines), and minor mergers (stellar mass ratio below 1/10, dotted lines). |
The dashed lines in the top panel of Fig. 5 indicate that the ex situ fractions of stellar mass for all three size classes are typically small (< 4%) at all times. Furthermore, while the ex situ stellar mass fraction of Normals is continuously increasing, those of the two Compacts size classes decouple from that of the Normals at z = 0.8, quickly reaching their maxima. By z = 0, the ex situ fraction is 2% and 2.5% for CompactsSB and CompactsMB, respectively, compared to 3.5% for Normals. The narrow uncertainties (shaded regions) indicate that this slower ex situ growth of Compacts is highly significant.
The solid lines of the top panel of Fig. 5 indicate that CompactsSB and CompactsMB tend to collect half their ex situ mass roughly 1.4 and 1.0 Gyr earlier than Normals, respectively, that is, by z = 2.3 (11.0 Gyr ago) and z = 2.0 (10.6 Gyr ago), respectively, instead of by z = 1.5 (9.6 Gyr ago) for Normals. Given the lower contribution from ex situ material, Compacts rely more on in situ star formation to grow in stellar mass compared to Normals. In other words, mergers play a smaller role in the evolution of galaxies that end up Compact.
The second and third panels of Fig. 5 show the contributions of mergers of different mass ratios to the ex situ mass: “major” (1/4 to 1), “intermediate” (1/10 to 1/4), and “minor” mergers (less than 1/10)5. At z = 0, CompactsSB typically have ∼20% (0.1 dex) lower stellar mass from major mergers (green solid) than Normals and CompactsMB (orange and blue solid lines). Also, Normals have a continuous growth of mass by major mergers, whereas Compacts typically reach a maximum mass from major mergers at z ∼ 1.4 (CompactsSB) or 1.2 (CompactsMB). Moreover, before z = 2, the growth of stellar mass from major mergers is faster in Compacts than in Normals. The bottom panel of Fig. 5 shows that intermediate mergers are even less important for the Compacts than for the Normals: they provide roughly three times less ex situ stellar mass to the Compacts than to the Normals.
The Stellar Assembly TNG also provides the flyby contribution in ex situ stellar mass. The flybys contribute less than 1% of the ex situ stellar mass for the three size classes. Indeed, the median mass provided by flybys in CompactsSB is zero. In summary, the stellar build up of Compacts, especially CompactsSB, is less driven by major and intermediate mergers, while flybys are negligible for all three classes.
Figure 6 compares the merger histories of Compacts and Normals, showing the epochs of the last major merger, intermediate merger, and minor merger. The last mergers of the three mass ratio classes occur earlier in CompactsMB than in Normals: zmedian = 2.74, 2.58, and 0.38 in CompactsMB versus 1.6, 1.49, and 0.21 in Normals, for major, intermediate, and minor mergers, respectively. CompactsSB lie in between CompactsMB and Normals for intermediate and minor mergers, while these galaxies have earlier major mergers, with median redshifts of 3.28, 2.21, and 0.27 for the last major, intermediate, and minor merger, respectively.
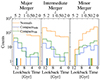 |
Fig. 6. Distributions of the epochs of the last mergers. The left, middle, and right panels show the major (stellar mass ratio M2/M1 > 1/4), intermediate (1/10 < M2/M1 < 1/4), and minor (M2/M1 < 1/10) mergers, respectively. The vertical segments indicate the median of each distribution. The colors are the same as in Fig. 3. |
Table 3 shows the significance of the differences between the medians of the redshift of the last merger. The epoch of the last major merger of CompactsSB is statistically identical to that of CompactsMB (P = 0.29), while the last major merger occurs significantly later in Normals (P = 0.0004 and 0.01, respectively). Similarly, the last intermediate merger occurs significantly earlier in CompactsSB and CompactsMB than it does in Normals (P = 0.01 and 0.01, respectively). In contrast, while the last minor merger occurs significantly earlier in CompactsMB than it does in Normals, this is not the case for CompactsSB. Disregarding the minor mergers, Compacts thus have more time to evolve without being appreciably perturbed by mergers, which explains why their ex situ stellar mass is smaller than in Normals.
Median redshift of last merger.
3.4. Evolution of the environment
The lower ex situ mass fraction and fewer (major) mergers of Compacts relative to Normals of the same z = 0 stellar mass suggest that Compacts live in lower density regions. The top panel of Fig. 7 shows that central Compacts have lower numbers of satellites6 than Normals from z = 0.5 onward: by 25% (CompactsMB) and 80% (CompactsSB). The lower panel indicates that central Compacts live in slightly lower mass halos than Normals. At z = 0, the halos of Compacts are 25% (CompactsMB) to 60% (CompactsSB) lower in mass than those of Normals. The evolution of the number of satellites of Compacts departs from that of Normals at z ∼ 2 (CompactsMB) and z ∼ 5 (CompactsSB), with a plateau or even a decreasing number until z ∼ 0.3. Similarly, the evolution of the halo mass of Compacts departs from that of Normals at z ∼ 1 (CompactsMB) and z ∼ 2 (CompactsSB), with continuously increasing halo mass for all three size classes. In summary, Compact centrals, CompactsMB, and especially CompactsSB live in slightly lower mass groups and have fewer satellites.
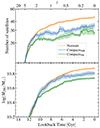 |
Fig. 7. Same as Fig. 3, but for the median evolution of the satellite number (top) and halo mass M200 (bottom) for central galaxies. |
3.5. Morphological evolution
We follow the evolution of the flattening of the stellar distribution using the Stellar Circularities, Angular Momenta, Axis Ratios TNG supplementary data catalog (Genel et al. 2015). This catalog provides the eigenvalues, μi, of the mass tensor of the stellar mass within 2 r1/2, with μ1 < μ2 < μ3. We define a sphericity parameter,  , where low values indicate a flattened galaxy (as discussed by Genel et al. 2015).
Figure 8 displays the median evolution of the sphericity parameter for the Compacts and Normals. The main progenitors of the Normal centrals typically become progressively flatter in time. Relative to the Normal centrals, the CompactMB centrals follow the same trend in shape until z ∼ 0.6, when they become rapidly more spherical. In contrast, the CompactSB centrals flatten more quickly than the other two size classes, until z ∼ 0.8, when they very rapidly become more spherical until 2 Gyr lookback time and remain so until the present day.
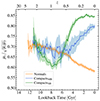 |
Fig. 8. Same as Fig. 3, but for the median evolution of the sphericity of the stellar distribution for all galaxies. The high (respectively low) values indicate spherical (flat) galaxies. |
3.6. Individual histories
While the median history of a given physical galaxy parameter allows us to view the typical evolution of that parameter for Compacts and for Normals, each galaxy has its own evolution. We followed the histories of a few randomly selected individual galaxies to better understand the rapidity of the decrease in size of the stellar component and its relation to the histories of other galaxy parameters.
Figure 9 displays the individual histories of the half-mass radius and sSFR for five CompactsSB, CompactsMB, and Normal galaxies. The top panel of Fig. 9 shows that most CompactsSB begin shrinking at a redshift of close to z = 0.8 (except for the red one). The compaction of CompactsMB occurs at different epochs: both with earlier (before z ∼ 1) and late (after z ∼ 1) compaction. In contrast, the compaction of the different individual CompactsSB appears more synchronized in time. On the other hand, all Normals have relatively constant size histories after z ∼ 1, with two cases of centrals that somewhat shrink after z ∼ 0.2. All the compaction episodes starting later than 10 Gyr ago last at least 2 Gyr. Nearly all CompactsSB decrease in stellar size over the last 8 Gyr. Thus, compaction is not a sudden process, which is expected from Fig. 3.
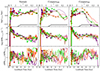 |
Fig. 9. Individual histories of the half-mass radius (top), inner sSFR (second row), and the ratio between the sSFRs in the inner and outer regions (bottom) for five randomly selected Normals (left), CompactsMB (center), and CompactsSB (right). Each line corresponds to the evolution of a single galaxy. The symbols indicate major mergers (large circles, with stellar mass ratio > 1/4) or intermediate mergers (intermediate-size squares, with stellar mass ratio between 1/10 and 1/4). The minor mergers are not shown for clarity. Thicker lines indicate when the galaxy hosts a central BH. The thick black lines show the evolution of the softening radius, while the gray shaded regions show the ±1σ region for the sSFR median evolution of all galaxies in the stellar mass range: 8.4 < log(M⋆/M⊙) < 9.2. |
The compaction of Normals and CompactsMB is not affected by the softening of the gravitational interactions between stars and DM particles, as the softening scale (black curve) is always well below the stellar half-mass radius of the galaxies. On the other hand, the sizes of some of the CompactsSB reach the softening scale at z ∼ 0.3. This may affect subsequent evolution, as below this scale the calculated parameters are not necessarily reliable. We discuss this further in Sect. 5.2.1. The CompactsSB continue to shrink until z = 0, except one central (purple) that suffers a major merger and stops shrinking. Many of the CompactsMB also keep shrinking until z = 0. Two CompactsMB centrals (brown and green) stop shrinking when a BH is present (thicker curve).
In general, Fig. 9 confirms the median trend of Fig. 6 that major and intermediate mergers are rare in Compacts after z = 1 (only two Compacts out of 10 suffer a major merger). In contrast, mergers are more frequent in Normals after z = 1 (four out of five suffer a major merger). These results are in agreement with Fig. 6 and Table 3, which show that Compacts stop undergoing mergers earlier than Normals.
While AGN activity (thicker lines in Fig. 9) is very rare in our ten individual Compacts (only one CompactsMB case at z < 0.5 and one CompactsSB case at z < 0.2), it is more frequent in the Normals, in particular at recent times (z < 0.7). In the top panel of Fig. 9, we note that the size of Normals increases roughly 1 Gyr after the onset of AGN activity. However, since the AGN activity is usually preceded by a major or intermediate merger, it is not clear if this size increase is driven by the merger or by the subsequent AGN activity. We return to this issue in Sect. 4.3.
As in Fig. 4, the middle panels of Fig. 9 show that Compacts (especially CompactsSB) are able to maintain star formation in their inner region after z = 1 at an almost constant level and above the median sSFR evolution for all galaxies in the stellar mass range. We also note that epochs of late gradual compaction of individual Compacts tend to occur during times when the inner sSFR is enhanced. For example, the green CompactMB shrinks between lookback times of 6 and 2.5 Gyr, which corresponds to a higher inner sSFR compared to the median sSFR evolution of all galaxies in our adopted range of stellar masses. This panel is also interesting as it shows both rapid fluctuations in inner sSFR, especially for Compacts, and also that individual galaxies can move above and below the median trend by typically 0.4 dex, and sometimes downwards by 0.8 dex.
The bottom panels of Fig. 9 show the evolution of the ratio between the sSFR in the inner region and that in the outer regions of the galaxy (in terms of r1/2). Compacts (especially CompactsSB) have concentrated star formation after z = 1 (ratio above 1). In particular, the periods of gradual compaction of Compacts are even better matched to the ratio of inner to outer sSFR than to the inner sSFR itself (middle panel). For example, the brown CompactSB rapidly shrinks between lookback times of 7 to 5 Gyr, when the inner sSFR is 1.8 times the outer one; and continues to shrink more gradually in the last 5 Gyr, when the inner sSFR is still 1.4 times the outer sSFR.
3.7. Radial profiles
Figure 10 shows the median radial profiles at different redshifts for the radial velocity of the gas, gas specific angular momentum normalized by the radius, gas density, sSFR, and stellar density.
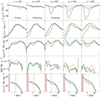 |
Fig. 10. Median radial profiles of physical quantities of 30 random galaxies (10 random galaxies for each size class) that end up as centrals at different epochs: radial velocity of the gas (first row), gas specific angular momentum normalized by the radius (second row), gas density times r2 (third row), sSFR (fourth row), and stellar density times r2 (fifth row). The r values have been converted to physical kiloparsecs. The colors are the same as in Fig. 3. The pink shaded regions indicate the redshift-dependent, poorly resolved radii and the dashed vertical lines indicate the redshift-dependent stellar half-mass radius. |
CompactsSB have an intense gas infall compared to the other galaxies starting at z ∼ 0.5. This infall seems to be related to the lower angular momentum in the inner regions of the Compacts (as shown in the second row of Fig. 10): at z ∼ 0.5, CompactsSB have a specific angular momentum at r = 1 kpc that is only half of that of Normals and CompactsMB. CompactsMB also show lower angular momentum, but only at z ∼ 0.2 for r ≲ 0.7 kpc. The higher angular momentum of Normals prevents the gas from efficiently infalling.
As a result of these trends in gas infall, the gas density profiles (third row of Fig. 10) of CompactsSB and CompactsMB display a relative under-density at r ∼ 1 kpc for z = 0.2 (about three times lower than the Normals), while these galaxies have instead denser gas than Normals in the inner regions (below r ∼ 0.7 kpc).
The gas kinematics should have a strong influence on the SFR. The fourth row of Fig. 10 shows the evolution of the radial profile of sSFR. While Normals display only small gradients in sSFR at all times, CompactsSB have a double-peaked sSFR profile at redshifts of unity and lower, with a deficiency in the intermediate region (r ∼ 1.5 kpc) at z = 1 and 0.5 (by respective factors of three and over ten) relative to peak sSFR efficiencies at r ∼ 0.5 and ∼4 kpc. CompactsMB also display this relation, but only after z ∼ 0.2. The sSFR gradients agree with those seen in Fig. 4. This shows that the compaction of CompactsSB is related to intense star formation in the core. Central CompactsMB have the same evolution, albeit not as strong as for CompactsSB. This suggests that CompactsSB are extreme cases of central CompactsMB.
The bottom row of Fig. 10 shows the evolution of the stellar density profile. Compared to the main progenitors of central Normals (solid orange), the main progenitors of central CompactsSB (solid green) have lower stellar densities at 1 kpc at all times, but have steeper inner stellar density profiles, catching up with the density of the Normals at the resolution limit of ≈300 pc. CompactsMB (solid blue) have similar stellar densities to Normals (solid orange) at all radii before z = 0.5, when they start to have higher stellar density in the inner region.
Figure 10 reveals that the concentrated star formation of Compacts is the consequence of stronger gas infall, which in turn is due to its lower angular momentum. We see in Sects. 3.3 and 3.4 that Compacts tend to undergo fewer mergers and interactions and also live in lower mass halos, with fewer satellites. Therefore, the environment can have an influence on the angular momentum of dwarf galaxies: a denser environment and more galaxy mergers lead to different gas distributions, where lower angular momentum does not accumulate in the inner regions.
4. What physical mechanisms make TNG50 galaxies compact?
We now explore the different physical mechanisms leading to Compact galaxies in TNG50.
4.1. Mergers of globular clusters?
If Compacts were formed by the mergers of globular clusters, we would expect to see an enhanced merger rate at the epochs of globular cluster mergers. However, the median ex situ fraction of stellar mass is lower in Compacts than in Normals at all epochs (dashed curves in the top panel of Fig. 5). Thus, at best, only a small minority of Compacts could be formed by mergers of globular clusters.
4.2. Initial compactness?
If central Compacts were initially small upon formation of their most massive progenitors, one would see this in the median trends of main progenitor size. However, the early (z > 4) sizes of the main progenitors of central Compacts are a good match to those of Normals (Fig. 3). Therefore, the origin of Compacts in TNG50 cannot be ascribed to initial compactness.
4.3. Active galactic nuclei?
In TNG50, a BH is seeded in a subhalo only if its halo mass exceeds 7.3 × 10¹⁰ M⊙ (Weinberger et al. 2017). Therefore, central galaxies that have a lower mass-accretion rate will have more difficulty in hosting a BH. During galaxy evolution, this accretion can be produced by mergers and interactions, which help a galaxy to reach the TNG halo mass threshold that needs to be met in order to grow a BH.
At z = 1, the BH occupation fractions of central Compacts are much smaller than for Normals: 0% and 8% of CompactsSB and CompactsMB have BHs in contrast to 31% of Normals. By z = 0, the BH occupation fractions evolve to 22%, 49%, and 60% for CompactsSB, CompactsMB, and Normals, respectively. These lower occupation fractions are due the lower halo masses of dwarf galaxies, as seen in Fig. 7 (even Normals have a median z = 0 halo mass that is relatively close to the threshold for seeding a BH).
There are three classes of BH occupation: galaxies that never hosted a BH, galaxies that have a BH at z = 0, and galaxies that had a BH in the past and lost it. We discard this latter class of BH occupation, and refer to the first and second ones as “without BH” and “with BH”, respectively.
Figure 11 shows the evolution of size split by z = 0 BH occupation. The size evolution is only slightly altered for galaxies with BHs. The sizes of Normals are significantly larger if they end up with BHs than if they do not, as expected. However, for Compacts, the z = 0 sizes are only weakly affected by the presence of BHs. Therefore, the absence of the BH, and henceforth the absence of AGN feedback cannot be the main driver of the production of Compacts. Indeed, comparing several nonpublic higher-resolution TNG simulations with different subgrid physics, Pillepich et al. (2018a, lower-right panel of their Fig. 8) found that BH feedback has no influence on the sizes of low-mass galaxies at z = 0.
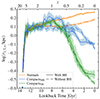 |
Fig. 11. Median evolution of half-mass radius for central galaxies with a BH at z = 0 (solid lines) or that never had a BH (dashed lines). The colors correspond to those in Fig. 3. |
4.4. Initial halo spin?
Analyzing the Illustris-5 simulation, Rodriguez-Gomez et al. (2017) suggested that the angular momentum of the halo is the key parameter defining the morphology of a dwarf galaxy. The second rows of Fig. 10 shows that, at z = 1.5 and z = 1, before the stellar compaction, the gas angular momentum profiles of Compacts are not so different from those of Normals. The difference in gas spin of Compacts becomes apparent at z = 0.5, especially for the inner regions. At this time, Compacts already have smaller sizes than Normals, which shows that the initial halo spin is not the deciding factor causing Compacts to become compact, although the decrease in size is related to the gas distribution in these galaxies.
4.5. Lack of mergers and rapid interactions?
In Sect. 3.3, we show that mergers contribute only a few percent to the z = 0 stellar mass of all three size classes of galaxies (3% for Normals and ∼2% for Compacts; see the top panel of Fig. 5). Also, Compacts acquire their ex situ mass earlier, and after z ∼ 2 their ex situ mass growth is slower than that of Normals as they evolve “passively” through accretion and in situ star formation. These results suggest that the lack of mergers plays a role in the formation of the Compact galaxies.
For the same galaxies as Fig. 10, we computed the ex situ contributions for the gas and DM components, which are not provided in the TNG supplementary catalogs. Figure 12 shows that starting at z = 5, CompactsSB have only half the ex situ gas and DM mass of the CompactsMB and Normals, and this ratio remains until z = 0. On the other hand, the ex situ masses of all three components of CompactsMB are similar to those of the Normals. This again reveals a difference between the two size classes of Compacts. However, while CompactsMB have a similar ex situ mass to Normals, mergers stopped contributing earlier to their mass growth, as we see in Fig. 6.
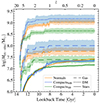 |
Fig. 12. Same as the bottom panel of Fig. 5, but for the total ex situ mass, split into the three components. Only the 30 galaxies considered in Fig. 10 are shown here. |
4.6. Low-angular-momentum mergers?
Mergers may prevent galaxies from growing in size if the specific orbital angular momentum of the merging galaxies is greater than the internal specific angular momentum of the two galaxies. We checked whether or not the progenitors of the present-day Compacts suffered early from lower-orbital-angular-momentum encounters than Normals, analyzing the same random galaxies used in Fig. 10.
Then, through their merger trees, we computed the angular momentum of the system that encloses the main progenitor and the secondary galaxy. To this end, we computed the importance of the orbital angular momentum of the merging system using
 (3)
(3)
where jmerger is the specific angular momentum of the system, jmax is the maximum value, while r12 and v12 are the position and velocity in the main progenitor frame, respectively. Values close to unity indicate very high-angular-momentum mergers. We do not find any statistically difference between the median values for jmerger/jmax, finding 0.86 and 0.87 for CompactsSB and CompactsMB, respectively, while Normals have a median of 0.88. Thus, mergers tend to be high angular momentum regardless of the galaxy size class. This indicates that rather than the merger properties, it is the merger frequency and contribution that are the key drivers of the growth of Compacts, as discussed in Sect. 3.3.
4.7. Low-angular-momentum-gas infall?
The top panels of Fig. 10 clearly indicate that Compacts tend to have inner gas infall (which is particularly intense for CompactsSB), leading to concentrated star formation, and then to a young stellar core, making the galaxy compact.
More precisely, gas infall leads to the accumulation of lower-angular-momentum gas in the center (second row of panels of Fig. 10). This suggests that gas infall is caused by the accretion of lower-angular-momentum gas onto the galaxy. To verify this, Fig. 13 shows the angular momentum evolution for the outer (recent infalling) gas particles: vr < 0 km s−1 and r > 2 r1/2, gas.
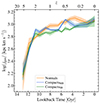 |
Fig. 13. Same as Fig. 3, but for the angular momentum of the current accreting gas (negative radial velocity, vr < 0 km s−1) measured in the region above two times the half-gas-mass radius (r > 2 r1/2, gas). Only the 30 galaxies considered in Fig. 10 are shown here, for 13 epochs. |
We computed the median angular momentum for the same 30 central galaxies considered in Fig. 10 at 13 snapshots, roughly regularly spaced in time. Figure 13 indicates that, from z = 1 (5.5 Gyr lookback time) to z = 0.25 (3 Gyr lookback time), the gas infalling onto Compacts has a lower angular momentum than that infalling onto Normals, except for central CompactsMB at one epoch (z = 0.5). This time interval corresponds to the epoch of decreasing size for Compacts. Therefore, the infall of low-angular-momentum gas appears to be linked to the compaction of dwarf galaxies.
5. Discussion
5.1. Comparison to previous work
First, our findings agree with those of Deeley et al. (2023) that Compacts ending up as centrals preferentially form stars in their inner regions. However, while these authors explain that these Compacts grew by continuous growth, they do not explain why they became compact.
We now compare our main conclusion with other previous works, namely that Compact dwarf galaxies that are centrals (or isolated) shrunk as a result of a lack of mergers between z ∼ 2 and z ∼ 0, allowing gas infall, inner star formation, and the buildup of a stellar core.
Several studies point to different scenarios for massive galaxies. In a series of articles, A. Dekel and Collaborators (Dekel & Burkert 2014; Zolotov et al. 2015; Lapiner et al. 2023) argued that massive galaxies at z ∼ 2 went through the following steps: their gas disks, fed by powerful accreting streams and minor mergers, became unstable, creating important clumps that then spiraled into the center by dynamical friction, where they merged with the central one, and building up a compact star forming galaxy that they coined a “blue nugget”; these blue nuggets passively evolve into “red nuggets”. Mergers of gas-rich dwarf galaxies were proposed as the mechanism forming blue compact dwarfs (e.g., Bekki 2008; Watts & Bekki 2016). The merger will lead to a central gas concentration that results in starburst.
However, mergers are rare for dwarf galaxies (Cattaneo et al. 2011). The lack of mergers also suppresses the minor mergers as one avenue to generate the violent disk instability mechanism outlined above. The TNG50 simulations point to the opposite scenario: those Compacts that end up as centrals are caused by a lack of mergers, allowing gas infall to produce efficient star formation in the inner regions.
Although central Compacts have gas infall (Fig. 10), they do not show gas contraction, contrary to the red nuggets scenario. This suggests that gas infall maintains the reservoir for inner star formation without concentrating gas in the galaxy cores.
Finally, Lohmann et al. (2023) studied the formation of massive compact galaxies (MCGs) in TNG100 and showed that these galaxies formed by the accretion of low-angular momentum gas. Although this scenario is similar to central Compact dwarf population evolution (Sect. 4.7), the dwarf galaxies shrink from z = 1 onward in contrast to the MCGs, which do not shrink, but experience much slower growth in size than other high-mass galaxies.
5.2. Are our results caused by the limitations of the simulation?
5.2.1. Resolution effects
It is possible that the 288 pc softening scale of the star and DM particles at z < 1 (and constant comoving resolution at earlier epochs) could severely affect our results. As the gas resolution is much finer, if stars form in a thin disk, they will later diffuse into a thicker disk. This diffusion occurs in a numerical two-body relaxation time, which may be faster or slower than that observed or expected from different diffusion mechanisms (molecular clouds, Spitzer & Schwarzschild 1951; spiral arms, Barbanis & Woltjer 1967; black holes, Lacey & Ostriker 1985; minor mergers, Tóth & Ostriker 1992; ingested satellites, Quinn et al. 1993; and DM subhalos, Font et al. 2001).
Pillepich et al. (2019) argued that the sizes of galaxies with M⋆ > 108 M⊙ are correctly resolved in TNG50. However, its limited resolution may explain why our Compacts are much bigger than compact ellipticals and ultracompact dwarfs in our range of stellar masses (8.4 < log(M⋆/M⊙) < 9.2).
We compared the TNG50 dwarfs to similar-mass dwarfs from a complete observational sample: the fourth data release of the Galaxy and Mass Assembly (GAMA) survey (Driver et al. 2022). We computed the sizes by taking the galaxy redshifts and masses from the GAMA StellarMassesv19 table, and the i-band effective (projected half-light) radii from the single-Sérsic fits provided in the SersicCatSDSSv09 table. We used the MagPhysv06 table for the specific star formation rates. We selected the galaxies between z = 0.002 and z = 0.025 in our stellar mass range (8.2 < log(M⋆/M⊙) < 9.4), restricting our sample to galaxies whose log size error is smaller than 0.1. To compare with the TNG50 galaxies, we used the TNG50 supplementary data catalog Stellar Projected Sizes (Genel et al. 2018) for the z = 0 i-band effective radii at a random orientation.
Figure 14 shows the relation between effective radius and stellar mass for both the TNG50 galaxies and those observed in the GAMA survey. TNG50 reproduces the observed SMR for Normals and CompactsMB galaxies fairly well. But we note that for galaxies with stellar mass with 8.4 < log(M⋆/M⊙) < 8.8, the GAMA survey shows a greater number of very compact galaxies than the TNG50, where the smallest effective radius is ∼100 pc. Indeed, the CompactsSB in TNG50 are at the size resolution of TNG50 at z = 0 (black lines in the upper panels of Fig. 9) and would probably have been smaller in a similar simulation with better spatial resolution.
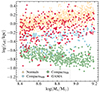 |
Fig. 14. Present-day half-projected-light radius vs. stellar mass relation, for GAMA and TNG50 galaxies. The triangles, circles, and diamonds distinguish the different samples, respectively: Normals, CompactsMB, and CompactsSB, while the stars represent all the galaxies in GAMA. |
5.2.2. The secondary branch
The existence of the clearly distinguished secondary branch may be caused by a physical process causing runaway stellar compaction. Identifying this process is not straightforward.
We note several differences between CompactsMB and CompactsSB: (1) the former tend to end up as satellites, while the latter tend to end up as centrals (Table 1); (2) the CompactsSB have lower ex situ fractions than the CompactsMB (Fig. 12); and (3) the preference for inner star formation is much more pronounced in the CompactsSB (bottom panel of Fig. 4).
Therefore, we conclude that CompactsSB are extreme cases of Compacts in terms of concentrated star formation. This concentrated star formation leads to an anticorrelation between size and stellar mass: galaxies with higher stellar mass (that form more stars in their inner regions) have smaller sizes. This is what we see clearly in the secondary branch (Fig. 1).
The intensity of the inner star formation depends on the inner gas infall (top panels of Fig. 10), which is controlled by importance of major and intermediate mergers: below a certain level of importance there is uncontrolled inner gas infall.
The small sizes of the stellar components of CompactsSB are at the limit of the spatial resolution (softening scale) of TNG50. With better resolution, the secondary branch of the SMR would extend to lower sizes and thus not be so sharp. However, we are not presently able to explain the gap between the two branches, beyond our finding that the CompactsSB are the result of intense concentrated star formation.
Figure 14 shows a possible gap in the GAMA SMR at effective radii that increase from 140 pc to 450 pc (log(reff/kpc) between ≃ − 0.85 and −0.35) between log(M⋆/M⊙) = 8.4 and 9.2, but it is not as pronounced as in TNG50. This gap in GAMA is also seen as the abrupt rise in Fig. 15 of the GAMA counts at log(reff/kpc)≃ − 0.7 (200 pc). The histogram of log sizes weakens the observed gap, the location of which in the SMR increases slightly with stellar mass, as noted above. However, a Hartigan dip test (Hartigan & Hartigan 1985) of the residuals of log r1/2 indicates that this gap is not statistically significant. Furthermore, it is less pronounced if we increase the maximum redshift for our sample of GAMA dwarfs.
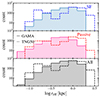 |
Fig. 15. Normalized size distributions for GAMA and TNG50 galaxies, split between star forming (blue, top) and passive (red, center). The bottom panel shows the distribution for all galaxies. Each GAMA galaxy was weighted in inverse proportion to the volume up to which it can be seen. |
5.2.3. High star formation rates in the cores of Compacts
It is difficult to understand why the simulated Compacts tend to be more highly star forming than Normals, while the opposite trend appears in the SDSS (Shen et al. 2003). Figure 15 shows that the star forming galaxies show a bimodality in TNG50 that is not present in GAMA. Also, passive galaxies are likely to have smaller sizes in GAMA than in TNG50.
One possible explanation for this is that TNG50 is missing low-mass BHs in dwarf galaxies in general and in the CompactsSB in particular. More precisely, the minimum halo mass to seed a BH is 7.3 × 10¹⁰ M⊙ in the TNG simulations, which may be too large (at least in TNG50) and lead to excessively low BH occupation fractions, especially for Compacts that have a lower contribution from mergers and therefore have more difficulty reaching the threshold to seed a BH.
As seen in Fig. 4, not only are Compacts bluer (they have higher sSFR) than Normals, but they have blue cores (their sSFR is higher in their cores). Although the presence or absence of the BH does not affect the decrease in the size of Compacts (Sect. 4.3), central feedback from the BH could perhaps regulate this higher sSFR. Both TNG50 star formation and BH prescriptions may favor concentrated star formation and thus the formation of compact dwarf galaxies.
6. Conclusions
In this first study analyzing the TNG50 cosmological hydrodynamical simulation to explore which mechanisms regulate the corpulence of galaxies, we explored the physical mechanisms that cause central dwarf galaxies to become Compact. We selected dwarf galaxies according to their z = 0 properties: stellar log masses were between 8.4 and 9.2 (solar units). We called to “Compacts” those galaxies lying in the lower envelope of the main branch of the size–mass relation (“CompactsMB”) – easily selected using Eqs. (1) and (2) – as well as the dwarfs in the secondary branch, with a stellar half-mass radius of below 450 pc (“CompactsSB”), while the galaxies that ended with larger sizes are referred to as “Normals”. We furthermore restricted our samples to the Compacts and Normals that ended up as centrals of their hosts.
Galaxies that end up as central Compacts typically have a similar size evolution to Normals until z = 0.8, at which point they start shrinking, while the Normals continue to grow (Fig. 3). Central Compacts live in lower density environments (Fig. 7), and have lower ex situ stellar mass fractions (Figs. 5, 11 and 12). These are the galaxies that suffered fewer major and intermediate mergers before z = 1 (Figs. 5 and 6) and accreted more lower angular momentum gas (Fig. 13).
These mergers would otherwise pump their orbital angular momentum into the remnant and prevent radial gas inflow. Here, the gas infall is ubiquitous and produces concentrated star formation (Figs. 4 and 10), which leads to the formation of a stellar core and makes the galaxy more spherical (Fig. 8). While this lack of mergers prevents the formation and growth of BHs –whose AGN could prevent the gas infall–, the rare presence or not of a BH has little effect on the evolution of the stellar sizes of Compacts, in contrast to the situation for Normals (Fig. 11). The compaction of individual central Compacts is gradual and occurs when the ratio of inner to outer sSFR is enhanced (Fig. 9). Their gas infall (much stronger in CompactsSB than in CompactsMB) occurs while their gas half-mass-radii keep growing (Fig. 3).
It is not clear how our conclusions depend on the limitations of the TNG50 simulation. Observed Compacts from the GAMA survey also show weak but insignificant signs of bimodality in size (Fig. 14). However, while the CompactsSB are typically star forming – with “blue” cores (Fig. 4), as observed in some compact dwarfs – and appear round (Fig. 8), GAMA Compacts tend to be passive (Fig. 15). This difference may be caused by the absence of BHs in very low-mass halos in the subgrid physics of TNG50. Therefore, a similar study to the present one ought to be repeated with current (e.g., NewHorizon, Dubois et al. 2021 and FIRE-2, Wetzel et al. 2023) and future high-resolution cosmological hydrodynamical simulations.
All our logarithms are in base 10.
We used sklearn.mixtureGaussianMixture, considering both good- and bad-flag subhalos.
These stellar masses correspond to those enclosed in a sphere of twice the stellar half-mass radius in order to mimic the fact that observers have trouble measuring the outer luminosities (hence stellar masses) of galaxies.
Our merger nomenclature differs from that of the TNG database, which denotes “minor” mergers as stellar mass ratios from 1/4 to 1/10 (what we call intermediate).
We do not impose a threshold in mass on the satellites around our centrals.
Acknowledgments
We thank the anonymous referee for useful comments. A.P.A. thanks the São Paulo Research Foundation, FAPESP, for financial support through contracts 2022/05059-2 and 2020/16152-8. G.B.L.N. acknowledges partial financial support from CNPq grant 303130/2019-9.
References
- Barbanis, B., & Woltjer, L. 1967, ApJ, 150, 461 [NASA ADS] [CrossRef] [Google Scholar]
- Barnes, J. E., & Hernquist, L. E. 1991, ApJ, 370, L65 [Google Scholar]
- Barnes, J. E., & Hernquist, L. 1992, ARA&A, 30, 705 [Google Scholar]
- Bekki, K. 2008, MNRAS, 388, L10 [Google Scholar]
- Bernardi, M., Roche, N., Shankar, F., & Sheth, R. K. 2011, MNRAS, 412, 684 [NASA ADS] [CrossRef] [Google Scholar]
- Brodie, J. P., Romanowsky, A. J., Strader, J., & Forbes, D. A. 2011, AJ, 142, 199 [NASA ADS] [CrossRef] [Google Scholar]
- Cattaneo, A., Mamon, G. A., Warnick, K., & Knebe, A. 2011, A&A, 533, A5 [NASA ADS] [CrossRef] [EDP Sciences] [Google Scholar]
- Chilingarian, I. V., & Mamon, G. A. 2008, MNRAS, 385, L83 [NASA ADS] [CrossRef] [Google Scholar]
- Dashyan, G., Choi, E., Somerville, R. S., et al. 2019, MNRAS, 487, 5889 [NASA ADS] [CrossRef] [Google Scholar]
- Davis, M., Efstathiou, G., Frenk, C. S., & White, S. D. M. 1985, ApJ, 292, 371 [Google Scholar]
- Deeley, S., Drinkwater, M. J., Sweet, S. M., et al. 2023, MNRAS, 525, 1192 [NASA ADS] [CrossRef] [Google Scholar]
- Dekel, A., & Burkert, A. 2014, MNRAS, 438, 1870 [Google Scholar]
- Dekel, A., & Silk, J. 1986, ApJ, 303, 39 [Google Scholar]
- Dekel, A., Sari, R., & Ceverino, D. 2009, ApJ, 703, 785 [Google Scholar]
- Driver, S. P., Bellstedt, S., Robotham, A. S. G., et al. 2022, MNRAS, 513, 439 [NASA ADS] [CrossRef] [Google Scholar]
- Dubois, Y., Beckmann, R., Bournaud, F., et al. 2021, A&A, 651, A109 [NASA ADS] [CrossRef] [EDP Sciences] [Google Scholar]
- Font, A. S., Navarro, J. F., Stadel, J., & Quinn, T. 2001, ApJ, 563, L1 [NASA ADS] [CrossRef] [Google Scholar]
- Furlong, M., Bower, R. G., Crain, R. A., et al. 2017, MNRAS, 465, 722 [Google Scholar]
- Genel, S., Fall, S. M., Hernquist, L., et al. 2015, ApJ, 804, L40 [NASA ADS] [CrossRef] [Google Scholar]
- Genel, S., Nelson, D., Pillepich, A., et al. 2018, MNRAS, 474, 3976 [Google Scholar]
- Gunn, J. E., & Gott, J. R., III 1972, ApJ, 176, 1 [Google Scholar]
- Guo, Q., & White, S. D. M. 2008, MNRAS, 384, 2 [NASA ADS] [CrossRef] [Google Scholar]
- Hartigan, J. A., & Hartigan, P. M. 1985, Ann. Stat., 13, 70 [Google Scholar]
- Haslbauer, M., Dabringhausen, J., Kroupa, P., Javanmardi, B., & Banik, I. 2019, A&A, 626, A47 [NASA ADS] [CrossRef] [EDP Sciences] [Google Scholar]
- Kroupa, P. 1998, MNRAS, 300, 200 [NASA ADS] [CrossRef] [Google Scholar]
- Lacey, C. G., & Ostriker, J. P. 1985, ApJ, 299, 633 [NASA ADS] [CrossRef] [Google Scholar]
- Lapiner, S., Dekel, A., Freundlich, J., et al. 2023, MNRAS, 522, 4515 [NASA ADS] [CrossRef] [Google Scholar]
- Lohmann, F. S., Schnorr-Müller, A., Trevisan, M., Ricci, T. V., & Clerici, K. S. 2023, MNRAS, 524, 5266 [NASA ADS] [CrossRef] [Google Scholar]
- Mahani, H., Zonoozi, A. H., Haghi, H., et al. 2021, MNRAS, 502, 5185 [NASA ADS] [CrossRef] [Google Scholar]
- Mamon, G. A. 1987, ApJ, 321, 622 [NASA ADS] [CrossRef] [Google Scholar]
- Marinacci, F., Vogelsberger, M., Pakmor, R., et al. 2018, MNRAS, 480, 5113 [NASA ADS] [Google Scholar]
- Merritt, D. 1983, ApJ, 264, 24 [NASA ADS] [CrossRef] [Google Scholar]
- Mieske, S., Hilker, M., & Infante, L. 2002, A&A, 383, 823 [CrossRef] [EDP Sciences] [Google Scholar]
- Mieske, S., Hilker, M., & Misgeld, I. 2012, A&A, 537, A3 [NASA ADS] [CrossRef] [EDP Sciences] [Google Scholar]
- Misgeld, I., & Hilker, M. 2011, MNRAS, 414, 3699 [Google Scholar]
- Moore, B., Katz, N., Lake, G., Dressler, A., & Oemler, A. 1996, Nature, 379, 613 [Google Scholar]
- Naiman, J. P., Pillepich, A., Springel, V., et al. 2018, MNRAS, 477, 1206 [Google Scholar]
- Nelson, D., Pillepich, A., Springel, V., et al. 2018, MNRAS, 475, 624 [Google Scholar]
- Nelson, D., Pillepich, A., Springel, V., et al. 2019, MNRAS, 490, 3234 [Google Scholar]
- Pillepich, A., Springel, V., Nelson, D., et al. 2018a, MNRAS, 473, 4077 [Google Scholar]
- Pillepich, A., Nelson, D., Hernquist, L., et al. 2018b, MNRAS, 475, 648 [Google Scholar]
- Pillepich, A., Nelson, D., Springel, V., et al. 2019, MNRAS, 490, 3196 [Google Scholar]
- Planck Collaboration XIII. 2016, A&A, 594, A13 [NASA ADS] [CrossRef] [EDP Sciences] [Google Scholar]
- Quinn, P. J., Hernquist, L., & Fullagar, D. P. 1993, ApJ, 403, 74 [Google Scholar]
- Richstone, D. O. 1976, ApJ, 204, 642 [NASA ADS] [CrossRef] [Google Scholar]
- Rodriguez-Gomez, V., Pillepich, A., Sales, L. V., et al. 2016, MNRAS, 458, 2371 [Google Scholar]
- Rodriguez-Gomez, V., Sales, L. V., Genel, S., et al. 2017, MNRAS, 467, 3083 [Google Scholar]
- Schnorr-Müller, A., Trevisan, M., Riffel, R., et al. 2021, MNRAS, 507, 300 [CrossRef] [Google Scholar]
- Shen, S., Mo, H. J., White, S. D. M., et al. 2003, MNRAS, 343, 978 [NASA ADS] [CrossRef] [Google Scholar]
- Silk, J., & Rees, M. J. 1998, A&A, 331, L1 [NASA ADS] [Google Scholar]
- Spitzer, L., & Schwarzschild, M. 1951, ApJ, 114, 385 [NASA ADS] [CrossRef] [Google Scholar]
- Springel, V. 2010, MNRAS, 401, 791 [Google Scholar]
- Springel, V., White, S. D. M., Tormen, G., & Kauffmann, G. 2001, MNRAS, 328, 726 [Google Scholar]
- Springel, V., Pakmor, R., Pillepich, A., et al. 2018, MNRAS, 475, 676 [Google Scholar]
- Tóth, G., & Ostriker, J. P. 1992, ApJ, 389, 5 [NASA ADS] [CrossRef] [Google Scholar]
- van Dokkum, P. G., Franx, M., Kriek, M., et al. 2008, ApJ, 677, L5 [Google Scholar]
- Wang, K., Peng, E. W., Liu, C., et al. 2023, Nature, 623, 296 [NASA ADS] [CrossRef] [Google Scholar]
- Watts, A., & Bekki, K. 2016, MNRAS, 462, 3314 [NASA ADS] [CrossRef] [Google Scholar]
- Weinberger, R., Springel, V., Hernquist, L., et al. 2017, MNRAS, 465, 3291 [Google Scholar]
- Wetzel, A., Hayward, C. C., Sanderson, R. E., et al. 2023, ApJS, 265, 44 [NASA ADS] [CrossRef] [Google Scholar]
- Zolotov, A., Dekel, A., Mandelker, N., et al. 2015, MNRAS, 450, 2327 [Google Scholar]
All Tables
All Figures
|
Fig. 1. Present-day stellar half-mass radius vs. stellar mass (within 2 stellar half-mass radii), highlighting our adopted samples of Compacts and Normals (both centrals and satellites). The orange, blue, and green circles are the different samples, respectively: Normals, CompactsMB (Main branch) and CompactsSB (Secondary branch), while the gray dots are all the subhalos in the stellar mass range. The triangles are bad-flag galaxies. The red solid line is the separation made with a Gaussian mixing model (GMM). |
| In the text | |
|
Fig. 2. Gas fraction versus stellar fraction at z = 0. The masses of each component are summed over the full subhalo. The orange, blue, and green circles are the different size classes, respectively: Normals, CompactsMB, and CompactsSB. The blue dashed line indicates equality. The star symbols indicate the median values for the gas and stellar mass fractions. |
| In the text | |
|
Fig. 3. Median evolution of the half-mass radii (top) and total masses (bottom) of the Normals (orange), CompactsMB (blue), and CompactsSB (green) for galaxies that end up as centrals at z = 0. The solid, dashed, and dotted lines represent the stellar, gas, and DM components, respectively, and all quantities are measured over the entire subhalos. The lines are the medians, and are only shown when we have at least five galaxies at that epoch; the shaded region shows the uncertainty on the median, estimated using bootstraps. |
| In the text | |
|
Fig. 4. Same as Fig. 3, but for the median evolution of the sSFR in the inner region (r < r1/2) (top) and the ratio between the sSFRs in the inner and outer regions (r > r1/2) (bottom). |
| In the text | |
|
Fig. 5. Same as Fig. 3, but for the median evolution of the ex situ stellar mass. Top: ex situ mass normalized by the final ex situ mass (solid) or final (ex situ + in situ) stellar mass (i.e., ex situ stellar mass fraction, dashed). All masses are measured over the entire subhalo. Center and bottom: ex-situ stellar mass from major mergers (stellar mass ratio > 1/4, solid lines), intermediate mergers (stellar mass ratio between 1/4 and 1/10, dashed lines), and minor mergers (stellar mass ratio below 1/10, dotted lines). |
| In the text | |
|
Fig. 6. Distributions of the epochs of the last mergers. The left, middle, and right panels show the major (stellar mass ratio M2/M1 > 1/4), intermediate (1/10 < M2/M1 < 1/4), and minor (M2/M1 < 1/10) mergers, respectively. The vertical segments indicate the median of each distribution. The colors are the same as in Fig. 3. |
| In the text | |
|
Fig. 7. Same as Fig. 3, but for the median evolution of the satellite number (top) and halo mass M200 (bottom) for central galaxies. |
| In the text | |
|
Fig. 8. Same as Fig. 3, but for the median evolution of the sphericity of the stellar distribution for all galaxies. The high (respectively low) values indicate spherical (flat) galaxies. |
| In the text | |
|
Fig. 9. Individual histories of the half-mass radius (top), inner sSFR (second row), and the ratio between the sSFRs in the inner and outer regions (bottom) for five randomly selected Normals (left), CompactsMB (center), and CompactsSB (right). Each line corresponds to the evolution of a single galaxy. The symbols indicate major mergers (large circles, with stellar mass ratio > 1/4) or intermediate mergers (intermediate-size squares, with stellar mass ratio between 1/10 and 1/4). The minor mergers are not shown for clarity. Thicker lines indicate when the galaxy hosts a central BH. The thick black lines show the evolution of the softening radius, while the gray shaded regions show the ±1σ region for the sSFR median evolution of all galaxies in the stellar mass range: 8.4 < log(M⋆/M⊙) < 9.2. |
| In the text | |
|
Fig. 10. Median radial profiles of physical quantities of 30 random galaxies (10 random galaxies for each size class) that end up as centrals at different epochs: radial velocity of the gas (first row), gas specific angular momentum normalized by the radius (second row), gas density times r2 (third row), sSFR (fourth row), and stellar density times r2 (fifth row). The r values have been converted to physical kiloparsecs. The colors are the same as in Fig. 3. The pink shaded regions indicate the redshift-dependent, poorly resolved radii and the dashed vertical lines indicate the redshift-dependent stellar half-mass radius. |
| In the text | |
|
Fig. 11. Median evolution of half-mass radius for central galaxies with a BH at z = 0 (solid lines) or that never had a BH (dashed lines). The colors correspond to those in Fig. 3. |
| In the text | |
|
Fig. 12. Same as the bottom panel of Fig. 5, but for the total ex situ mass, split into the three components. Only the 30 galaxies considered in Fig. 10 are shown here. |
| In the text | |
|
Fig. 13. Same as Fig. 3, but for the angular momentum of the current accreting gas (negative radial velocity, vr < 0 km s−1) measured in the region above two times the half-gas-mass radius (r > 2 r1/2, gas). Only the 30 galaxies considered in Fig. 10 are shown here, for 13 epochs. |
| In the text | |
|
Fig. 14. Present-day half-projected-light radius vs. stellar mass relation, for GAMA and TNG50 galaxies. The triangles, circles, and diamonds distinguish the different samples, respectively: Normals, CompactsMB, and CompactsSB, while the stars represent all the galaxies in GAMA. |
| In the text | |
|
Fig. 15. Normalized size distributions for GAMA and TNG50 galaxies, split between star forming (blue, top) and passive (red, center). The bottom panel shows the distribution for all galaxies. Each GAMA galaxy was weighted in inverse proportion to the volume up to which it can be seen. |
| In the text | |
Current usage metrics show cumulative count of Article Views (full-text article views including HTML views, PDF and ePub downloads, according to the available data) and Abstracts Views on Vision4Press platform.
Data correspond to usage on the plateform after 2015. The current usage metrics is available 48-96 hours after online publication and is updated daily on week days.
Initial download of the metrics may take a while.