| Issue |
A&A
Volume 698, June 2025
|
|
|---|---|---|
| Article Number | A195 | |
| Number of page(s) | 11 | |
| Section | Extragalactic astronomy | |
| DOI | https://doi.org/10.1051/0004-6361/202453083 | |
| Published online | 17 June 2025 | |
Distinguishing the formation paths of massive compact early-type galaxies through their internal dynamical structures
1
Shanghai Astronomical Observatory, Chinese Academy of Sciences, 80 Nandan Road, Shanghai 200030, China
2
Instituto de Física, Universidade Federal do Rio Grande do Sul, Av. Bento Gonçalves 9500, Porto Alegre, R.S. 90040-060, Brazil
⋆ Corresponding author: This email address is being protected from spambots. You need JavaScript enabled to view it.
Received:
20
November
2024
Accepted:
11
April
2025
Abstract
Massive early-type galaxies (ETGs) are thought to form in two phases: an initial phase of rapid star formation and a later phase of mergers. A small fraction of these galaxies, referred to as ‘red nuggets’, formed during the first phase may have survived largely unaltered to the present day, having experienced no massive mergers since z ∼ 2. Nearby massive compact ETGs are considered candidates for such relic galaxies. We studied the internal dynamical structures of 15 compact ETGs with existing integral field unit (IFU) observations and 79 compact ETGs from the TNG50 simulation. We dynamically decomposed each galaxy into a disk, bulge, and hot inner stellar halo for both observations and simulations. In TNG50, the luminosity fraction of the hot inner stellar halo (or the size of the spheroid, which includes the bulge and halo) strongly correlates with the galaxy’s merger history. The true ‘merger-free’ galaxies show an extremely low fraction of hot inner stellar halo (or an extremely compact spheroid). Although such compactness could result from the tidal stripping of satellites, tidal forces would also destroy the dynamically cold disk (if one exists) when the halo is removed. Thus, a galaxy is guaranteed to be merger-free if it has a very low fraction of the hot inner stellar halo and retains a dynamically cold disk. Comparing observed galaxies with TNG50, we identify seven of the 15 compact ETGs (PGC 11179, UGC 3816, NGC 2767, NGC 1277, PGC 32873, PGC 12562, and PGC 70520) as true merger-free galaxies. These galaxies have compact, massive bulges that likely formed through secular heating, as supported by their TNG50 analogues.
Key words: galaxies: elliptical and lenticular / cD / galaxies: evolution / galaxies: kinematics and dynamics / galaxies: structure
© The Authors 2025
 Open Access article, published by EDP Sciences, under the terms of the Creative Commons Attribution License (https://creativecommons.org/licenses/by/4.0), which permits unrestricted use, distribution, and reproduction in any medium, provided the original work is properly cited.
This article is published in open access under the Subscribe to Open model. This email address is being protected from spambots. You need JavaScript enabled to view it. to support open access publication.
1. Introduction
Massive early-type galaxies (ETGs, M* > 1011 M⊙) in the local Universe are believed to have gone through two major formation phases (e.g. Naab et al. 2009; Oser et al. 2010; Du et al. 2021). The first phase of gas collapse and star formation burst happened early (at z ≳ 2) and rapidly formed a population of passively evolving objects seen at high redshift (hereafter high z), sometimes termed ‘red nuggets’ (e.g., Daddi et al. 2005; Damjanov et al. 2009; Valentino et al. 2020). In contrast, in the second phase, ETGs grew by accretion of material – not only through minor mergers but also through major mergers (Du et al. 2021; Zhu et al. 2022a) – that built up their haloes. Recent observations show that a higher fraction of ETGs at redshift z ≳ 3 are disk-dominated (Kartaltepe et al. 2023) and rotation-supported (D’Eugenio et al. 2024), whereas ETGs at the z ∼ 1 Universe are more rotation-supported than those at z ∼ 0 (Bezanson et al. 2018; D’Eugenio et al. 2023). This scenario supports merger-driven growth over the past few Gyr. A small fraction of these red nuggets is expected to have survived ‘frozen’ until the present-day Universe, with no massive mergers or significant star formation since z ∼ 2 (Quilis & Trujillo 2013).
Massive compact ETGs are found in both fields and clusters in the local Universe (Graham et al. 2015; Yıldırım et al. 2017; Tortora et al. 2020; Schnorr-Müller et al. 2021; Hon et al. 2022). Some exhibit properties remarkably similar to massive quiescent galaxies at high redshifts, including extreme compactness and old stellar populations (> 10 Gyr) (Trujillo et al. 2009; Ferré-Mateu et al. 2017; Martín-Navarro et al. 2019; Grèbol-Tomàs et al. 2023; Spiniello et al. 2024), making them candidate red-nugget relics from the high-z Universe.
Relic galaxies provide a unique way to gain insight into the early Universe, as they provide an ideal laboratory-preserved in time-for understanding early galaxies. Moreover, they serve as probes for detailed measurements that are challenging to obtain directly in high z galaxies. The relic galaxy NGC 1277 (Trujillo et al. 2014) offers an interesting case study as it exhibits extremely bottom-heavy stellar initial mass functions (IMFs) (Martín-Navarro et al. 2015), a single population of metal-rich globular clusters (GC) (Beasley et al. 2018), an over-massive black hole (BH) (van den Bosch et al. 2012; Walsh et al. 2015, 2016, 2017), evidence for a low dark matter (DM) fraction (Comerón et al. 2023), and a luminous X-ray halo (Fabian et al. 2013). However, other candidates exhibit diversity in their properties (Yıldırım et al. 2017; Ferré-Mateu et al. 2017). Analysis of a large sample of relic candidates in the INvestigating Stellar Population In RElics (INSPIRE) project (Spiniello et al. 2024) suggests that the IMF slope correlates with the degree of relicness (Maksymowicz-Maciata et al. 2024), quantified in terms of morphological and stellar population characteristics. The GC population studied in 12 nearby compact ETGs shows a predominantly higher fraction of red GCs, consistent with relic galaxy properties, but still with a relatively large scatter (Kang & Lee 2021; Alamo-Martínez et al. 2021). Rapid growth of BHs may occur in the early Universe, and simulations predict that relic galaxies may have over-massive BHs (Barber et al. 2016; van Son et al. 2019). BH masses have been measured in some compact ETGs; the BH mass is indeed overmassive in NGC 1271, NGC 1270, and MRK 1216 (Walsh et al. 2017; Ferré-Mateu et al. 2015), but is normal in UGC 2698 following the general black hole mass-bulge mass relation (Cohn et al. 2021).
Extremely compact and massive ETGs with uniformly old stellar populations are taken as evidence that they are relic galaxies (Ferré-Mateu et al. 2015, 2017; Martín-Navarro et al. 2019). However, a galaxy being strongly tidally stripped by the environment could also result in remnants with similar properties-including extreme compactness, uniformly old stellar populations, and overmassive BHs (van Son et al. 2019; Barber et al. 2016). It is thus critically important to find the true relic galaxies with extreme quiescent merger histories to distinguish them from compact ETGs shaped by strong tidal stripping. To achieve this, we require extra information to probe the merger history of these galaxies.
However, galactic dynamics can reveal fossil records of a galaxy’s merger history. Modern cosmological simulations, such as IllustrisTNG1 and EAGLE2, successfully reproduce a large number of galaxies with well-resolved structures that statistically match observations including the mass-size relation (Genel et al. 2018; Lange et al. 2016; de Graaff et al. 2022), galaxy concentration and bulge strength (Rodriguez-Gomez et al. 2019), disk scale height (Zanisi et al. 2021), and internal kinematic structures (Xu et al. 2019; Zhang et al. 2025). The mass of a hot inner stellar halo, dynamically defined by the stellar orbits with circularity λz < 0.5 and at r > 3.5 kpc, correlates strongly with the accreted stellar mass, especially for galaxies that underwent massive major mergers (Zhu et al. 2022a,b). This correlation is almost identical in TNG100, TNG50, and EAGLE, independent of resolution or galaxy formation model. However, compact ETGs with a low fraction of hot inner stellar halo exhibit relatively large scatter, necessitating further study.
The spatial resolutions of TNG100 and EAGLE are insufficient to resolve the internal structures of these extremely compact galaxies. However, TNG50 has the highest resolution while retaining a large number of galaxies in different environments (Nelson et al. 2019; Pillepich et al. 2019). Indeed, relic-like galaxies are found in TNG50 (Flores-Freitas et al. 2022; Deeley et al. 2023; Moura et al. 2024) across different environments. We analyse the internal dynamical structures of 15 compact ETGs from observations (Yıldırım et al. 2017) and a comparable sample of compact ETGs from TNG50, using identical dynamical definitions. By understanding the true assembly histories of these compact ETGs in TNG50, we propose key structural properties that can distinguish true ‘merger-free’ galaxies from other compact ETGs. Combining stellar populations and our analysis on dynamical structures will provide decisive criteria for identifying clean relic galaxies with extremely quiescent merger histories in observational data.
We organise the paper as follows. In Section 2, we describe the sample of compact ETGs from observations and simulations and define their internal dynamical structures. In Section 3, we directly compare the internal structure of observed and simulated compact ETGs with those from TNG50, using their known assembly histories to identify key evidence for distinguishing true merger-free galaxies. In Section 4, we illustrate two different formation pathways of compact ETGs in TNG50 by examining two typical cases. We discuss our findings in Section 5 and present our conclusions in Section 6.
2. Compact ETGs from observations and simulations
We studied compact ETGs from observations and the TNG50 cosmological simulation. This section details the general properties of the galaxy sample and the dynamical structure decomposition, first for observed galaxies and then for simulated galaxies. We employed identical methodologies to describe the dynamical structures of observed and simulated galaxies, ensuring direct comparability. The dynamical decomposition was based on the stellar orbit distribution, which was determined via distinct methodologies for observed and simulated galaxies, which we will describe separately.
2.1. Compact ETGs from observations
2.1.1. Sample from observations
We took 15 well-studied massive compact ETGs from observations (Yıldırım et al. 2017). These galaxies, observed with the Hubble Space Telescope (HST) and the wide-field integral field unit (IFU) instrument (Verheijen et al. 2004; Kelz et al. 2006), are confirmed to be massive, compact, and with uniformly old stellar populations, while exhibiting a variety of stellar kinematic features. The IFU observations were performed with the PPAK instrument (Verheijen et al. 2004; Kelz et al. 2006) on the 3.5 m telescope at Calar Alto. The luminosity-weighted stellar kinematic maps, including velocity v and velocity dispersion σ, were derived using pPXF (Cappellari 2017) from spectra covering 4200−7000 Å (Yıldırım et al. 2017). These galaxies were also observed by HST, which provides a high-resolution photometry image. We used identical kinematic maps and photometric data to those published in Yıldırım et al. (2017).
2.1.2. Orbit-superposition models
We derived the stellar orbit distribution for each galaxy using Schwarzschild’s orbit-superposition models, which simultaneously fits the luminosity density distribution and the kinematic maps. The methodology can be found in van den Bosch et al. (2008), Zhu et al. (2018a) and has been extended to include stellar age and metallicity (Zhu et al. 2020; Ding et al. 2023; Jin et al. 2024) and to model barred galaxies (Tahmasebzadeh et al. 2022, 2024). For these compact ETGs, we adopt the orbit-superposition models originally constructed by Yıldırım et al. (2017) using identical observational data and a consistent model construction. We briefly outline the main steps in the following paragraphs.
The orbit superposition model involves three major steps: first, generating a gravitational potential model with a few free parameters; second, calculating an orbit library in the gravitational potential; and third, inferring orbit weights through fitting the model to the data including the luminosity density and kinematic maps. We evaluated hundreds of models by exploring the free parameters in the gravitational potential, identifying the best-fitting models with a minimum χ2 between the model and the data. Finally, we obtained 3D models superposed by stellar orbits that reproduce all data with high fidelity.
The gravitational potential is generated by the combination of stellar mass, dark matter mass, and a central black hole fixed at 108 M⊙. While the black hole remains unresolved by the kinematic data, its inclusion does not impact our results. To obtain the stellar mass distribution, we first fit the HST H-band image with a Multiple Gaussian Expansion (MGE) model (Cappellari 2002). Adopting a set of viewing angles (ϑ, ψ, ϕ), we deprojected toward a triaxial MGE model that represents the intrinsic stellar luminosity density. The intrinsic stellar mass distribution was then derived by multiplying a constant stellar mass-to-light ratio M/L.
The three viewing angles are directly related to the three axis ratios (p, q, u) that describe the intrinsic 3D shape of the stellar luminosity distribution (van den Bosch et al. 2008). We leave the intrinsic intermediate-to-major and minor-to-major axis ratios (p, q) as free parameters but limit u = 0.98 − 0.9999, so moderate triaxiality is allowed in the model. The dark matter halo is assumed to be spherical with a Navarro-Frenk-White (NFW) (Navarro et al. 1997) radial profile parameterised by two free parameters: the halo mass M200, defined as the total mass enclosed within the Virial radius r200 (within which the average density is 200 times the critical density), and the concentration c defined as the ratio between the dark matter virial radius and the dark matter scale radius. This modelling approach matches that of Yıldırım et al. (2017). In total, we have five free hyperparameters in the model: M/L, p, q, M200, and c.
For each set of hyperparameters, we computed tens of thousands of orbits in the corresponding gravitational potential. Orbit sampling and calculations follow Zhu et al. (2018a). The orbit weights in the resulting orbit library were determined by simultaneously fitting the orbit superposition model to the intrinsic and projected luminosity density and stellar kinematic maps.
We evaluated hundreds of models with different hyperparameter combinations. After exploring the hyperparameter space, we selected the best-fitting models within the 1σ confidence level defined as:  , where nGH = 4 is the number of stellar kinematic moments and Nobs is the number of bins in each kinematic map. Typically, a few tens of models with different hyperparameter values fall within this 1σ confidence level for each galaxy, all of which adequately reproduce the luminosity density and kinematic maps. For our analysis, we adopted the best-fitting model with the minimum χ2.
Our method determined the weights of stellar orbits that contribute to the best-fitting model. The stellar orbit distribution of the model was characterised as the probability density of the stellar orbit in the phase space of r versus circularity λz following Zhu et al. (2018a). Each stellar orbit was described by two main properties: the time-averaged radius r, which represents the extent of the orbit, and the circularity λz = Jz/Jmax(E), which represents the angular momentum of the orbit around the minor z axis, normalised by the maximum for a circular orbit with the same binding energy E. Whereas |λz|∼1 represents dynamically cold orbits dominated by regular rotation, λz ∼ 0 represents dynamically hot orbits dominated by radial random motions or long-axis tubes with regular rotation around the long axis. Negative values λz < 0 refer to orbits that counter-rotate with respect to the net (prograde) rotation. Figure 1 presents the resulting stellar orbit distributions for the 15 compact ETGs we obtained, as probability density distributions p(r, λz) in the phase space of r versus λz for each galaxy. While HST H-band imaging constrained the surface brightness, the internal stellar orbit distribution was mainly determined by luminosity-weighted stellar kinematic data (4200−7000 Å). We approximated the luminosity-weighting to the r-band, so our dynamical model and the resulting stellar orbit distribution are r-bandluminosity-weighted.
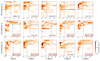 |
Fig. 1. Stellar orbit distribution of 15 compact ETGs (Yıldırım et al. 2017) obtained from the best-fitting orbit superposition model. The colour represents stellar orbit probability density in the phase space of the time-averaged radius r versus circularity λz, p(r, λz), as indicated by the colour bar. The vertical dashed lines indicate r = 2.5 kpc, while the horizontal line indicates λz = 0.5. We define the bulge, disk, and the hot inner stellar halo within rmax = 7 kpc, as illustrated in the top left panel. The seven galaxies highlighted with red squares have a significant fraction of disk and a very low fraction of hot inner stellar halo. |
2.1.3. Dynamical decomposition and quantification of the hot component
We adopted two approaches to quantify the dynamically hot component of the galaxy. The first approach decomposed each galaxy into three stellar components based on their stellar orbit distribution: a disk (λz > 0.5, rcut < r < rmax), a hot inner stellar halo (λz < 0.5, rcut < r < rmax), and a bulge (r < rcut). Here we empirically set rcut = 2.5 kpc based on Fig. 1 and the transition radius from bulge to halo in TNG50 for these compact galaxies. We chose rmax = max(7 kpc, 2 Re), since most of the 15 galaxies have data coverage extending to this radius. The definitions of bulge, disk, and hot inner stellar halo account for the unique properties of compact ETGs, and differ from those used for the general population of all TNG50 galaxies in Zhu et al. (2022a). This decomposition relies on the internal stellar orbit distribution and thus requires IFU observations associated with dynamical models for real galaxies.
To allow a direct comparison with the results of the morphological decomposition based on photometric images, we adopted a second approach of classifying all orbits with λz < 0.5 as a dynamically hot spheroid and λz > 0.5 as a cold component. These align with bulge (or spheroid) and disk components from photometric bulge-disk decomposition (Zhu et al. 2018b). We reconstructed the surface density distribution of the hot spheroid and cold components by sampling particles from the orbits. The surface brightness profiles of the two components along the major axis of the 15 galaxies are shown in Figure 2. In this sample, the galaxies with the most compact hot spheroids are associated with spatially extended cold components. The half-light radius of each hot spheroid component was calculated from its 2D surface brightness map. Masses and sizes of the hot spheroid component are listed in Table 1.
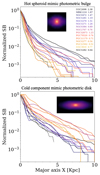 |
Fig. 2. Surface brightness profiles of the dynamically hot spheroid (defined by all orbits with λz < 0.5) and dynamically cold component (defined by all orbits with λz > 0.5) for 15 compact ETGs. Top panel: Galaxy names and half-light radius (in kpc) of their hot spheroids. The dash curve represents NGC 1282, with limited data coverage. Inset: the 2D surface brightness of the hot spheroid of one typical galaxy, NGC 1277. |
2.2. Compact ETGs in TNG50
2.2.1. Sample selection from TNG50
We used the cosmological simulation TNG50, which has a stellar mass resolution of 8.5 × 10⁴ M⊙ softening length of 0.3 kpc, and a relatively large cosmological volume of 50 Mpc. For each simulated galaxy, we calculated the total stellar mass within 30 kpc as the stellar mass M*. To measure the half-light radius mimic observations, we randomly project each galaxy onto the 2D observational plane, generated an r-band-weighted surface brightness map, and measured the half-light radius Re from the 2D map. All TNG50 galaxies with M* > 1010 M⊙ are shown in Fig. 3. We selected compact ETGs from TNG50 with M* > 2 × 10¹⁰ M⊙, Re < Rcrit, and with a specific star formation rate log(sSFR) < − 11 at z = 0. Compact galaxies were defined using  , following the methodology of Barro et al. (2013), but adopting a less strict threshold of 10.2 instead of 10.3 to expand the sample size.
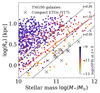 |
Fig. 3. Stellar mass M* versus size Re Compact ETGs from observations and the Illustris TNG50 simulation. The dots denote TNG50 galaxies coloured by their specific star formation rate log(sSFR) at z = 0. Grey ‘x’ symbols denote the 15 compact ETGs from observations in Yıldırım et al. (2017). Black dashed lines indicate the mass-size relations for galaxies observed at z = 0.25, z = 1.25, and z = 2.25 (van der Wel et al. 2014). Compact ETGs from TNG50 below the red line are selected with |

This allowed us to obtain a sample of 90 galaxies representative of those in different environments and with different internal structures. Many exhibit lower stellar masses and slightly larger sizes than the 15 compact ETGs in Yıldırım et al. (2017). There are various definitions of ‘compactness’ throughout the literature, each considering more or less restrictive criteria (see Table 3 of Lisiecki et al. 2023). The sample adopted here still defines the galaxy as compact, while ensuring a sufficiently large number of galaxies in TNG50 to allow meaningful comparisons with observations.
We excluded three additional galaxies with ongoing mergers or recent star formation blobs identified in their mock photometric images. To eliminate galaxies with significantly young stars, we calculated the luminosity-weighted average stellar age map across the 2D plane and imposed a minimum stellar age of > 5 Gyr in outer regions (r > 2 kpc) where disks dominate. We adopted a relatively loose cutoff of > 5 Gyr to maintain a generous sample. This selection step excluded eight galaxies, leaving 79 compact ETGs in the TNG50 sample. We classified the most massive galaxy in a halo as the central galaxy and the rest as satellite galaxies. The 79 compact ETGs are located in different environments, with 35 being central galaxies and 44 satellite galaxies.
2.2.2. Assembly history
The galaxy assembly histories in the simulations can be followed via the merger trees, as constructed by the Sublinkgal code based on the baryonic component of the subhalos (Rodriguez-Gomez et al. 2015). In this algorithm, each galaxy is assigned a unique descendant.
For each compact ETG in our sample, we derived two key parameters from the merger tree: the accreted stellar mass fraction, f∗,accreted, and the stripped stellar mass fraction, f∗,stripped. We defined the accreted fraction as the ratio of the total stellar mass of all accreted satellite galaxies to the stellar mass of the main progenitor galaxy at z = 0:
 (1)
(1)
where M∗ex1, M∗ex2, … are the mass of all the accreted satellite galaxies identified from the merger tree. We define the stripped stellar mass fraction as
 (2)
(2)
where M*, z = 0 is the galaxy’s stellar mass at z = 0 and M∗,max is the maximum stellar mass ever attained by its main progenitor.
The accreted stellar mass fraction includes the mass of all stars ever accreted into the galaxy. For galaxies without significant stripping, f∗,accreted typically equals the ex situ fraction of stars in the galaxy. A strongly stripped galaxy may have experienced massive mergers, but most accreted stars were later stripped away with the outer envelope. Here, the ex situ fraction of stars in the current galaxy might be very low, but the accreted fraction f∗,accreted defined from the merger tree will be high, reflecting past mergers.
As discussed in Moura et al. (2024), the 79 compact ETGs from TNG50 have a large variation in assembly histories: some have extremely quiescent merger histories with low f∗,accreted, others show significant mergers with relatively high f∗,accreted. All compact ETGs selected from TNG50 central galaxies are not strongly stripped, with f∗,stripped < 0.1, while a large fraction of these compact ETGs selected from satellites in cluster environments were heavily stripped, with a high f∗,stripped.
2.2.3. Dynamical decomposition of simulated galaxies
For the simulated galaxies, we used the 6D phase-space information of the stellar particles instantaneously at z = 0. We adopted an approximate method to derive time-averaged r and λz along the orbits, where averaging was carried out in phase space. In practice, we assume stellar particles with similar energy E and angular momentum Lz follow similar orbits: hence we measured the average r and λz across such particles from the simulation and adopted them as the orbital r and λz values.
We adopted this approach, for its efficiency and validation in previous studies (Zhu et al. 2022a, 2018c). The stellar orbit distribution of a typical simulated galaxy as a probability density distribution of particles in r versus λz can then be obtained, we weighted the stellar particles by the r-band luminosity, in alignment with the observations.
We then took the same approaches to characterise the hot component by first defining the bulge, disk, and hot inner stellar halo and calculating the r-band luminosity fraction of each component. Next, we defined the hot spheroid component and measured its mass and size from the projected r-band surface brightness map, following exactly the same procedure used for the observed galaxies.
3. Distinguishing ‘merger-free’ compact ETGs from stripped galaxies
After characterising the internal dynamical structures identically for observed and simulated galaxies, we attempted to identify key structural properties that trace the merger history of compact ETGs using the simulations. We constrained the merger histories of observed compact ETGs by comparing them with their simulation analogues.
3.1. The luminosity fraction of disk versus. hot inner stellar halo
In Fig. 4, we show the luminosity fraction of f∗,disk versus f∗,halo, with the three panels from left to right illustrating the compact ETGs selected from TNG50 central galaxies, compact ETGs from TNG50 satellite galaxies, and the 15 compact ETGs from observations. To guide our comparison between simulations and observations, we defined regions A, B, and C. Regions A and B have f∗,halo < 0.15 and are further separated by the line with f∗,disk = 2f∗,halo, while region C has f∗,halo > 0.15.
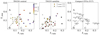 |
Fig. 4. r-band luminosity fraction of f∗,halo versus f∗,disk. Left: Compact ETGs selected from TNG50 central galaxies, colour-coded by the accreted stellar mass fraction f∗,accreted as indicated by the colour bar, none of these galaxies are strongly stripped. Middle: Compact ETGs selected from TNG50 satellite galaxies, with f∗,accreted shown with the same colour scheme. Dots and stars denote galaxies with stripped stellar mass fractions f∗,stripped < 0.1 and f∗,stripped > 0.1, respectively. We define regions A, B, and C to guide our comparison between simulations and observations. All TNG50 compact ETGs located in region A have extremely quiescent merger histories f∗,accreted < 0.1, for both central and satellite galaxies. Right: The 15 compact ETGs from observations. Compared with TNG50 analogues, the seven galaxies located in region A likely share extremely quiescent merger histories. |
For compact ETGs selected from TNG50 central galaxies, the accreted stellar mass fraction of galaxies f∗,accreted is highly correlated with the luminosity fraction of the hot inner stellar halo f∗,halo. All galaxies located in region A have extremely quiescent merger histories with f∗,accreted < 0.1, and most galaxies in region C have relatively higher accreted stellar mass fractions. There are not many galaxies in region B, and the majority of them also have low f∗,accreted.
For compact ETGs selected from the TNG50 satellites, the number of galaxies in regions A and C is significantly reduced. A significant fraction of galaxies are strongly stripped and are located in region B, where both disk and hot inner stellar halo stars are stripped. Galaxies that remain in region A have quiescent merger histories (f∗,accreted < 0.1), including those partially stripped or not stripped. Galaxies in regions B and C are a mixture of galaxies with different merger histories, with internal structures stripped or heated by the cluster environments.
In summary, compact ETGs in region A are reliably merger-free for both central and satellite galaxies. Central galaxies in region B retain a high likelihood of being merger-free, whereas those in region C are unlikely to be merger-free. Satellite galaxies in region B or C show ambiguous assembly histories. The different locations of galaxies in this figure with different merger histories are consistent with results from Moura et al. (2024).
For the 15 observed compact ETGs (Yıldırım et al. 2017), most reside in group environments (see Alamo-Martínez et al. 2021). Some could be identified as satellite galaxies, which aligns with the definition from cosmological simulations, however, they are much more massive than the satellite galaxies selected from TNG50, and there is no observational evidence for them to be strongly stripped. These 15 compact ETGs are mostly located in regions A and C, similar to the sample of central galaxies selected from TNG50. Seven of them (PGC 11179, UGC 3816, NGC 2767, NGC 1277, PGC 32873, PGC 12562, and PGC 70520) are located in region A, and therefore highly likely to be truly merger-free with a merger fraction f∗,accreted < 0.1. The remaining galaxies are likely to have experienced a relatively higher fraction of mergers that altered their internal structures.
3.2. The size of dynamically hot spheroids
To demonstrate the correlation between dynamically hot spheroid size and merger histories, we selected TNG50 galaxies with M* > 1010 M⊙, defined the dynamically hot spheroid by stars with λz < 0.5 for each galaxy, and calculated the mass M∗Sph and the half-light radius RSph of the hot spheroid component. Figure 5 shows the spheroid mass versus spheroid size for all TNG50 galaxies colour-coded by their accreted stellar mass fraction f∗,accreted. For galaxies with M∗Sph > 1010 M⊙, their accreted stellar mass fraction f∗,accreted correlates strongly with spheroid size. This correlation is much stronger than that of both the galaxy size without decomposing the disk and the spheroid mass. For all galaxies with M∗Sph > 1010 M⊙, the correlation between the accreted stellar mass fraction and the spheroid size has a high Pearson correlation coefficient of  .
.
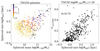 |
Fig. 5. Size of the dynamically hot spheroid as an indicator of accreted stellar mass fraction f∗,accreted. Left: Spheroid mass M∗Sph versus spheroid size RSph. TNG50 galaxies are shown as dots coloured by their accreted fraction f∗,accreted. Black ‘x’ symbols mark the 15 compact ETGs from Yıldırım et al. (2017) as listed in Table 1. Right: Spheroid size RSph versus accreted fraction f∗,accreted for TNG50 galaxies with M∗Sph > 1010 M⊙. |
We evaluated whether RSph can serve as a diagnostic of merger history for compact ETGs, replacing f∗,halo. In Fig. 6, we show the correlation between the spheroid size RSph and the luminosity fraction of the hot inner stellar halo f∗,halo, colour-coded by f∗,accreted, for compact ETGs from TNG50 central galaxies, TNG50 satellite galaxies, and observations. The spheroid size RSph is indeed highly correlated with the luminosity fraction of the hot inner stellar halo f∗,halo for allgalaxies.
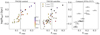 |
Fig. 6. Luminosity fraction of hot inner stellar halo f∗,halo versus the spheroid size RSph. Left: Compact ETGs selected from TNG50 central galaxies, colour-coded by accreted stellar mass fraction f∗,accreted as shown in the colour bar. Middle: Compact ETGs selected from TNG50 satellite galaxies, using the same f∗,accreted colour scheme. Right: The 15 compact ETGs from observations. The vertical dashed line indicates f∗,halo = 0.15. Spheroid size and f∗,halo are strongly correlated for both simulated and observed galaxies. The two parameters are similarly effective at tracing the f∗,accreted of central galaxies. |
For compact ETGs selected from TNG50 central galaxies, galaxies with either low fractions of hot inner stellar halo or extremely compact spheroids have quiescent merger histories (f∗,accreted < 0.1). However, for satellite galaxies, those with low f∗,halo or small RSph are still a mix of galaxies with different f∗,accreted; they could have frequent merger histories, but the outer envelopes have been stripped. Thus, we still require selection by the disk fraction (f∗,disk) to distinguish true merger-free galaxies with internal structures unaltered by mergers or cluster environments.
The seven merger-free candidates in region A (Fig. 4) – PGC 11179, UGC 3816, NGC 2767, NGC 1277, PGC 32873, PGC 12562, PGC 70520 – have extremely compact spheroids. In addition, NGC 1282 also displays a very small spheroid size, but it may have a large uncertainty due to the limited IFU data coverage for this galaxy.
4. Illustration of different formation paths of compact ETGs in TNG50
All compact ETGs selected from TNG50 are old systems with quenched star formation. The two major physical processes shaping these galaxies are accretion and mergers, as well as tidal stripping. We illustrate the formation of compact ETGs with two typical cases: a true merger-free galaxy with low accreted stellar mass fraction and no stripping (TNG50 475619) and a stripped ETG shaped by a major merger and strong tidal stripping (TNG50 184973). Their assembly history is shown in Fig. 7 and their evolution structure in Fig. 8.
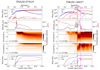 |
Fig. 7. Assembly histories of two typical compact ETGs in TNG50. Left: A merger-free galaxy TNG50 475619, the total accreted stellar mass of the satellite comprises less than 1% of its current stellar mass. From top to bottom, the first panel shows the dark matter (black dots), gas (blue dots), and stellar mass (red dots) of the main progenitor galaxy, along with the stellar mass assembly history of accreted satellites (red lines) prior to merging into the main progenitor. The second panel presents the SFR (black) and sSFR (red) as functions of cosmic time. The third panel displays the evolution of the circularity distribution for stellar particles in the main progenitor galaxy, within the radius r < 2.5 kpc, while the fourth panel shows the same for stellar particles at r > 2.5 kpc. The bottom panel illustrates the stellar mass of the disk, bulge, and hot inner stellar halo of the main progenitor galaxy. Right: Similar figures for a strongly stripped ETG, TNG50 184937, which has experienced two massive mergers: a 1:1 major merger at z ∼ 0.9 (marked by the red vertical dashed line) and a 1:10 merger at z ∼ 0.5 (marked by the magenta vertical dashed line) along with several other minor mergers. |
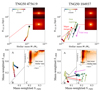 |
Fig. 8. Evolution of two typical compact ETGs. A merger-free galaxy TNG50 475619 is shown on the left and a strongly stripped ETG TNG50 184937 on the right. Top: Evolution of the main progenitor galaxy in the stellar mass versus half-mass radius, colour-coded by the redshift as indicated by the colour bar. The star marks its position at z = 0, the insert panels show the edge-on and face-on surface brightness of the galaxy at z = 0. Bottom: Evolution of the main progenitor galaxy in the mass fraction of the hot inner stellar halo f∗,halo versus disk f∗,disk. The insert panels display the stellar orbit distribution p(r, λz) of the galaxy at z = 0. In the right panels for TNG50 184937, the red arrow points to the direction of evolution by a major merger, the green arrow indicates the regrowth of a disk, and the magenta arrow indicates tidal stripping. |
As shown in the left panel of Fig. 7, TNG50 475619 is a central galaxy with a quiescent merger history. Its total accreted satellite stellar mass is about 1% of its current stellar mass. The galaxy underwent rapid star formation at z ∼ 4 − 1.5, which built most of its stellar mass. At z ∼ 1.5, its gas mass gradually decreased and star formation stopped (sSFR < 10−11M*/yr−1) at z ∼ 0.7, its total stellar mass remaining constant thereafter. The stars initially formed in dynamically cold orbits with λz > 0.5 were gradually heated to hot orbits with λz ∼ 0 by a secular process at the inner 2.5 kpc, whereas the circularity distribution of stars at the outer regions remained largely unchanged. Such secular heating of stars in the galaxy inner regions is common in TNG50 galaxies with quiescent merger histories, as detailed in Zhang et al. (2025).
Figure 8 shows a gradual growth in mass and size, with a steep increase in size since z ∼ 1.5 with the growth of the disk. The size remained unchanged after z ∼ 1, when the star formation rate became very low. Due to its quiescent merger history, TNG50 475619 maintains a very low halo fraction. Concurrently, its disk grows gradually through new star formation, causing it to move up in the f∗,halo versus f∗,disk plane prior to z ∼ 1. It then remained unchanged temporarily, before shifting slightly towards the right-lower direction due to secure heating. We divide the plane into regions A, B, and C (as defined in Section 3.1). TNG50 475619 remained in region A throughout its evolution.
In contrast, TNG50 184937 is a galaxy that experienced several massive mergers and strong tidal stripping. A ∼1 : 1 major merger at z ∼ 0.9 destroyed the previous disk and triggered a sudden increase of stars in the hot inner stellar halo. Post-merger, the gas settled down, and new stars reformed the disk. A subsequent significant merger with a mass ratio of ∼1 : 10 occurred at z ∼ 0.5. There were several peaks of star formation during the two mergers, and star formation was quickly quenched after the ∼1 : 10 merger. The galaxy then completed two pericentric passages around a cluster centre, resulting in both its disk and hot inner stellar halo being partially stripped.
TNG50 184937 exhibits a violent assembly history that drives a complicated evolution in the mass-size plane. At z ∼ 0.9, a 1:1 major merger triggered a rapid increase in both mass and size, as illustrated by the red arrow in the right panel of Fig. 8. Following this event, the galaxy undergoes disk regrowth, leading to a steady increase in mass and size for some time (green arrow). Since z ∼ 0.5, tidal stripping causes a decrease in both mass and size.
Its location in the plane of f∗,halo versus f∗,disk also changes dramatically. Initially, it resides in region B and gradually grows into region A through inside-out growth. It then jumps to region C by the major merger at z ∼ 0.9, which dramatically increases f∗,halo (red arrow). It subsequently experiences disk regrowth after the merger (green arrow), followed by tidal stripping of both the disk and hot inner stellar halo, which moves it towards region B (magenta arrow). With further stripping, it could eventually reside in region B.
Despite being located in similar regions in the mass-size plane, these two example galaxies exhibit distinct assembly histories. Both are compact ETGs, however, they are located in different regions in the plane of f∗,halo versus f∗,disk, enabling clear separation.
5. Discussion
5.1. The effects of observational data coverage
Our analysis on TNG50 galaxies suggests that a compact ETG is guaranteed to be a true merger-free galaxy if it has both a low fraction of hot inner stellar halo (equivalently, a small spheroid size) and a significant high disk fraction. Seven of the 15 compact ETGs from Yıldırım et al. (2017) meet this criterion and are thus identified as true merger-free galaxies. For the remaining galaxies, we cannot provide a decisive conclusion on their accreted stellar mass fraction f∗,accreted based solely on their internal structural components. MRK 1216, NGC 1270, NGC 1271, and NGC 1277 are often considered candidates of relic galaxies distinguished by their measured over-massive BH mass. NGC 1270 exhibits a high fraction of hot inner stellar halo f∗,halo ∼ 0.3, suggesting that its structure has been modified either by a relatively high fraction of accreted stellar mass f∗,accreted, or by other physical interaction with the environment, such as tidal forces. MRK 1216 and NGC 1271 remain consistent with low accreted stellar mass fractions, but cannot be definitively classified based on their current internal structure. NGC 1277 is among the seven guaranteed merger-free galaxies in our sample, characterised by a low fraction of hot inner stellar halo and a high fraction of disk. Thus, it satisfies an additional criterion for being considered a true relic galaxy.
The simulated galaxies have uniformly defined structures within 7 kpc, while some observed galaxies exhibit kinematic data coverage that extends to smaller radii (< 7 kpc). For NGC 1277 (Re = 1.3 kpc) and PGC 12562 (Re = 0.7 kpc), the data coverage of rmax ≃ 5 kpc corresponds to ∼4 Re and ∼7 Re for the two galaxies, respectively. Thus, more than 95% of the light should already be included. Importantly, these galaxies already appear disk-dominated within the data coverage and have a low fraction of stars in the hot inner stellar halo at 2.5 < r < rmax. We expect a slight increase of f∗,disk and no significant increase of f∗,halo if observations are extended to a larger radius. Their location in region A will not change. For NGC 1281 (Re = 1.6 kpc) with rmax ∼ 6 kpc, the observed fraction of stars in the hot inner halo (f∗,halo = 0.22 at 2.5 < r < rmax) is already relatively, and we do not expect significant change in its location in region C with greater data coverage.
For NGC 1282 (Re = 1.3 kpc), we have rmax ∼ 4 kpc, which also covers 3 Re of the galaxy, but only a smaller region (2.5 < r < rmax) allowed us to define f∗,disk and f∗,halo. The stellar orbit distribution, constrained by the current data, may introduce significant uncertainties in f∗,disk and f∗,halo. We therefore avoid making definitive conclusions about this galaxy. A summary of the merger histories of all galaxies is included in Table 1.
Basic information of the 15 massive compact ETGs.
5.2. Classic bulges formed without mergers
The seven galaxies (NGC 1277, PGC 11179, UGC 3816, NGC 2767, PGC 32873, PGC 12562, and PGC 70520) identified as merger-free galaxies host massive compact bulges. Their bulges are dynamically hot and have old stellar populations, consistent with classical bulge definitions. Simulations demonstrate that such bulges can form without major mergers, for example, via secular heating in TNG50 (Zhang et al. 2025) or in dynamically hot gas in FIRE (Yu et al. 2021). The bulges in these seven galaxies are consistent with those formed through secular heating in TNG50.
For most of these galaxies, we lack independent evidence that they are merger-free beyond the simulation predictions. However, NGC 1277 served as a prototype merger-free relic galaxy and exhibits independent evidence of a quiescent merger history from its single population of globular clusters (Beasley et al. 2018). NGC 1277 may serve as the first showcase of a galaxy with a classic bulge not formed by mergers.
5.3. Identifying relic galaxies combining stellar population and stellar kinematics
Several local Universe candidates, including NGC 1277 (Trujillo et al. 2014), Mrk 1216 and PGC 032873 (Ferré-Mateu et al. 2017), are regarded as true relic galaxies based on their compact size, old stellar population, and short star formation timescales. These galaxies are also characterised by fast rotation and high central velocity dispersions. The Degree of Relicness (DoR), defined according to their star formation histories, was introduced for massive compact galaxies in the INSPIRE project (Spiniello et al. 2024), using an expanded sample size. Galaxies with the highest DoR are those that formed nearly all of their stars by z = 2.
However, star formation history alone cannot reveal whether the structure of a galaxy has been altered by external dynamical processes, such as mergers or tidal stripping. This information is encoded in the structural properties of the galaxy. However, previous studies have primarily relied on compactness as the key structural indicator, while stellar kinematics has not played a critical role in quantifying relicness. We addressed this gap by carefully analysing the internal dynamical structures of compact massive ETGs and comparing them between observations and simulations.
We find that a galaxy can be confidently identified as merger-free if it exhibits a low fraction of the hot inner stellar halo (or equivalently, an extremely compact spheroid) while retaining a dynamically cold disk. This finding is consistent with previous studies of compact ETGs from simulations (Moura et al. 2024; Flores-Freitas et al. 2022), and aligns with observations of galaxies at high redshifts. The majority of massive galaxies observed at z ∼ 2 are disk-dominated (van der Wel et al. 2011; Kartaltepe et al. 2023) and likely fast-rotating (D’Eugenio et al. 2024). Massive galaxies at higher redshifts typically exhibit stronger rotation compared to massive galaxies at z = 0 (Bezanson et al. 2018; Zhang et al. 2025).
The combination of stellar population and stellar kinematic structures provides a comprehensive approach to understanding the relicness of compact massive ETGs. For the three well-studied relic candidates-NGC 1277 (Trujillo et al. 2014), Mrk 1216, and PGC 032873 (Ferré-Mateu et al. 2017) we confirm from the kinematics viewpoint that NGC 1277 and PGC 032873 are true merger-free relic galaxies with extremely quiescent merger histories (ex situ stellar mass fraction < 5%). The internal structure of Mrk 1216 may have been moderately altered by subsequent mergers, as indicated by an ex situ stellar mass fraction of ∼10%−20% derived from its dynamical structures. Nevertheless, it could still be defined as a relic galaxy if a less strict criterion on ex situ fractions for relics is adopted (Quilis & Trujillo 2013).
6. Conclusion
We studied the internal dynamical structures of 15 compact ETGs from observations and a comparable sample of 79 compact ETGs from TNG50. For the observed galaxies, we obtained the stellar orbit distribution by creating orbit-superposition models. These models are designed to fit the surface brightness and intrinsic luminosity density deprojected from the 2D image, as well as the kinematic maps from IFU observations. For the simulated galaxies, we obtained the stellar orbit distribution directly from the 6D phase-space information of the stellar particles. Based on the stellar orbit distribution, we dynamically decomposed each galaxy into a disk, bulge, and hot inner stellar halo. We characterised their internal structures by the luminosity fraction of each component. Additionally, we dynamically defined a hot spheroidal component and calculated its mass and half-light radius, which aligns qualitatively with photometrically decomposed bulges and spheroids.
For the compact ETGs selected from the central galaxies of TNG50, we find that the luminosity fraction of the hot inner stellar halo (alternatively, the size of the hot spheroid) stronglycorrelates with the galaxies’ accreted stellar mass fraction. Merger-free galaxies (faccreted < 0.1) exhibit extremely low hot inner stellar halo fractions (f∗,halo < 0.15), or equivalently very compact hot spheroids (RSph < 1 kpc). However, for satellite galaxies, heavy tidal stripping could also account for these features. Tidal stripping will also destroy the dynamically cold disk (if one exists) when removing the outer spheroid component. Thus, a galaxy can be conclusively identified as merger-free if it exhibits a very low fraction of hot inner stellar halo (f∗,halo < 0.15) and persistent cold disk (f∗,disk > 2f∗,halos), criteria applicable for both central and satellite galaxies.
Compared directly with the dynamical structures of the compact ETGs of TNG50, we suggest that seven of the observed 15 compact ETGs (Yıldırım et al. 2017), namely PGC 11179, UGC 3816, NGC 2767, NGC 1277, PGC 32873, PGC 12562, and PGC 70520, are true merger-free galaxies. The internal structures of UGC 2698 and NGC 1270 are highly likely to have been altered by subsequent mergers or tidal forces. The remaining galaxies (MRK 1216, NGC 0384, NGC 0472, NGC 1271, NGC 1281, and NGC 1282) exhibit relatively low merger frequencies, but are unlikely to be pristine merger-free systems.
We quantified galaxy merger histories through their internal orbital structures, providing a robust method to identify merger-free galaxies with extremely quiescent merger histories. Combining stellar population analysis with our analysis on internal dynamical structures will improve the identification of true relic galaxies and enhance understanding of compact ETG diversity in many aspects, such as black hole mass, stellar populations, X-ray emission, DM distribution, and GC populations.
Acknowledgments
We thank Akın Yıldırım for providing us with the data of the 15 compact ETGs from observations, and we thank Annalisa Pillepich, Marie Martig, and Hans-Walter Rix for useful discussions. The research presented here is partially supported by the National Key R&D Program of China No. 2022YFF0503403, the CAS Project for Young Scientists in Basic Research under grant No. YSBR-062, and CAS PIFI project. ACS acknowledges funding from CNPq and the Rio Grande do Sul Research Foundation (FAPERGS) through grants CNPq-11153/2018-6, PqG/FAPERGS-24/2551-0001548-5, FAPERGS/CAPES 19/2551-0000696-9. MTM acknowledges the Brazilian agency Conselho Nacional de Desenvolvimento Científico e Tecnológico (CNPq) through grant 140900/2021-7.
References
- Alamo-Martínez, K. A., Chies-Santos, A. L., Beasley, M. A., et al. 2021, MNRAS, 503, 2406 [CrossRef] [Google Scholar]
- Barber, C., Schaye, J., Bower, R. G., et al. 2016, MNRAS, 460, 1147 [NASA ADS] [CrossRef] [Google Scholar]
- Barro, G., Faber, S. M., Pérez-González, P. G., et al. 2013, ApJ, 765, 104 [Google Scholar]
- Beasley, M. A., Trujillo, I., Leaman, R., & Montes, M. 2018, Nature, 555, 483 [NASA ADS] [CrossRef] [Google Scholar]
- Bezanson, R., van der Wel, A., Pacifici, C., et al. 2018, ApJ, 858, 60 [NASA ADS] [CrossRef] [Google Scholar]
- Cappellari, M. 2002, MNRAS, 333, 400 [NASA ADS] [CrossRef] [Google Scholar]
- Cappellari, M. 2017, MNRAS, 466, 798 [Google Scholar]
- Cohn, J. H., Walsh, J. L., Boizelle, B. D., et al. 2021, ApJ, 919, 77 [Google Scholar]
- Comerón, S., Trujillo, I., Cappellari, M., et al. 2023, A&A, 675, A143 [NASA ADS] [CrossRef] [EDP Sciences] [Google Scholar]
- Daddi, E., Renzini, A., Pirzkal, N., et al. 2005, ApJ, 626, 680 [NASA ADS] [CrossRef] [Google Scholar]
- Damjanov, I., McCarthy, P. J., Abraham, R. G., et al. 2009, ApJ, 695, 101 [Google Scholar]
- de Graaff, A., Trayford, J., Franx, M., et al. 2022, MNRAS, 511, 2544 [NASA ADS] [CrossRef] [Google Scholar]
- Deeley, S., Drinkwater, M., Sweet, S., et al. 2023, MNRAS, 525, 1192 [NASA ADS] [CrossRef] [Google Scholar]
- D’Eugenio, F., van der Wel, A., Piotrowska, J. M., et al. 2023, MNRAS, 525, 2789 [CrossRef] [Google Scholar]
- D’Eugenio, F., Pérez-González, P. G., Maiolino, R., et al. 2024, Nat. Astron., 8, 1443 [CrossRef] [Google Scholar]
- Ding, Y., Zhu, L., van de Ven, G., et al. 2023, A&A, 672, A84 [NASA ADS] [CrossRef] [EDP Sciences] [Google Scholar]
- Du, M., Ho, L. C., Debattista, V. P., et al. 2021, ApJ, 919, 135 [NASA ADS] [CrossRef] [Google Scholar]
- Fabian, A. C., Sanders, J. S., Haehnelt, M., Rees, M. J., & Miller, J. M. 2013, MNRAS, 431, L38 [Google Scholar]
- Ferré-Mateu, A., Mezcua, M., Trujillo, I., Balcells, M., & van den Bosch, R. C. E. 2015, ApJ, 808, 79 [CrossRef] [Google Scholar]
- Ferré-Mateu, A., Trujillo, I., Martín-Navarro, I., et al. 2017, MNRAS, 467, 1929 [NASA ADS] [Google Scholar]
- Flores-Freitas, R., Chies-Santos, A. L., Furlanetto, C., et al. 2022, MNRAS, 512, 245 [NASA ADS] [CrossRef] [Google Scholar]
- Genel, S., Nelson, D., Pillepich, A., et al. 2018, MNRAS, 474, 3976 [Google Scholar]
- Graham, A. W., Dullo, B. T., & Savorgnan, G. A. D. 2015, ApJ, 804, 32 [NASA ADS] [CrossRef] [Google Scholar]
- Grèbol-Tomàs, P., Ferré-Mateu, A., & Domínguez-Sánchez, H. 2023, MNRAS, 526, 4024 [CrossRef] [Google Scholar]
- Hon, D. S. H., Graham, A. W., Davis, B. L., & Marconi, A. 2022, MNRAS, 514, 3410 [NASA ADS] [CrossRef] [Google Scholar]
- Jin, Y., Zhu, L., Zibetti, S., et al. 2024, A&A, 681, A95 [NASA ADS] [CrossRef] [EDP Sciences] [Google Scholar]
- Kang, J., & Lee, M. G. 2021, ApJ, 914, 20 [Google Scholar]
- Kartaltepe, J. S., Rose, C., Vanderhoof, B. N., et al. 2023, ApJ, 946, L15 [NASA ADS] [CrossRef] [Google Scholar]
- Kelz, A., Verheijen, M. A. W., Roth, M. M., et al. 2006, PASP, 118, 129 [Google Scholar]
- Lange, R., Moffett, A. J., Driver, S. P., et al. 2016, MNRAS, 462, 1470 [NASA ADS] [CrossRef] [Google Scholar]
- Lisiecki, K., Małek, K., Siudek, M., et al. 2023, A&A, 669, A95 [NASA ADS] [CrossRef] [EDP Sciences] [Google Scholar]
- Maksymowicz-Maciata, M., Spiniello, C., Martín-Navarro, I., et al. 2024, MNRAS, 531, 2864 [Google Scholar]
- Martín-Navarro, I., La Barbera, F., Vazdekis, A., et al. 2015, MNRAS, 451, 1081 [CrossRef] [Google Scholar]
- Martín-Navarro, I., van de Ven, G., & Yıldırım, A. 2019, MNRAS, 487, 4939 [CrossRef] [Google Scholar]
- Moura, M. T., Chies-Santos, A. L., Furlanetto, C., Zhu, L., & Canossa-Gosteinski, M. A. 2024, MNRAS, 528, 353 [NASA ADS] [CrossRef] [Google Scholar]
- Naab, T., Johansson, P. H., & Ostriker, J. P. 2009, ApJ, 699, L178 [Google Scholar]
- Navarro, J. F., Frenk, C. S., & White, S. D. M. 1997, ApJ, 490, 493 [Google Scholar]
- Nelson, D., Springel, V., Pillepich, A., et al. 2019, Comput. Astrophys. Cosmol., 6, 2 [Google Scholar]
- Oser, L., Ostriker, J. P., Naab, T., Johansson, P. H., & Burkert, A. 2010, ApJ, 725, 2312 [Google Scholar]
- Pillepich, A., Nelson, D., Springel, V., et al. 2019, MNRAS, 490, 3196 [Google Scholar]
- Quilis, V., & Trujillo, I. 2013, ApJ, 773, L8 [NASA ADS] [CrossRef] [Google Scholar]
- Rodriguez-Gomez, V., Genel, S., Vogelsberger, M., et al. 2015, MNRAS, 449, 49 [Google Scholar]
- Rodriguez-Gomez, V., Snyder, G. F., Lotz, J. M., et al. 2019, MNRAS, 483, 4140 [NASA ADS] [CrossRef] [Google Scholar]
- Schnorr-Müller, A., Trevisan, M., Riffel, R., et al. 2021, MNRAS, 507, 300 [CrossRef] [Google Scholar]
- Spiniello, C., D’Ago, G., Coccato, L., et al. 2024, MNRAS, 527, 8793 [Google Scholar]
- Tahmasebzadeh, B., Zhu, L., Shen, J., Gerhard, O., & van de Ven, G. 2022, ApJ, 941, 109 [NASA ADS] [CrossRef] [Google Scholar]
- Tahmasebzadeh, B., Zhu, L., Shen, J., et al. 2024, MNRAS, 534, 861 [NASA ADS] [CrossRef] [Google Scholar]
- Tortora, C., Napolitano, N. R., Radovich, M., et al. 2020, A&A, 638, L11 [NASA ADS] [CrossRef] [EDP Sciences] [Google Scholar]
- Trujillo, I., Cenarro, A. J., de Lorenzo-Cáceres, A., et al. 2009, ApJ, 692, L118 [NASA ADS] [CrossRef] [Google Scholar]
- Trujillo, I., Ferré-Mateu, A., Balcells, M., Vazdekis, A., & Sánchez-Blázquez, P. 2014, ApJ, 780, L20 [Google Scholar]
- Valentino, F., Tanaka, M., Davidzon, I., et al. 2020, ApJ, 889, 93 [Google Scholar]
- van den Bosch, R. C. E., van de Ven, G., Verolme, E. K., Cappellari, M., & de Zeeuw, P. T. 2008, MNRAS, 385, 647 [Google Scholar]
- van den Bosch, R. C. E., Gebhardt, K., Gültekin, K., et al. 2012, Nature, 491, 729 [NASA ADS] [CrossRef] [Google Scholar]
- van der Wel, A., Rix, H.-W., Wuyts, S., et al. 2011, ApJ, 730, 38 [NASA ADS] [CrossRef] [Google Scholar]
- van der Wel, A., Franx, M., van Dokkum, P. G., et al. 2014, ApJ, 788, 28 [Google Scholar]
- van Son, L. A. C., Barber, C., Bahé, Y. M., et al. 2019, MNRAS, 485, 396 [Google Scholar]
- Verheijen, M. A. W., Bershady, M. A., Andersen, D. R., et al. 2004, Astron. Nachr., 325, 151 [Google Scholar]
- Walsh, J. L., van den Bosch, R. C. E., Gebhardt, K., et al. 2015, ApJ, 808, 183 [Google Scholar]
- Walsh, J. L., van den Bosch, R. C. E., Gebhardt, K., et al. 2016, ApJ, 817, 2 [NASA ADS] [CrossRef] [Google Scholar]
- Walsh, J. L., van den Bosch, R. C. E., Gebhardt, K., et al. 2017, ApJ, 835, 208 [Google Scholar]
- Xu, D., Zhu, L., Grand, R., et al. 2019, MNRAS, 489, 842 [NASA ADS] [CrossRef] [Google Scholar]
- Yıldırım, A., van den Bosch, R. C. E., van de Ven, G., et al. 2017, MNRAS, 468, 4216 [Google Scholar]
- Yu, S., Bullock, J. S., Klein, C., et al. 2021, MNRAS, 505, 889 [NASA ADS] [CrossRef] [Google Scholar]
- Zanisi, L., Huertas-Company, M., Lanusse, F., et al. 2021, MNRAS, 501, 4359 [NASA ADS] [CrossRef] [Google Scholar]
- Zhang, L., Zhu, L., Pillepich, A., et al. 2025, A&A, in press, https://doi.org/10.1051/0004-6361/202451292 [Google Scholar]
- Zhu, L., van den Bosch, R., van de Ven, G., et al. 2018a, MNRAS, 473, 3000 [Google Scholar]
- Zhu, L., van de Ven, G., Méndez-Abreu, J., & Obreja, A. 2018b, MNRAS, 479, 945 [Google Scholar]
- Zhu, L., van de Ven, G., van den Bosch, R., et al. 2018c, Nat. Astron., 2, 233 [Google Scholar]
- Zhu, L., van de Ven, G., Leaman, R., et al. 2020, MNRAS, 496, 1579 [Google Scholar]
- Zhu, L., Pillepich, A., van de Ven, G., et al. 2022a, A&A, 660, A20 [NASA ADS] [CrossRef] [EDP Sciences] [Google Scholar]
- Zhu, L., van de Ven, G., Leaman, R., et al. 2022b, A&A, 664, A115 [NASA ADS] [CrossRef] [EDP Sciences] [Google Scholar]
All Tables
All Figures
|
Fig. 1. Stellar orbit distribution of 15 compact ETGs (Yıldırım et al. 2017) obtained from the best-fitting orbit superposition model. The colour represents stellar orbit probability density in the phase space of the time-averaged radius r versus circularity λz, p(r, λz), as indicated by the colour bar. The vertical dashed lines indicate r = 2.5 kpc, while the horizontal line indicates λz = 0.5. We define the bulge, disk, and the hot inner stellar halo within rmax = 7 kpc, as illustrated in the top left panel. The seven galaxies highlighted with red squares have a significant fraction of disk and a very low fraction of hot inner stellar halo. |
| In the text | |
|
Fig. 2. Surface brightness profiles of the dynamically hot spheroid (defined by all orbits with λz < 0.5) and dynamically cold component (defined by all orbits with λz > 0.5) for 15 compact ETGs. Top panel: Galaxy names and half-light radius (in kpc) of their hot spheroids. The dash curve represents NGC 1282, with limited data coverage. Inset: the 2D surface brightness of the hot spheroid of one typical galaxy, NGC 1277. |
| In the text | |
|
Fig. 3. Stellar mass M* versus size Re Compact ETGs from observations and the Illustris TNG50 simulation. The dots denote TNG50 galaxies coloured by their specific star formation rate log(sSFR) at z = 0. Grey ‘x’ symbols denote the 15 compact ETGs from observations in Yıldırım et al. (2017). Black dashed lines indicate the mass-size relations for galaxies observed at z = 0.25, z = 1.25, and z = 2.25 (van der Wel et al. 2014). Compact ETGs from TNG50 below the red line are selected with |
| In the text | |
|
Fig. 4. r-band luminosity fraction of f∗,halo versus f∗,disk. Left: Compact ETGs selected from TNG50 central galaxies, colour-coded by the accreted stellar mass fraction f∗,accreted as indicated by the colour bar, none of these galaxies are strongly stripped. Middle: Compact ETGs selected from TNG50 satellite galaxies, with f∗,accreted shown with the same colour scheme. Dots and stars denote galaxies with stripped stellar mass fractions f∗,stripped < 0.1 and f∗,stripped > 0.1, respectively. We define regions A, B, and C to guide our comparison between simulations and observations. All TNG50 compact ETGs located in region A have extremely quiescent merger histories f∗,accreted < 0.1, for both central and satellite galaxies. Right: The 15 compact ETGs from observations. Compared with TNG50 analogues, the seven galaxies located in region A likely share extremely quiescent merger histories. |
| In the text | |
|
Fig. 5. Size of the dynamically hot spheroid as an indicator of accreted stellar mass fraction f∗,accreted. Left: Spheroid mass M∗Sph versus spheroid size RSph. TNG50 galaxies are shown as dots coloured by their accreted fraction f∗,accreted. Black ‘x’ symbols mark the 15 compact ETGs from Yıldırım et al. (2017) as listed in Table 1. Right: Spheroid size RSph versus accreted fraction f∗,accreted for TNG50 galaxies with M∗Sph > 1010 M⊙. |
| In the text | |
|
Fig. 6. Luminosity fraction of hot inner stellar halo f∗,halo versus the spheroid size RSph. Left: Compact ETGs selected from TNG50 central galaxies, colour-coded by accreted stellar mass fraction f∗,accreted as shown in the colour bar. Middle: Compact ETGs selected from TNG50 satellite galaxies, using the same f∗,accreted colour scheme. Right: The 15 compact ETGs from observations. The vertical dashed line indicates f∗,halo = 0.15. Spheroid size and f∗,halo are strongly correlated for both simulated and observed galaxies. The two parameters are similarly effective at tracing the f∗,accreted of central galaxies. |
| In the text | |
|
Fig. 7. Assembly histories of two typical compact ETGs in TNG50. Left: A merger-free galaxy TNG50 475619, the total accreted stellar mass of the satellite comprises less than 1% of its current stellar mass. From top to bottom, the first panel shows the dark matter (black dots), gas (blue dots), and stellar mass (red dots) of the main progenitor galaxy, along with the stellar mass assembly history of accreted satellites (red lines) prior to merging into the main progenitor. The second panel presents the SFR (black) and sSFR (red) as functions of cosmic time. The third panel displays the evolution of the circularity distribution for stellar particles in the main progenitor galaxy, within the radius r < 2.5 kpc, while the fourth panel shows the same for stellar particles at r > 2.5 kpc. The bottom panel illustrates the stellar mass of the disk, bulge, and hot inner stellar halo of the main progenitor galaxy. Right: Similar figures for a strongly stripped ETG, TNG50 184937, which has experienced two massive mergers: a 1:1 major merger at z ∼ 0.9 (marked by the red vertical dashed line) and a 1:10 merger at z ∼ 0.5 (marked by the magenta vertical dashed line) along with several other minor mergers. |
| In the text | |
|
Fig. 8. Evolution of two typical compact ETGs. A merger-free galaxy TNG50 475619 is shown on the left and a strongly stripped ETG TNG50 184937 on the right. Top: Evolution of the main progenitor galaxy in the stellar mass versus half-mass radius, colour-coded by the redshift as indicated by the colour bar. The star marks its position at z = 0, the insert panels show the edge-on and face-on surface brightness of the galaxy at z = 0. Bottom: Evolution of the main progenitor galaxy in the mass fraction of the hot inner stellar halo f∗,halo versus disk f∗,disk. The insert panels display the stellar orbit distribution p(r, λz) of the galaxy at z = 0. In the right panels for TNG50 184937, the red arrow points to the direction of evolution by a major merger, the green arrow indicates the regrowth of a disk, and the magenta arrow indicates tidal stripping. |
| In the text | |
Current usage metrics show cumulative count of Article Views (full-text article views including HTML views, PDF and ePub downloads, according to the available data) and Abstracts Views on Vision4Press platform.
Data correspond to usage on the plateform after 2015. The current usage metrics is available 48-96 hours after online publication and is updated daily on week days.
Initial download of the metrics may take a while.