Fig. 3.
Download original image
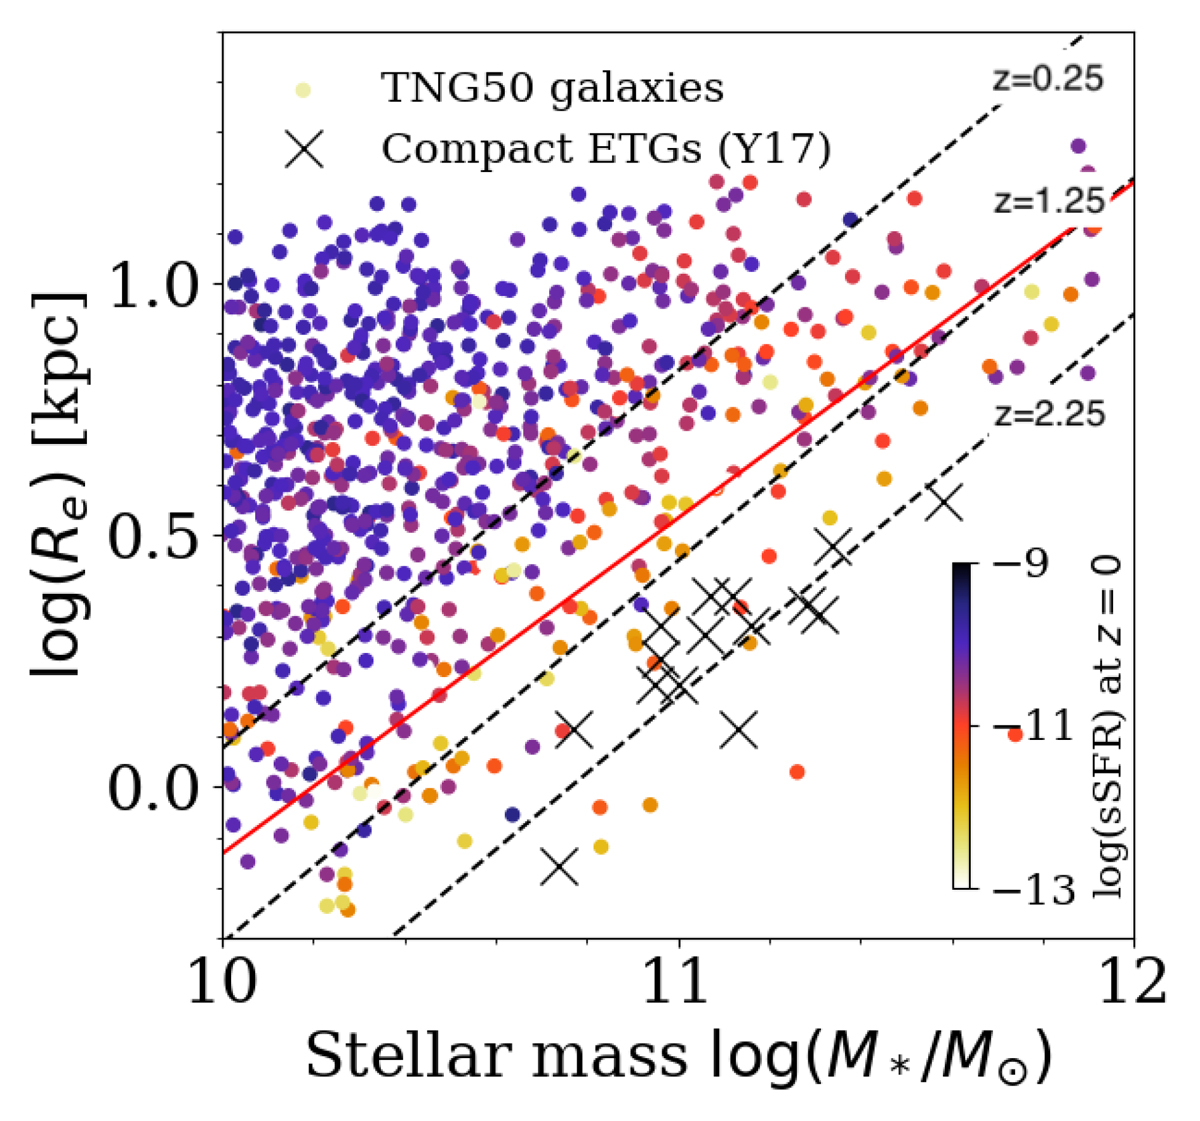
Stellar mass M* versus size Re Compact ETGs from observations and the Illustris TNG50 simulation. The dots denote TNG50 galaxies coloured by their specific star formation rate log(sSFR) at z = 0. Grey ‘x’ symbols denote the 15 compact ETGs from observations in Yıldırım et al. (2017). Black dashed lines indicate the mass-size relations for galaxies observed at z = 0.25, z = 1.25, and z = 2.25 (van der Wel et al. 2014). Compact ETGs from TNG50 below the red line are selected with ![]() (Barro et al. 2013) and with log(sSFR) < − 11.
(Barro et al. 2013) and with log(sSFR) < − 11.
Current usage metrics show cumulative count of Article Views (full-text article views including HTML views, PDF and ePub downloads, according to the available data) and Abstracts Views on Vision4Press platform.
Data correspond to usage on the plateform after 2015. The current usage metrics is available 48-96 hours after online publication and is updated daily on week days.
Initial download of the metrics may take a while.