Fig. 1.
Download original image
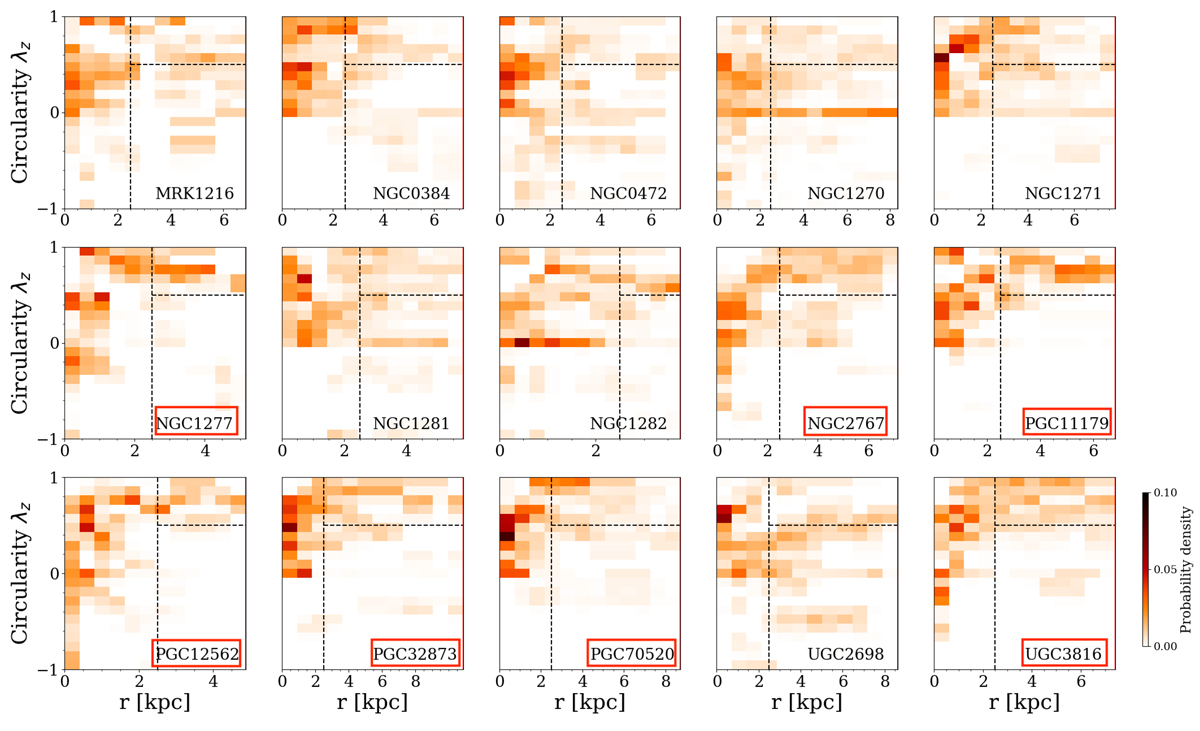
Stellar orbit distribution of 15 compact ETGs (Yıldırım et al. 2017) obtained from the best-fitting orbit superposition model. The colour represents stellar orbit probability density in the phase space of the time-averaged radius r versus circularity λz, p(r, λz), as indicated by the colour bar. The vertical dashed lines indicate r = 2.5 kpc, while the horizontal line indicates λz = 0.5. We define the bulge, disk, and the hot inner stellar halo within rmax = 7 kpc, as illustrated in the top left panel. The seven galaxies highlighted with red squares have a significant fraction of disk and a very low fraction of hot inner stellar halo.
Current usage metrics show cumulative count of Article Views (full-text article views including HTML views, PDF and ePub downloads, according to the available data) and Abstracts Views on Vision4Press platform.
Data correspond to usage on the plateform after 2015. The current usage metrics is available 48-96 hours after online publication and is updated daily on week days.
Initial download of the metrics may take a while.