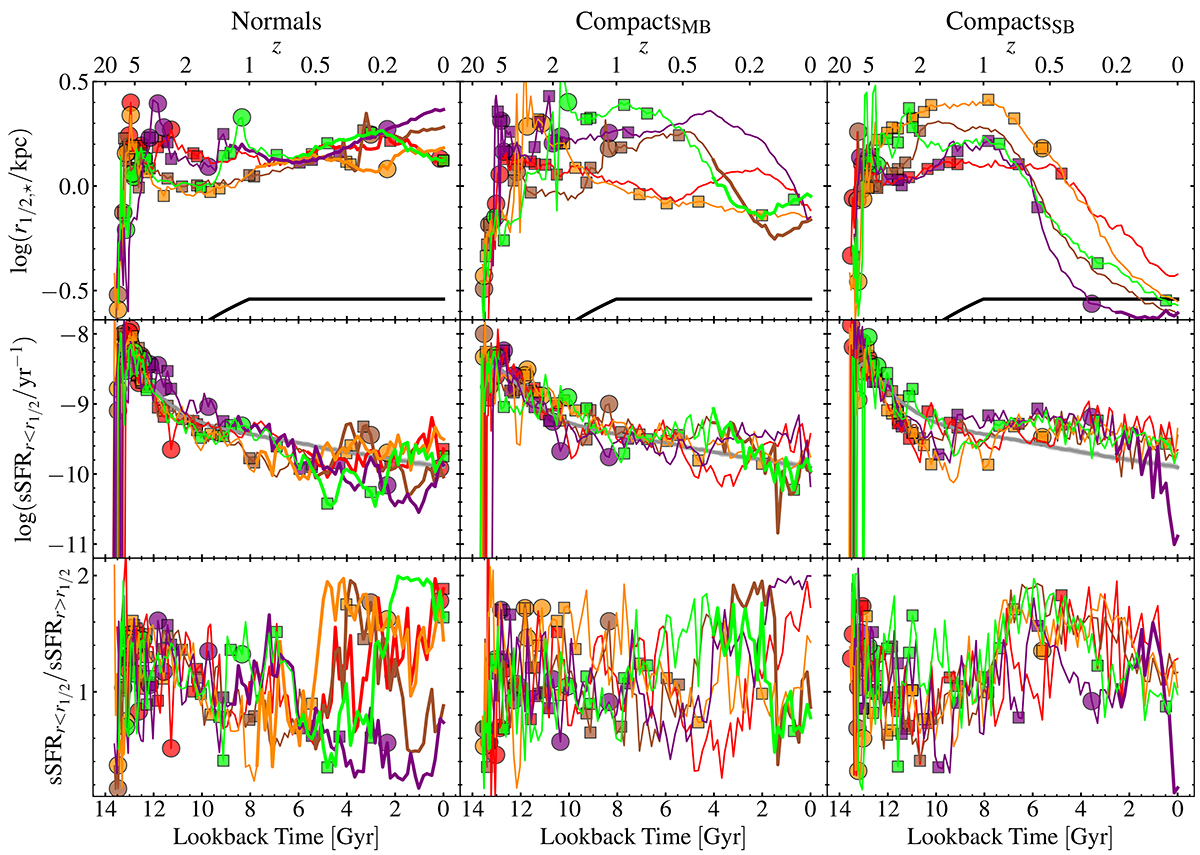
Fig. 9.
Download original image
Individual histories of the half-mass radius (top), inner sSFR (second row), and the ratio between the sSFRs in the inner and outer regions (bottom) for five randomly selected Normals (left), CompactsMB (center), and CompactsSB (right). Each line corresponds to the evolution of a single galaxy. The symbols indicate major mergers (large circles, with stellar mass ratio > 1/4) or intermediate mergers (intermediate-size squares, with stellar mass ratio between 1/10 and 1/4). The minor mergers are not shown for clarity. Thicker lines indicate when the galaxy hosts a central BH. The thick black lines show the evolution of the softening radius, while the gray shaded regions show the ±1σ region for the sSFR median evolution of all galaxies in the stellar mass range: 8.4 < log(M⋆/M⊙) < 9.2.
Current usage metrics show cumulative count of Article Views (full-text article views including HTML views, PDF and ePub downloads, according to the available data) and Abstracts Views on Vision4Press platform.
Data correspond to usage on the plateform after 2015. The current usage metrics is available 48-96 hours after online publication and is updated daily on week days.
Initial download of the metrics may take a while.