Open Access
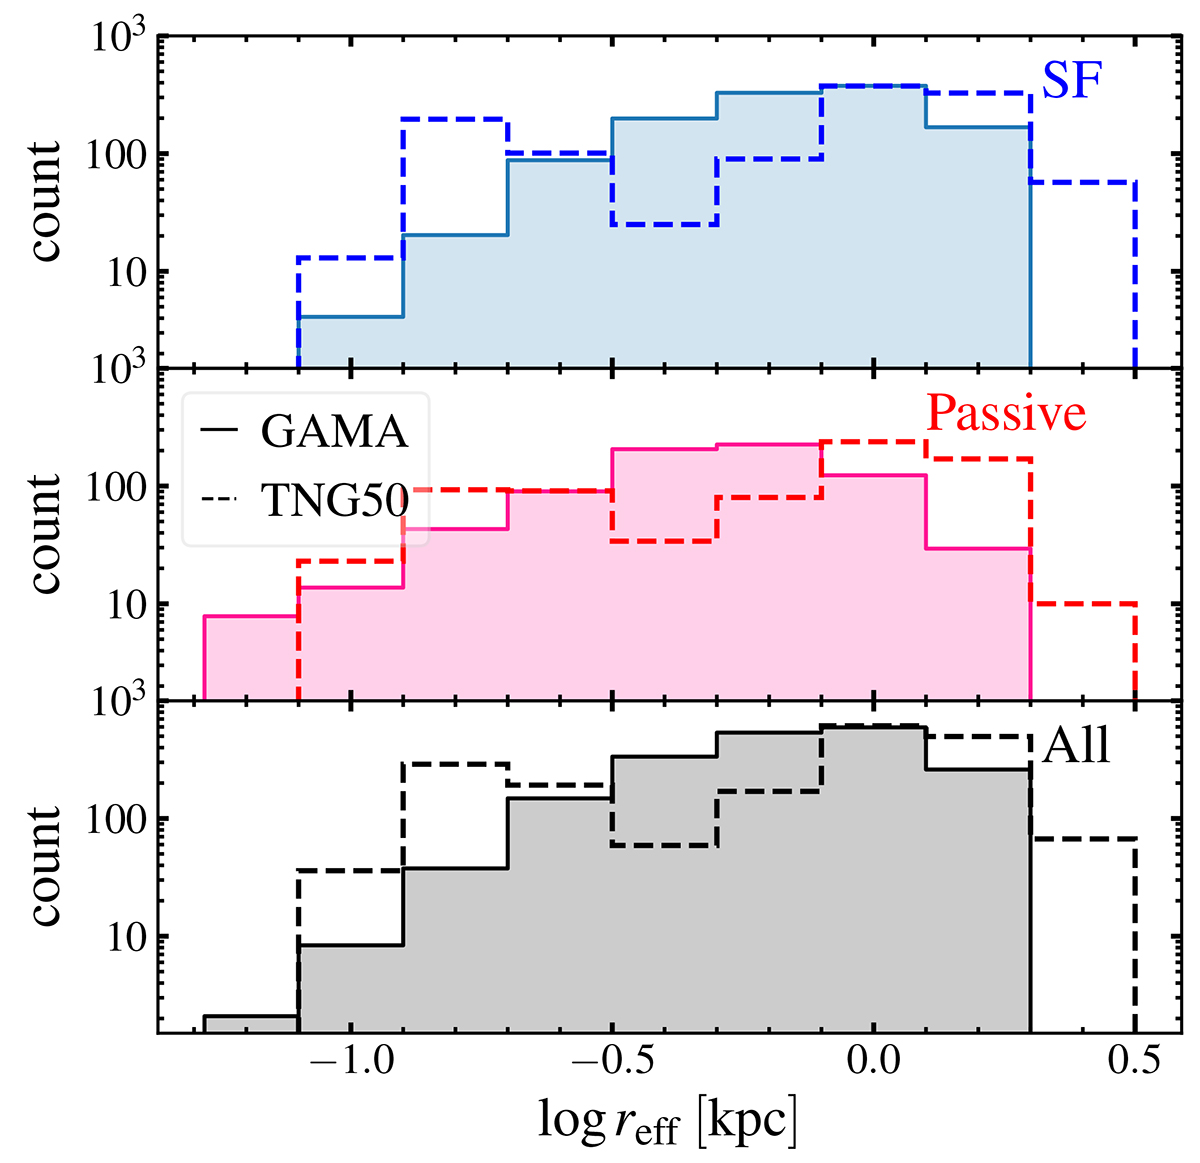
Fig. 15.
Download original image
Normalized size distributions for GAMA and TNG50 galaxies, split between star forming (blue, top) and passive (red, center). The bottom panel shows the distribution for all galaxies. Each GAMA galaxy was weighted in inverse proportion to the volume up to which it can be seen.
Current usage metrics show cumulative count of Article Views (full-text article views including HTML views, PDF and ePub downloads, according to the available data) and Abstracts Views on Vision4Press platform.
Data correspond to usage on the plateform after 2015. The current usage metrics is available 48-96 hours after online publication and is updated daily on week days.
Initial download of the metrics may take a while.