Fig. 8.
Download original image
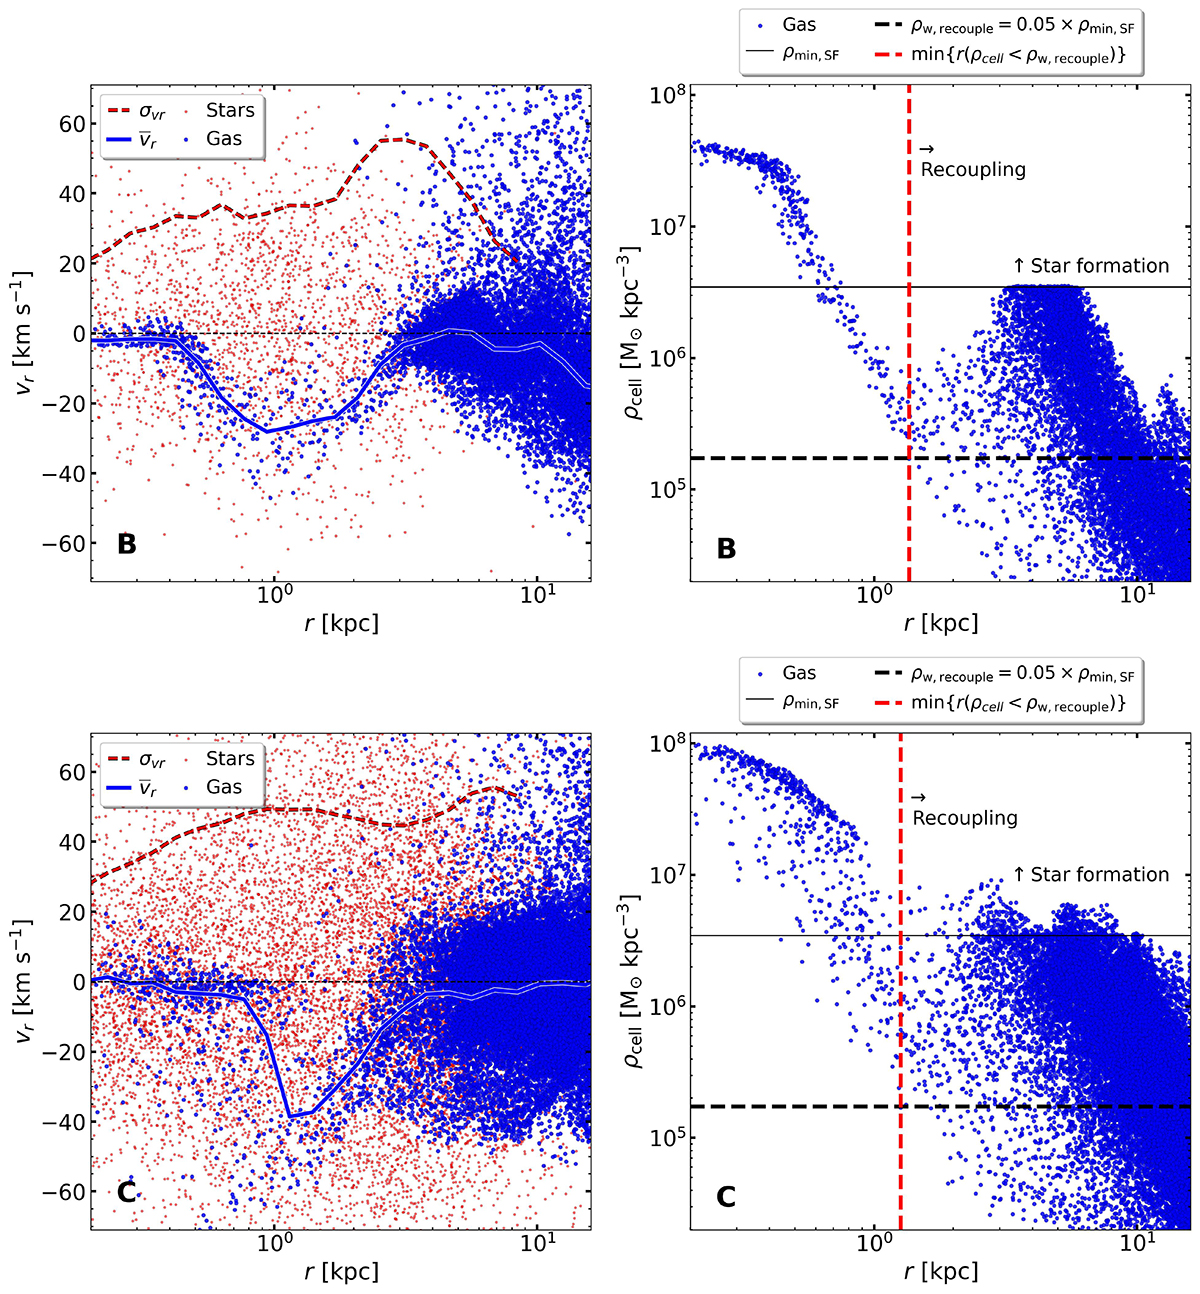
Left panels: Radial velocity of stars (red) and gas (blue) for galaxies B and C at redshift z = 0, which were chosen as illustrative examples. The solid blue curve indicates the median radial velocity of gas cells at a given radius; the dashed red curve indicates the radial velocity dispersion of star particles. Right panels: Gas cell density versus galactocentric distance. The solid black horizontal line shows the density threshold for star formation (ρmin, SF ≈ 3.5 × 10⁶ M⊙ kpc−3). The dashed horizontal line indicates the minimum wind-recoupling density, defined as ρw, recouple = 0.05 × ρmin, SF. The minimum radius where recoupling may occur (i.e. where a gas cell falls below ρw, recouple) is indicated with a dashed red vertical line. Note that the quiescent zone between the inner clump and the outer disc roughly coincides with the ‘recoupling radius’, indicating that the star formation gap is caused by feedback winds.
Current usage metrics show cumulative count of Article Views (full-text article views including HTML views, PDF and ePub downloads, according to the available data) and Abstracts Views on Vision4Press platform.
Data correspond to usage on the plateform after 2015. The current usage metrics is available 48-96 hours after online publication and is updated daily on week days.
Initial download of the metrics may take a while.