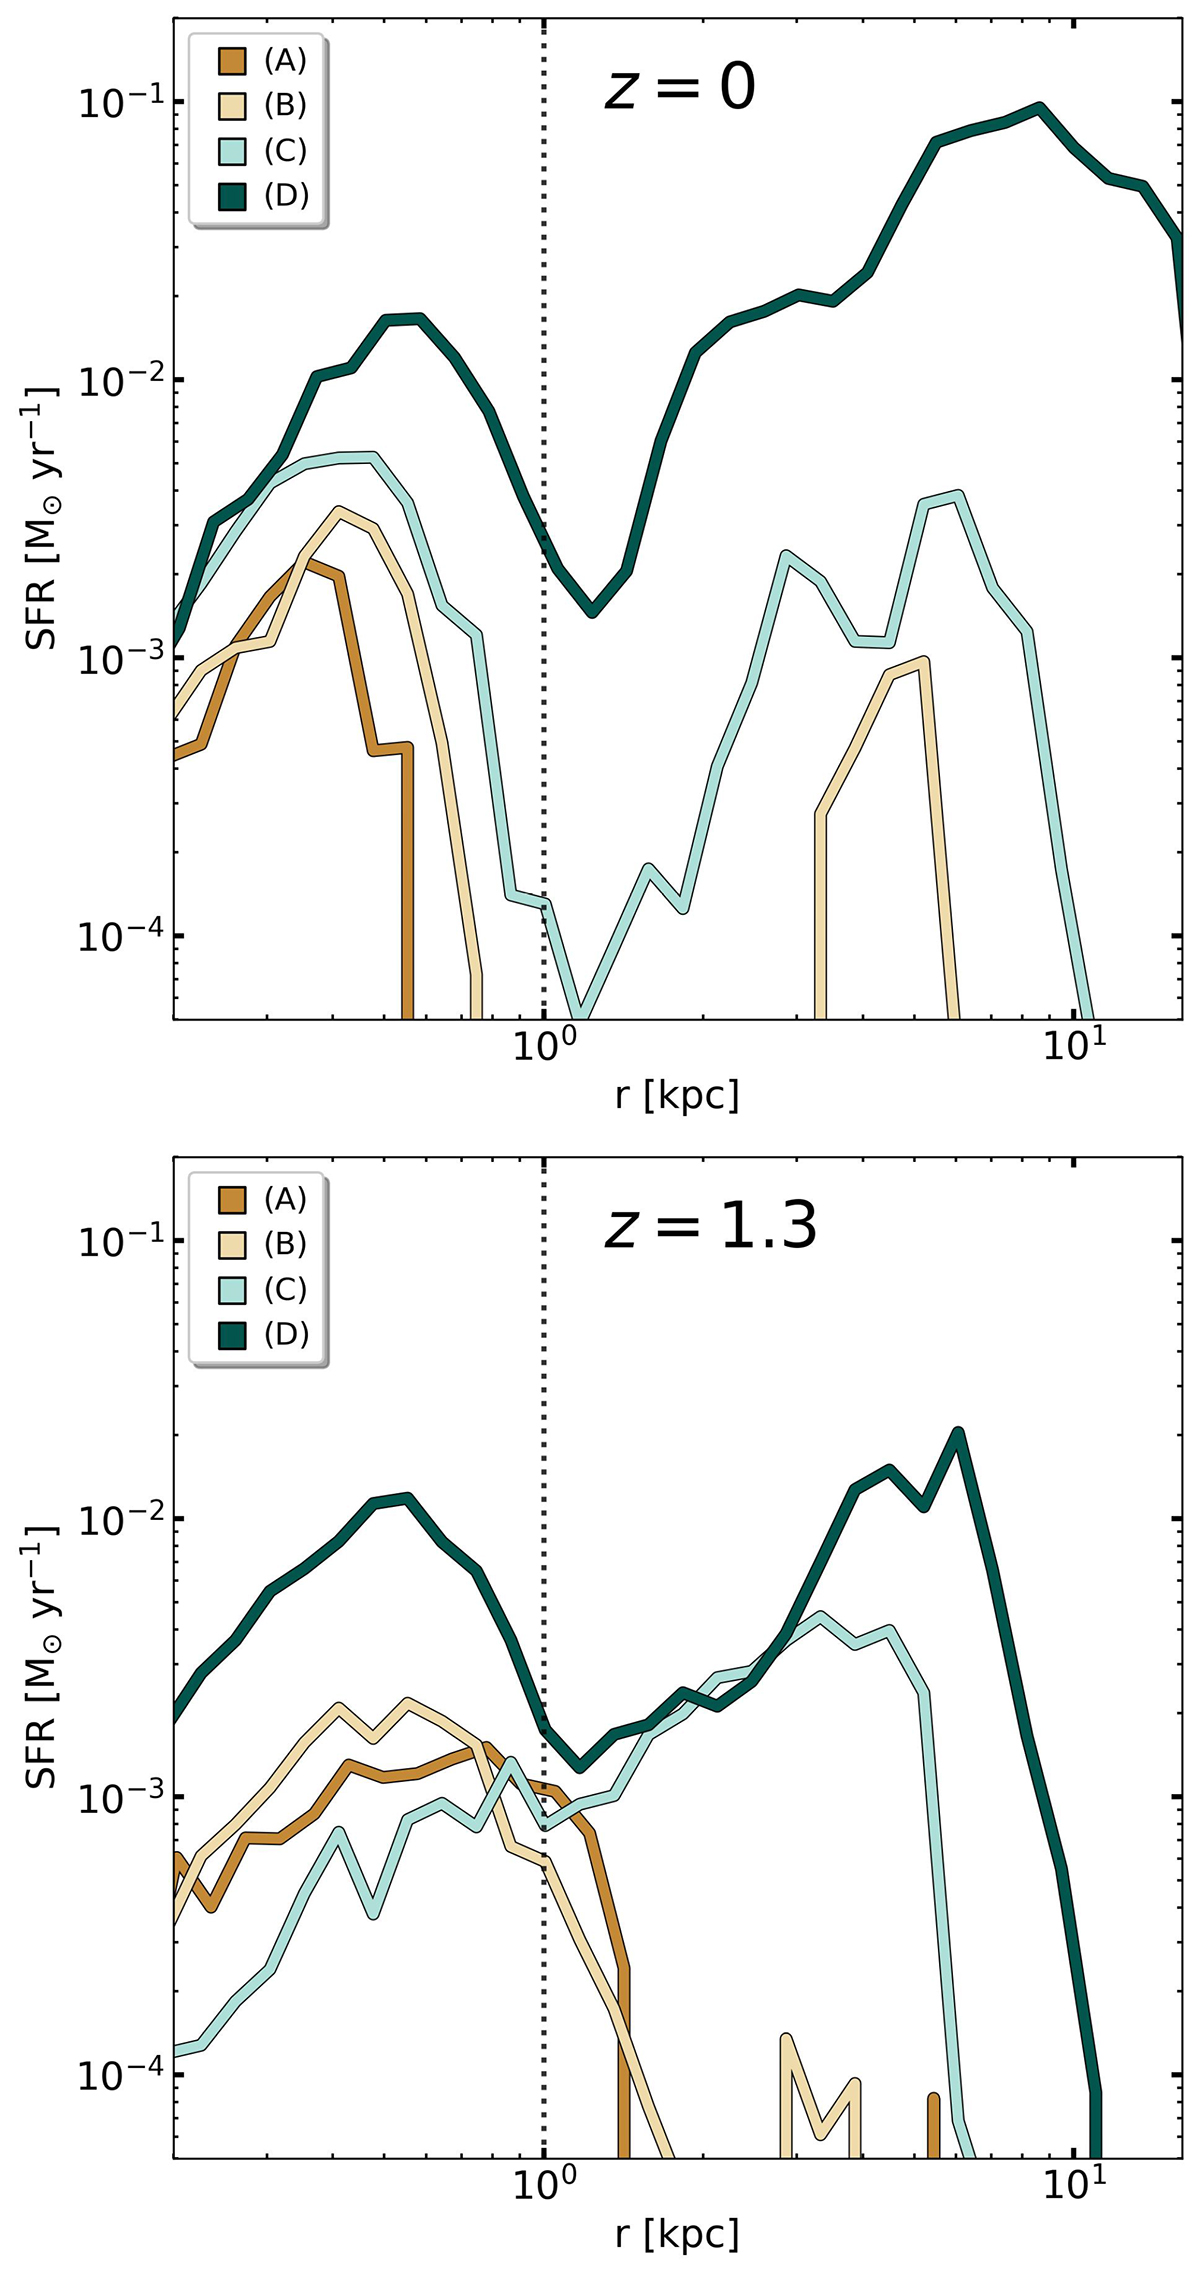
Fig. 4.
Download original image
Star formation rate (SFR) profiles for the example galaxies (A, B, C, and D) from Sect. 2 at z = 0 (cosmic time t = 13.8 Gyr, top panel) and at z = 1.3 (t = 4.8 Gyr, bottom panel). Colours are as for the squares in Figure 2: from brown for galaxy A (lowest stellar mass and κrot) to green for galaxy D (highest mass and rotational support). In the presence of a star forming inner clump, the profiles show a relatively quiescent zone between 1 kpc and 2 kpc that separate the central region with the outer gaseous disc. The latter is more extended and more star forming at higher masses, while the size of the unresolved clump evolves slightly. We indicate a galactocentric distance of r = 1 kpc, encompassing most inner star formation, with a grey, dashed vertical line.
Current usage metrics show cumulative count of Article Views (full-text article views including HTML views, PDF and ePub downloads, according to the available data) and Abstracts Views on Vision4Press platform.
Data correspond to usage on the plateform after 2015. The current usage metrics is available 48-96 hours after online publication and is updated daily on week days.
Initial download of the metrics may take a while.